LSE:MATD
AIM All-Share
Petro Matad Ltd
Oil, Gas and Coal
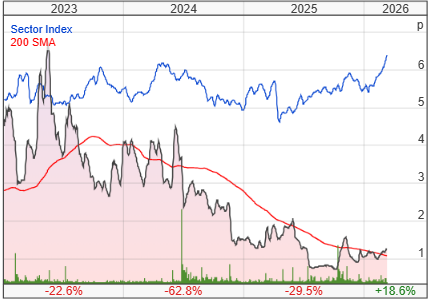
1.075p 0p 0.00% (as of close on 28/7/26)
| Market cap (m) | £20.0 |
| Enterprise value (m) | £17.7 |
Petro Matad Ltd consisted of oil exploration ande xploitation and investment in renewable energy projects in Mongolia. The Company sells its produced crude. It has one operating segment. It has presence in Mongolia.
Last Updated: 30/05/2026
Expects approval of an oil sales agreement with PetroChina. Heron-1 continued to perform in line with forecast with a stable water cut; the approved development plan includes later-life water injection to maintain reservoir pressure. Gazelle-1 production has been optimized and the water cut has stabilized.
Discussions with a potential farminee remain ongoing pending completion of seismic reprocessing of Block XX data by the counterparty; the company is also engaging with other potential partners for Block XX and Block VII. It received an offer from a seismic contractor to conduct a high’resolution 3D survey over the Block XX exploitation area and is evaluating the proposal; crews could start in late June or early July.