Stock Watch: easyJet
Last week, I showed you how you could use the power of SharePad to quickly learn about a share (click here to read the article) and whether it might be a good investment or not. I used airline company easyJet (LSE:EZJ) as an example and quickly found out the following key bits of information:
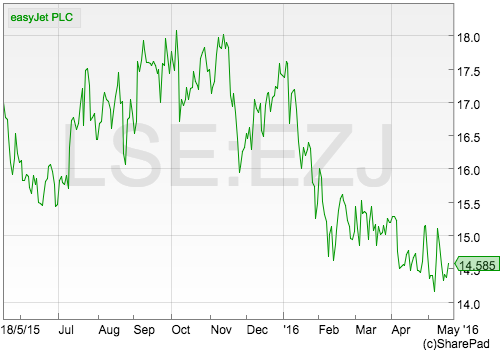
- Its shares have not been very popular with investors in recent months with the share price falling significantly since the start of 2016.
- Some professional investors seemed to be worried about the company's performance.
- The business had made big improvements in its profit margins and return on capital employed (ROCE) in recent years. Both measures were at record highs in 2015.
- Its free cash flow performance had been poor, probably because it has been spending heavily on new assets.
- The company started paying a dividend to shareholders in 2011. Dividend growth since then has been impressive with two special dividends being paid as well.
- The valuation of the shares has fallen to potentially cheap levels.
This week, easyJet has reported its half year results for the six months to March 2016. So in this article, I am going to take the analysis of easyJet to a more advanced level. I'll give you a few pointers about how to weigh up the performance of an airline and also show you how SharePad is really good for digging into the finances of a company and helping you become a better-informed investor.
In particular, I'll be looking at the following areas in more detail.
- The operating performance of the company and how well it is doing.
- The development of easyJet's ROCE and how sustainable it might be.
- Why free cash flow has been so poor and what the underlying cash generation might be. I'll also look at the ability of easyJet to pay its dividend from its cash flow.
- The valuation of easyJet shares and how they compare with other airlines.
Want to learn how to analyse shares like a professional? Download our FREE guide.
Sign-up to our mailing list to receive a PDF of our Step-by-Step Guide to Investing.
Share this article with your friends and colleagues:
How is easyJet performing?
Airline companies are great at giving investors lots of useful information to help them understand their businesses better. Read any financial report from an airline and you will be bombarded with lots of different numbers. These will be scrutinised in immense detail by professional analysts.
The good news for the more diligent private investor is that a little goes a long way here. You can concentrate on just a few key numbers and greatly enhance your understanding of how well the airline is performing.
I've boiled down a simple analysis of easyJet into the following key numbers:
- Seats flown - often referred to as capacity. In order to grow their sales and profits, many airlines increase the number of seats they put on the market. They do this by adding new planes and new routes from the airports they operate from. They have to be careful not to add too much new capacity too quickly as half-empty planes are not profitable.
- Passengers carried - you can't make money if you don't carry passengers. More is usually better but not if the airline has to slash prices to get them on board.
- Load factor - the number of passengers carried as a percentage of seats flown. It measures how full on average an airline's planes are. Higher load factors are better than lower ones.
- Revenue per seat - this is made up of the ticket prices plus sales from things like food and drink on board.
- Cost per seat - airlines have lots of costs such as airport landing charges, baggage handling, plane ownership costs (leases and depreciation), maintenance, cabin crew, air traffic control and fuel. A lot of these costs have to be paid whether the plane is full or half empty. To keep its fares attractive to customers and to stay competitive, easyJet has to keep a lid on these costs. A breakdown of these costs is shown below:
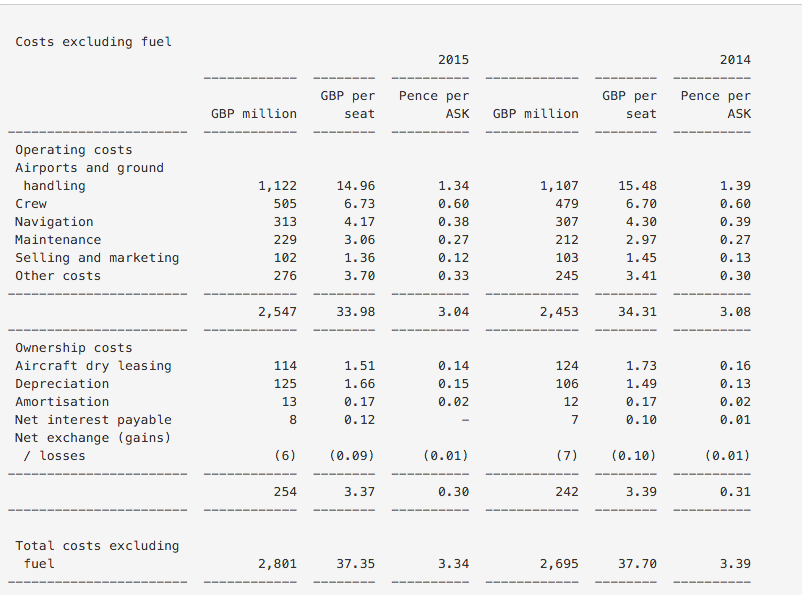
ASK = available seat kilometre
When I am looking at a company I try to get at least ten years' of data so that I can see the development of any trends over time. If possible, I like to see how a company has performed in a recession as this is a key test - the key test - of how resilient its profits are likely to be.
Let's have a look at how easyJet measures up.
| Year | 2006 | 2007 | 2008 | 2009 | 2010 | 2011 | 2012 | 2013 | 2014 | 2015 |
|---|---|---|---|---|---|---|---|---|---|---|
| Seats flown (m) | 38.9 | 44.5 | 51.9 | 52.8 | 56 | 62.5 | 65.9 | 68 | 71.5 | 75 |
| Passengers carried (m) | 33 | 37.2 | 43.7 | 45.2 | 48.8 | 54.5 | 58.4 | 60.8 | 64.8 | 68.6 |
| Load factor | 84.80% | 83.60% | 84.20% | 85.60% | 87.10% | 87.20% | 88.60% | 89.40% | 90.60% | 91.50% |
| Revenue/seat | £41.66 | £40.42 | £43.51 | £50.47 | £53.07 | £55.27 | £58.51 | £62.58 | £63.31 | £62.48 |
| Cost ex fuel/seat | £28.36 | £26.55 | £29.49 | £34.36 | £36.62 | £36.62 | £36.25 | £38.17 | £37.70 | £37.35 |
| Fuel cost/seat | £9.98 | £9.57 | £13.65 | £15.28 | £13.09 | £14.68 | £17.45 | £17.38 | £17.49 | £15.98 |
| Total cost/seat | £38.34 | £36.12 | £43.14 | £49.64 | £49.71 | £51.30 | £53.70 | £55.55 | £55.19 | £53.33 |
| Profit per seat | £3.32 | £4.30 | £0.37 | £0.83 | £3.36 | £3.97 | £4.81 | £7.03 | £8.12 | £9.15 |
We can see that the company has grown both its capacity and passengers strongly over the last ten years. It is encouraging to see that the load factor has also improved significantly as routes have become established and easyJet has attracted more passengers onto each plane.
Revenue per seat has increased but has not changed much during the last three years. This figure depends on many things such as the destination of the routes flown, the type of passenger (business passengers tend to pay more than holidaymakers), the competitive landscape (such as a price war), the price of jet fuel and changes in exchange rates.
The cost per seat excluding fuel has increased but has been very stable for the past five years. The rise in fuel costs has pushed up total seat costs a little.
You can see that easyJet has done a good job of increasing its profit per seat since 2010 from £3.36 to £9.15. Add on the growth in the number of passengers since then from 48.8m to 68.6m and you can see how it has been able to post an impressive growth in its profits.
However, take a look at the performance in 2008-09 at the time of the financial crisis and recession. Back then easyJet's profits per seat collapsed. But it carried more passengers, its load factors went up and revenue per seat increased. The problem seemed to be its costs going up, particularly fuel. More research is needed here, but a recession did not seem to result in a fall in demand as you might have expected. Perhaps people were trading down from more expensive airlines or maybe easyJet's business model of basing itself around major European cities might be quite resilient?
But we learned from the first article that some analysts were becoming concerned that easyJet's performance may have stalled somewhat recently. Let's take a look at what its recent half year results are telling us.
| H1 | H2 | 2015 | H1 | TTM | |
|---|---|---|---|---|---|
| Seats flown (m) | 32.2 | 42.8 | 75 | 34.5 | 77.3 |
| Passengers (m) | 28.9 | 39.7 | 68.6 | 31 | 70.7 |
| Load factor | 89.80% | 92.80% | 91.50% | 89.90% | 91.50% |
| Revenue/seat | £54.91 | £68.20 | £62.48 | £51.29 | £60.67 |
| Cost ex fuel/seat | £38.66 | £34.30 | £37.35 | £38.61 | £35.08 |
| Fuel cost/seat | £16.04 | £17.22 | £15.98 | £13.37 | £16.21 |
| Total cost/seat | £54.70 | £51.52 | £53.33 | £51.98 | £51.29 |
| Profit per seat | £0.21 | £16.68 | £9.15 | -£0.69 | £9.38 |
I've broken down easyJet's performance by half year and then calculated its trailing twelve month performance (TTM) to see how it has been getting on.
The first thing to note is that easyJet is a very seasonal business. It makes little or no money during the first half of its financial year between September and March. All of its money is made during the following spring and summer months when the holiday season peaks.
You can see that there is a big difference in the revenue per seat between the first and second halves of the year. The load factor is also lower in the first half. My guess here is that easyJet has to charge lower prices over the autumn and the winter to keep its planes nearly full. In the summer when people want to go on holiday it can put its prices up and have its planes slightly fuller.
easyJet looks to be performing reasonably well at the moment. During the first half of its current financial year it has grown its seats flown and number of passengers carried by just over 7% and maintained its load factor. Its revenue per seat has fallen by 6.6% as lower fuel costs have been passed on in lower ticket prices as well as a negative impact from changes in exchange rates. The cost per seat has stayed broadly the same at £38.61 whilst the fuel cost has fallen sharply. This has led to the total cost per seat falling by 5% (less than the fall in revenue per seat) which has meant that there is a slight loss rather than a slight profit in 2015.
On a rolling twelve month basis, revenues have fallen by less than costs and the profit per seat has increased to £9.38 which looks to be quite a good result.
I'll have more to say on easyJet's future prospects later.
easyjet's ROCE
ROCE is a key measure of how good a company is at producing returns for its investors. You can understand ROCE better by doing something known as DuPont analysis which looks at how ROCE is achieved (click here to read more about this).
I use the financial charting function in SharePad a lot. I find it really useful in showing me how a company has been performing on a particular measure. If I want to explore further I can look at the financial data or set up a custom financial table.
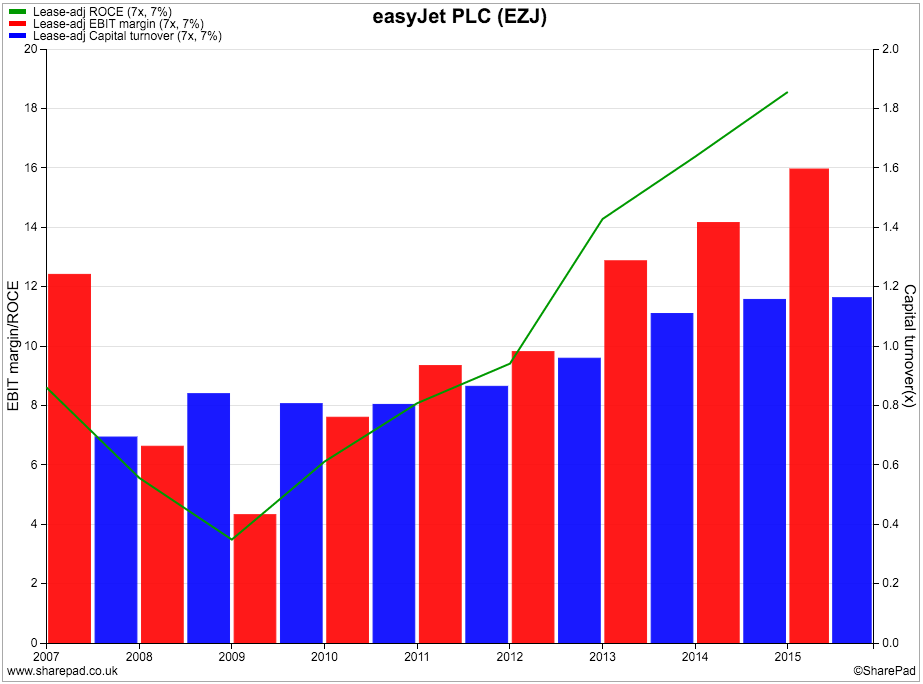
The green line in the chart above shows that easyJet's ROCE fell sharply in 2008 and 2009 but has risen sharply since then. ROCE is determined by a company's profit margins and its capital turnover (sales expressed as a multiple of the amount of money invested or capital employed). I can see that both profit margins and capital turnover have been increasing which is a good sign. ROCE at over 18% is a sign that easyJet could be a very good business - as long as it can sustain this performance.
So far ROCE seems to be holding up well in 2016 as shown in a custom financial table below which has calculated it on a TTM basis. Profit margins have fallen slightly but a slight rise in capital turnover has maintained the current high ROCE.
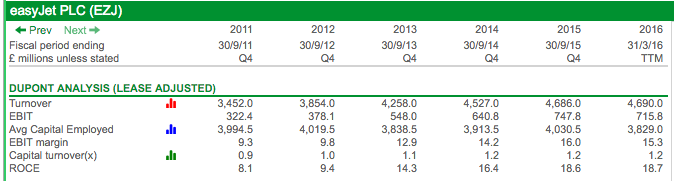
I'll have more to say on the sustainability of easyJet's ROCE shortly.
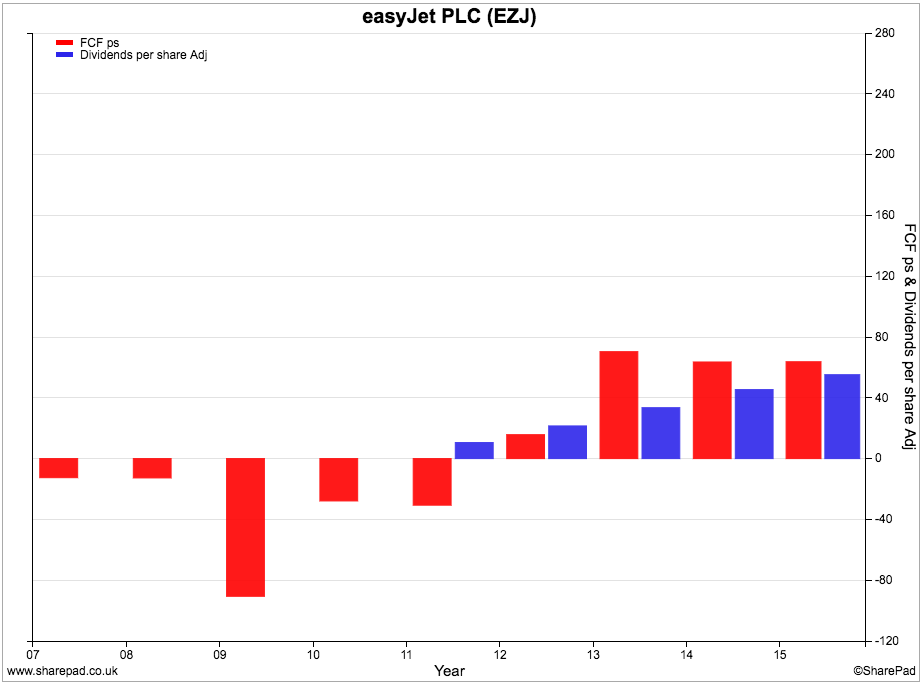
Free cash flow
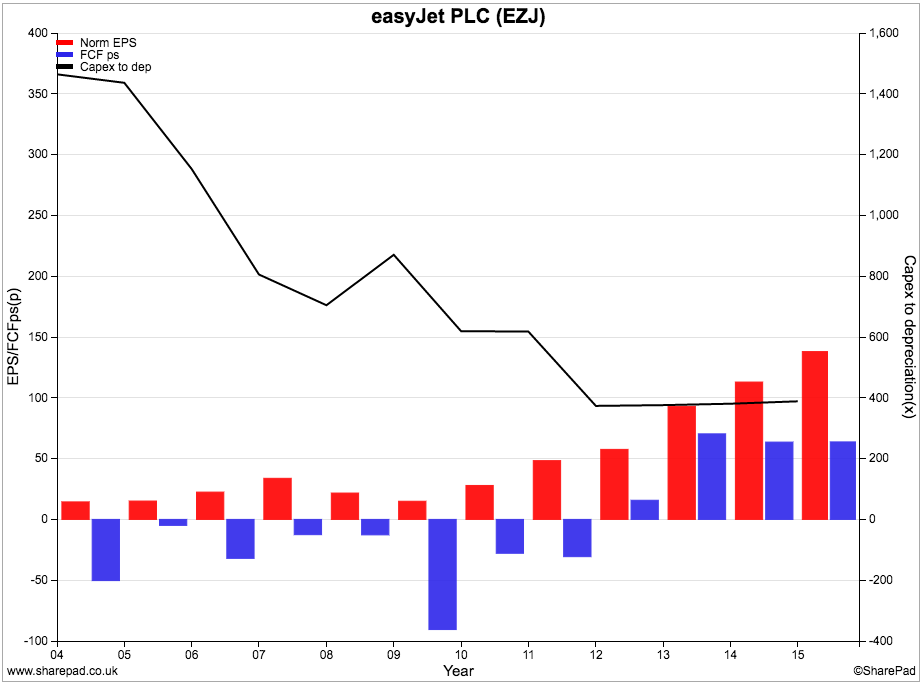
Up until a few years ago, easyJet's free cash flow performance had generally not been very good. The blue bars in the chart above show that free cash flow per share has been negative for much of the last decade whilst earnings per share (EPS) has been steadily rising in recent years. That said, the last three years has seen an improvement with free cash flow per share showing more consistency.
easyJet has not been massaging its accounts but has been investing heavily in new planes and other assets in order to grow. The black line in the chart above shows that capex has been many times its depreciation expense and this is why free cash flow has often been negative.
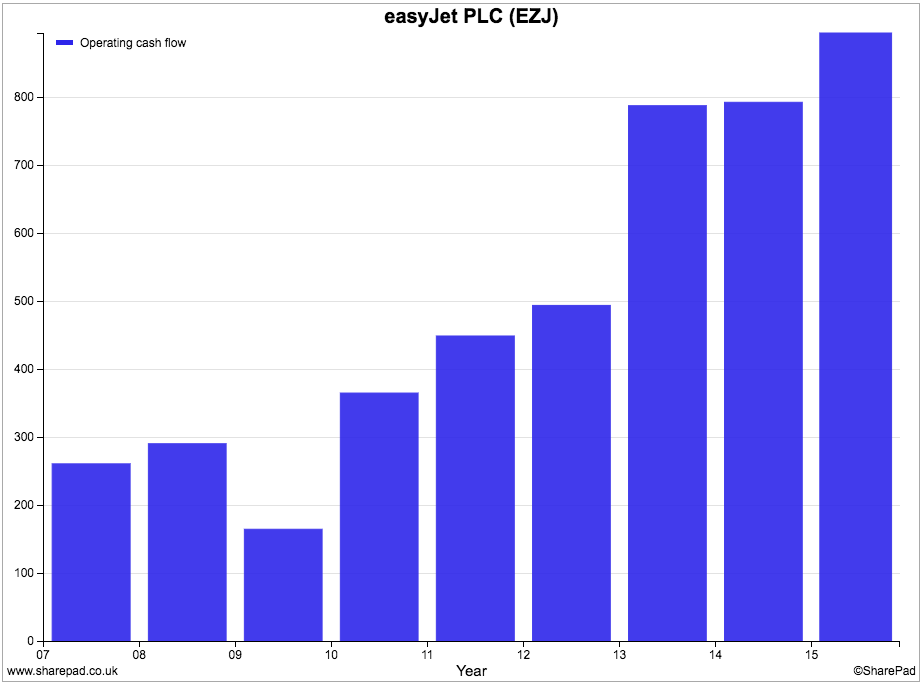
So how has easyJet been able to pay an increasing dividend as well as a couple of special dividends as well? Well the chief reason is because it has been generating impressive amounts of cash flow. The chart below shows that its operating cash flow - its cash flow from trading - has increased significantly.
If you take this cash flow number and take away tax paid and use depreciation and amortisation as an estimate of maintenance or stay in business capex then you can see that easyJet has had plenty of spare cash to pay a growing dividend and special dividends as well.
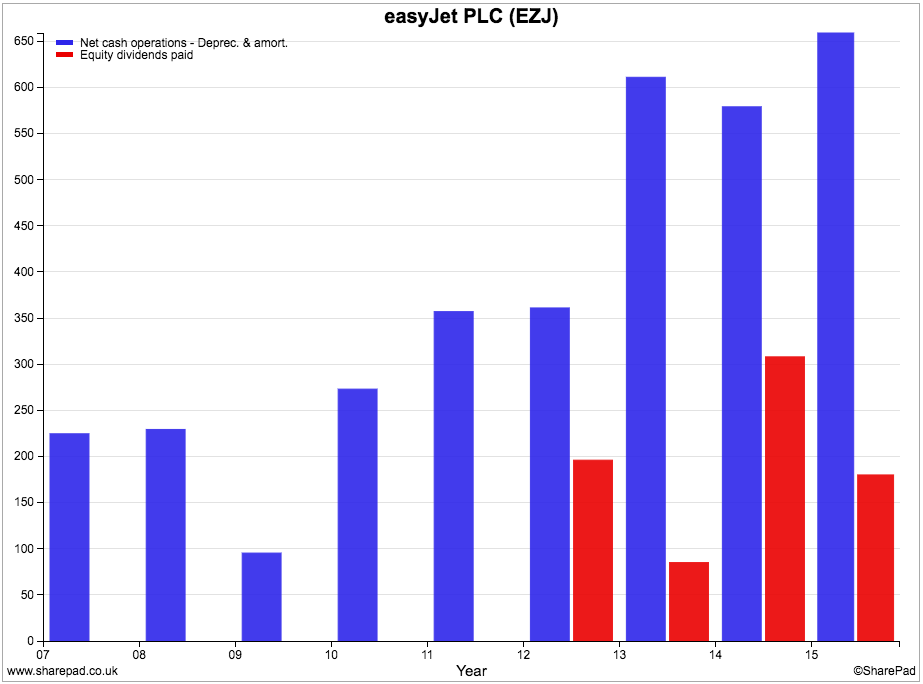
Even when all the spending on new assets to grow the business is included, easyJet's dividend is now covered by its free cash flow.
Yet easyJet is still spending nearly four times its depreciation and amortisation expense (£153m) on new assets (£579m). As the business matures this spending will come down - as a ratio of depreciation - and free up more cash for dividend payments. You can now begin to understand why easyJet has decided to become more generous with its dividend policy and pay out a bigger portion of annual profits to shareholders. This is a good sign in my view.
How easyJet's cash flow statement might mislead investors
Cash flow statements are usually straightforward. However, easyJet has complicated matters by treating the cash paid as dividends as a net operating cash flow. This is not correct in my opinion; it is a financing cash flow paid to providers of share capital.
Here is a snapshot of easyJet's net operating cash flow taken from its 2015 annual report.
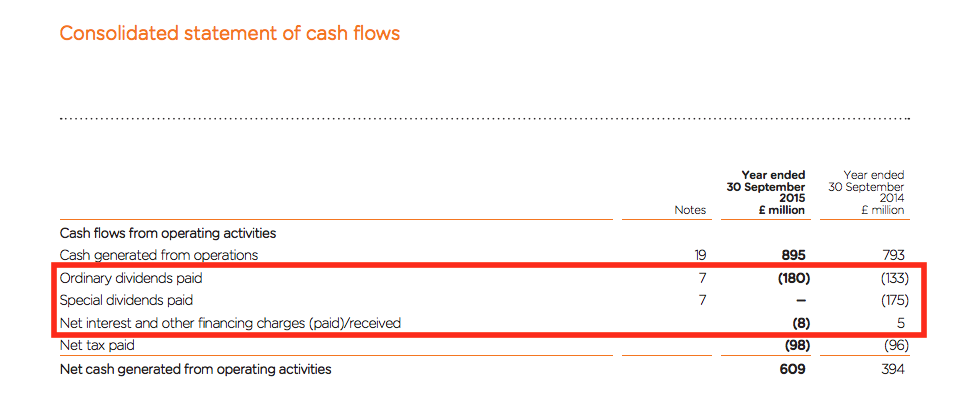
As you can see, easyJet generated £895m of operating cash flow in 2015. It then takes away £180m of cash dividends paid and £8m of net interest paid. Both of these are financing cash flows and most companies treat them as such.
easyJet is understating its net cash flow from operating activities by £180m. If you were to calculate easyJet's free cash flow for shareholders using the formula of net cash flow from operating activities less net interest paid less capex you would be understating free cash flow by £180m. The same would be true if you used another common formula: net operating cash flow less capex.
The whole purpose of calculating free cash flow is to work out how much cash flow is available to pay dividends. If cash dividends are already taken away from net operating cash flow you will understate free cash flow. This might lead you to believe that easyJet is not as good a business as it is in reality and that it does not have enough cash flow to pay dividends.
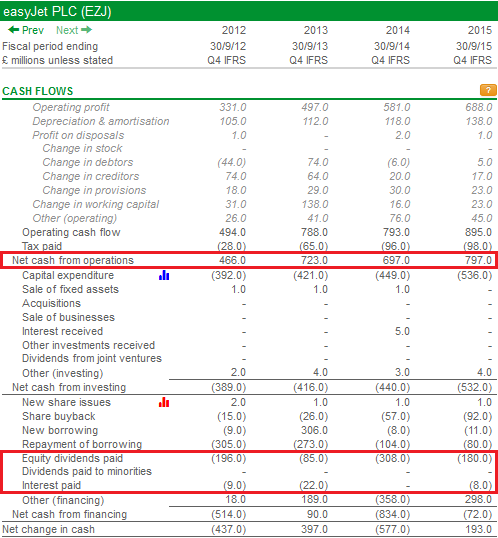
In SharePad, the values for equity dividends paid and net interest paid have been changed to financing cash flows. It means that our net cash from operations value differs to the company accounts but our free cash flow numbers are much more realistic.
We work with our data provider on a continual basis to develop smarter data collection policies like this and present data in a clear and consistent manner.
Valuation and future prospects
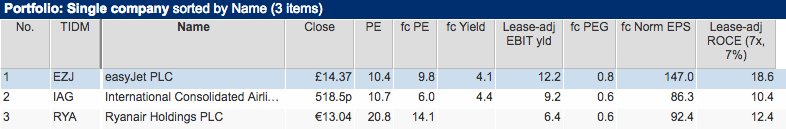
There is a case for arguing that easyJet shares are attractively valued at a share price of £14.37. They trade on a forecast PE ratio of just over 10 and a PEG of just 0.8 which suggests that the shares are attractive compared with the expected EPS growth. A lease-adjusted EBIT yield of 12.2% is reasonably attractive too if you believe that the current level of profits is sustainable.
The forecast dividend yield of 4% is probably understated. As I am writing this article shortly after the publication of easyJet's half year results, City analysts' forecasts have not been updated for the change in dividend policy announced by the company. Going forward it will pay out half its EPS as a dividend which suggests a dividend per share for 2016 of 73.5p (147p EPS divided by two) and a forecast dividend yield of 5.1% (73.5/1437).
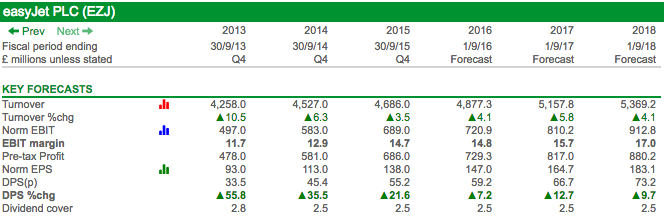
The company reiterated its confidence in the consensus of City analysts' profit forecasts for 2016 and, as you can see below, further significant profit growth is expected in 2017 and 2018.
The profits of airline companies are notoriously hard to predict even in the short run as they are subject to lots of different forces and risks. Here are few things to consider:
Industry capacity
One of the biggest dangers of operating in the airline industry is that too much capacity comes on to the market at the same time. Given the high level of fixed costs, planes need to be fairly full (c70% full give or take a few percentage points) just to break even. After break even, the fuller the planes the more profit they tend to make. However, if there are too many planes chasing too few passengers then airlines have to slash fares to fill their planes up and this can lead to lower profits and lower ROCE. This is something that needs to be watched closely.
easyJet is adding 6.5% more capacity this summer (2016) but it expects its markets to see overall increases of 7.7% as falling fuel prices make it cheaper to put more planes in service. This could put pressure on prices. Whilst easyJet's summer bookings are in line with last summer's it does expect revenue per seat to fall by 7% - although a large chunk of this will be the passing on of lower fuel costs to customers.
Costs and exchange rates
easyJet expects if cost per seat to fall by 1% for the rest of 2016 and is targeting no further increases in costs until 2019 before fuel. It is buying rather than leasing most of its fleet to keep costs down and is also ordering bigger 180 seat Airbus A320s which bring down the cost per seat significantly compared with its existing A319s.The company's full year fuel bill is expected to fall by £170-£180m to around £1.12bn.
The company's profits can be very sensitive to changes in fuel prices and exchange rates as shown in the table below. This is why it has hedged its fuel costs and currency exposures to keep the risk of nasty surprises low.
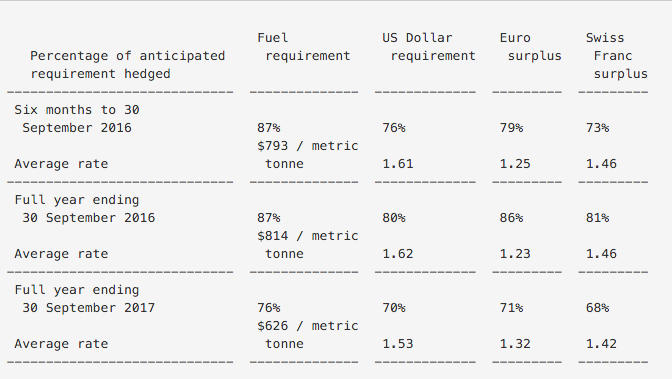
A $10 change in the price of fuel effects easyJet's 2016 profit before tax by around £1m. A 1% change in the GBP/USD exchange rate affects PBT by around £0.9m.
To sum up
- easyJet seems to be performing well.
- Key measures such as profit per seat flown, load factors and ROCE are stable or improving.
- Free cash flow has improved significantly in recent years.
- The company is still investing heavily in new assets. When the business matures and investment in growing the business is scaled back, free cash flow could increase significantly which could allow much bigger dividends to be paid.
- easyJet's published cash flow statement understates its net operating cash flow by deducting dividends paid. This could lead to investors incorrectly understating its free cash flow.
- Industry capacity is growing strongly in easyJet's key markets.
- This needs to be watched. Too many planes chasing too few passengers could see pressure on easyJet's fares, load factors, profits and ROCE.
If you have found this article of interest, please feel free to share it with your friends and colleagues:
We welcome suggestions for future articles - please email me at analysis@sharescope.co.uk. You can also follow me on Twitter @PhilJOakley. If you'd like to know when a new article or chapter for the Step-by-Step Guide is published, send us your email address using the form at the top of the page. You don't need to be a subscriber.
This article is for educational purposes only. It is not a recommendation to buy or sell shares or other investments. Do your own research before buying or selling any investment or seek professional financial advice.

