DuPont Analysis: a simple, quick and very powerful way to analyse a company
Regular readers of my articles will know how much I bang on about a company's financial returns - the money it gets back as a percentage of how much it invests. To me it is the key measure as to whether a company is worth investing in or not.
It is why I spend a lot of time looking for companies with a consistently high return on capital employed (ROCE) and free cash flow return on investment (CROCI). Just as putting your money in a savings account with a higher rate of interest usually makes sense, the same can be said for investing in companies with higher returns on investment - at the right price of course.
But it's not just about picking companies with high ROCEs and CROCIs. You need to understand how a company makes its high returns. The good news is that there is a very good way for all investors to do that.
Want to learn how to analyse shares like a professional? Download our FREE guide.
Sign-up to our mailing list to receive a PDF of our Step-by-Step Guide to Investing.
Share this article with your friends and colleagues:
Introducing DuPont Analysis
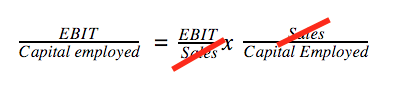
This technique was devised by Donaldson Brown in 1919 when he worked for the US chemical company DuPont. He broke down a company's ROCE into its constituent parts. In very simple terms, ROCE is the product of a company's profit margin (the proportion of sales that turns into profit) and capital turnover (the value of sales produced per £1 of capital invested).
ROCE = profit margin x capital turnover
Just to prove to you that this is true, I've laid out the calculations for these three ratios below. A bit of basic secondary school maths means that the sales figure on the bottom of the profit margin calculation and on the top of capital turnover calculation cancel each other out when the two ratios are multiplied.
I think that the DuPont analysis is one of the simplest and most powerful ways to analyse a company's financial performance. I use it extensively when researching my own investments because it allows me to quickly focus on the most important bits of information about a company. It helps you understand it better and to focus your research efforts.
I spend my time thinking about how profit margins and capital turnover are determined and how they might change in the future. Let's look at profit margins first.
Profit margins
Profit margins are determined by lots of different factors. The bigger the gap between revenue coming into the company (the prices of all goods and services sold multiplied by the quantity sold) and costs, the bigger its profit margin.
The key influences on profit margins are:
- Prices - higher prices can boost margins and vice versa
- Costs
- Mix of products - some sales are more profitable than others. A car dealer will make little profit on selling a new car but will make lots on selling services and spare parts.
- Volume sold - selling more products can boost margins where the company has a high proportion of fixed costs. This is known as operational gearing. This process can also work in reverse and is clearly seen in manufacturing companies.
Capital turnover
This looks as how effectively a company is spending its money to produce sales. It can increase capital turnover by adopting some of these measures:
- Boosting sales with new products
- Reducing money invested
- Cutting working capital - holding less stocks of finished goods, getting customers to pay their bills faster and paying suppliers later.
- Cut capex - reduce spending on new assets or increase efficiency by getting more for less.
- Get rid of underperforming assets that have low capital turnover and low ROCE.
As with most things, the best way to understand something is to look at some examples. This is easily done in SharePad either with charts or a custom results table.
Here are some different companies with different profit margins, capital turnover and ROCE.
High margin, low capital turnover - National Grid
National Grid has high profit margins compared with many companies. It needs these high profit margins to support the very high levels of investment in its business.
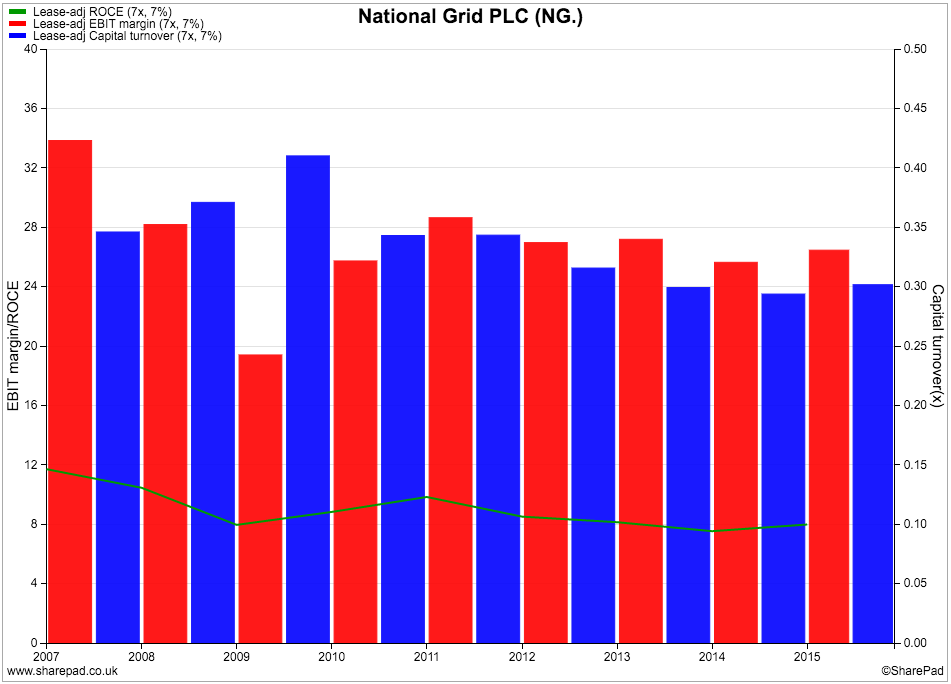
Profit margins are above 25% but the company only generates around 30p of turnover for every £1 invested and earns a very modest ROCE of 8%. Most of National Grid's profits are regulated and are effectively guaranteed for a period of time. As you can see, its margins, capital turnover and ROCE have been relatively stable in recent years.
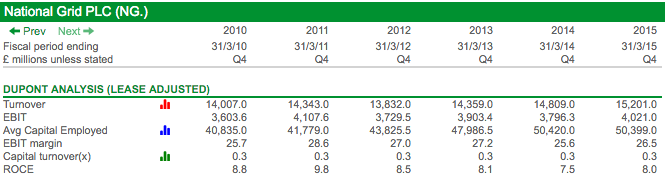
Note to SharePad users: You can create a custom results table like this for yourself. In SharePad's Financial view, click on the Custom button. If you need help, please don't hesitate to call our friendly customer support team.
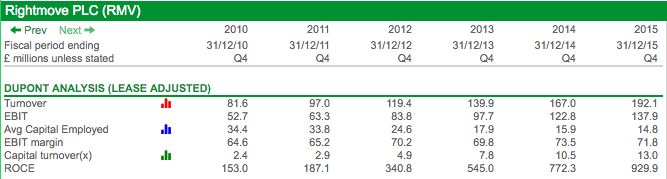
High margin, high capital turnover - Rightmove
Rightmove is arguably a dream scenario for any company - high profits and high capital turnover with astronomic ROCE.
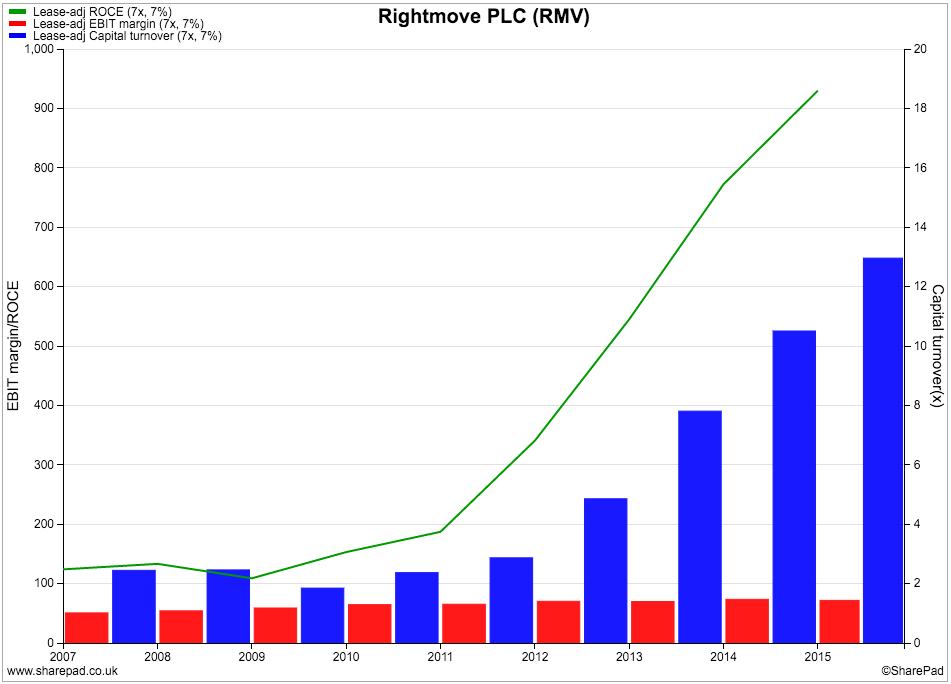
Turnover and profits have been rising nicely whilst capital employed has been falling. ROCE has gone through the roof and it is not really surprising that Rightmove shares are highly valued by the stock market.
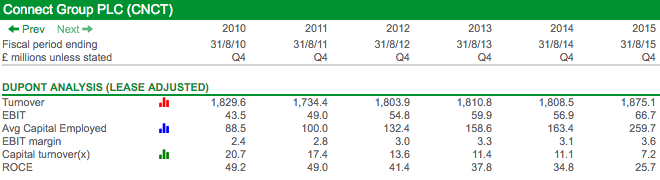
Low margin, high capital turnover - Connect Group
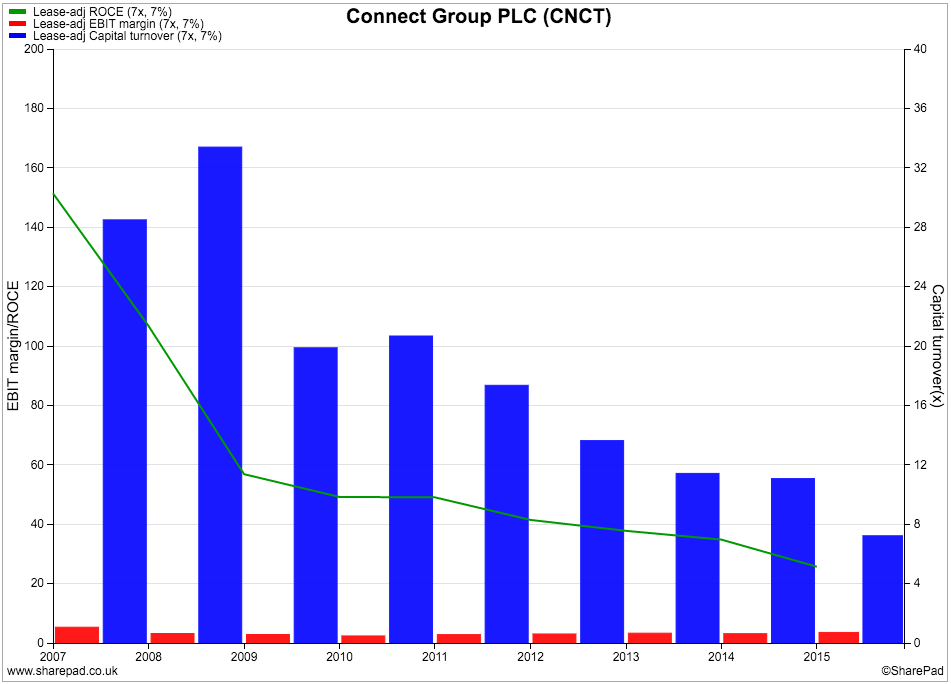
Connect Group is a business that generates a high ROCE via high capital turnover and very low profit margins (click here to see my analysis of Connect Group shares). Although margins have gone up, ROCE has fallen due to a steep fall in capital turnover.
Spotting changes with DuPont analysis
The thing I really like about DuPont analysis is that it can be very helpful in spotting changes in a company's fortunes both good and bad. Let's have a look at a few examples.
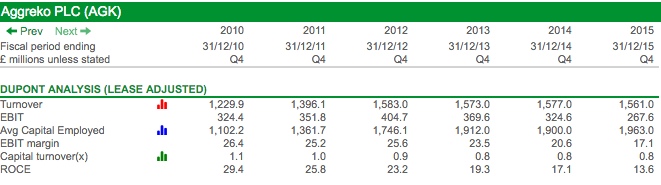
Aggreko went through a purple patch with rising profit margins and ROCE. However, when ROCE peaked at nearly 30% in 2010, capital turnover had started to fall.
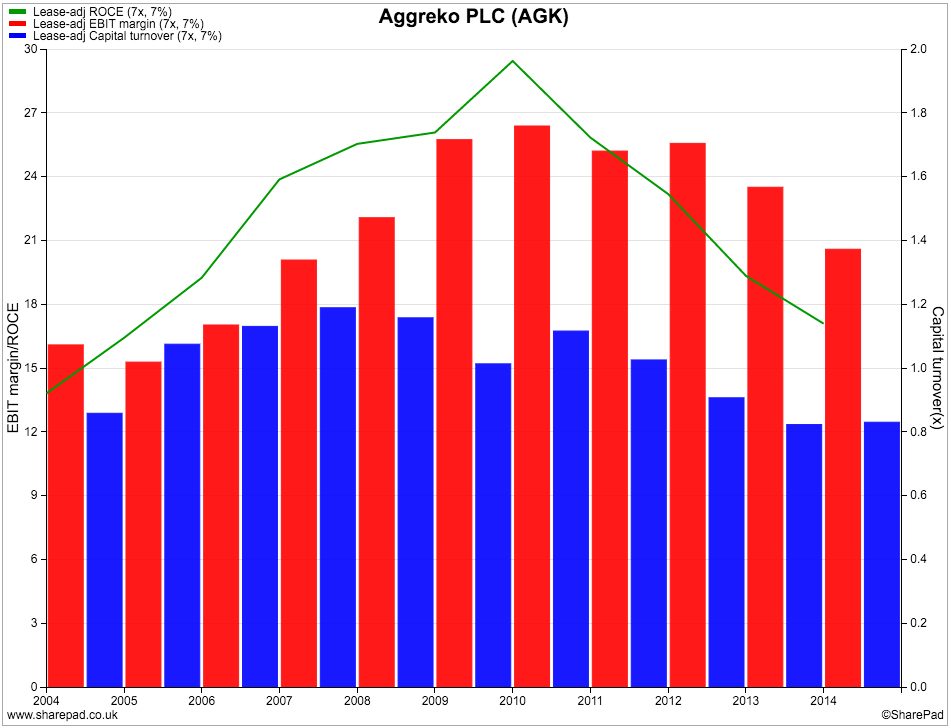
When you see a company that has seen ROCE driven primarily by rising and high profit margins a falling capital turnover ratio can be a sign of trouble if profit margins subsequently take a tumble as well. If this happens then ROCE can collapse.
This is what happened with Aggreko. Capital turnover fell from 1.1 to 0.8 between 2010 and 2013. When margins fell sharply in 2014 and again in 2015, ROCE followed suit and is less than half of its peak levels.
The example of InterContinental Hotels shows a company where its fortunes were turning up.
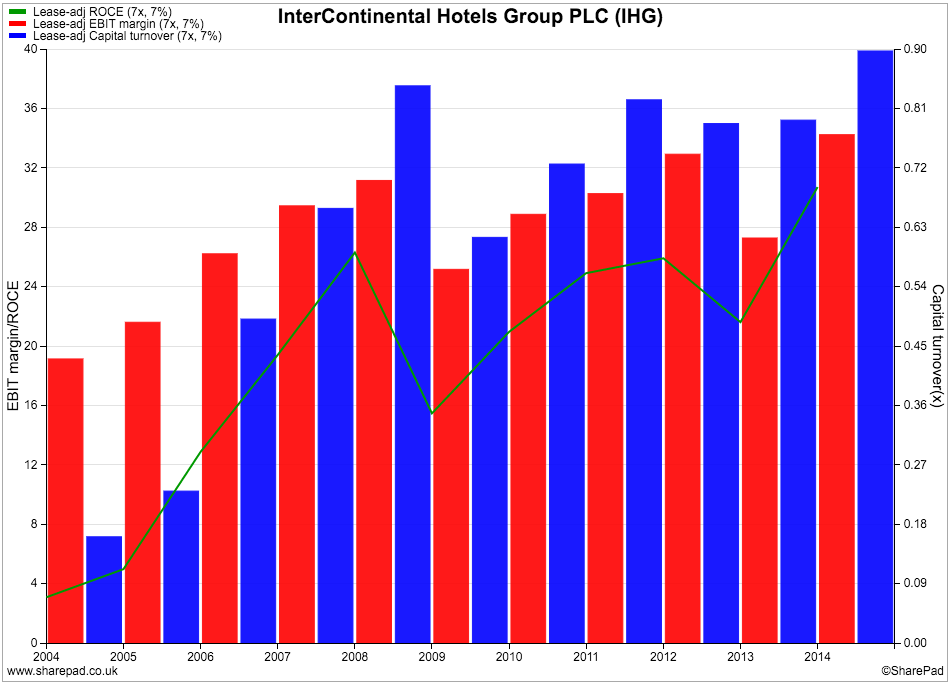
IHG used to own lots of expensive large hotels. Even though profit margins were high, capital turnover ratios were very low back in 2006. The company then decided to sell many of these big hotels and turn into a franchisor. Profit margins stayed high but capital turnover and ROCE moved sharply higher.
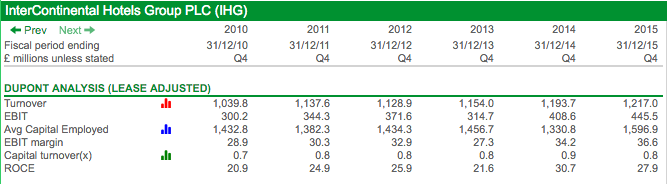
Since the end of the last recession in 2009, capital turnover and margins have moved higher and the company is earning a very high ROCE.
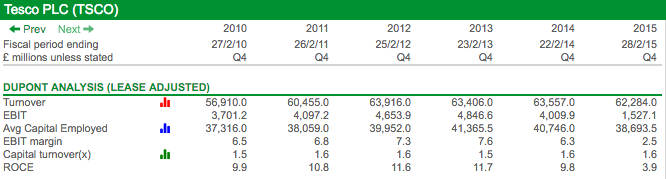
Tesco's problems have been well documented but could investors have spotted trouble ahead? Yes, they could. Whilst many people focused on profit margins, they ignored what was happening to Tesco's capital turnover.
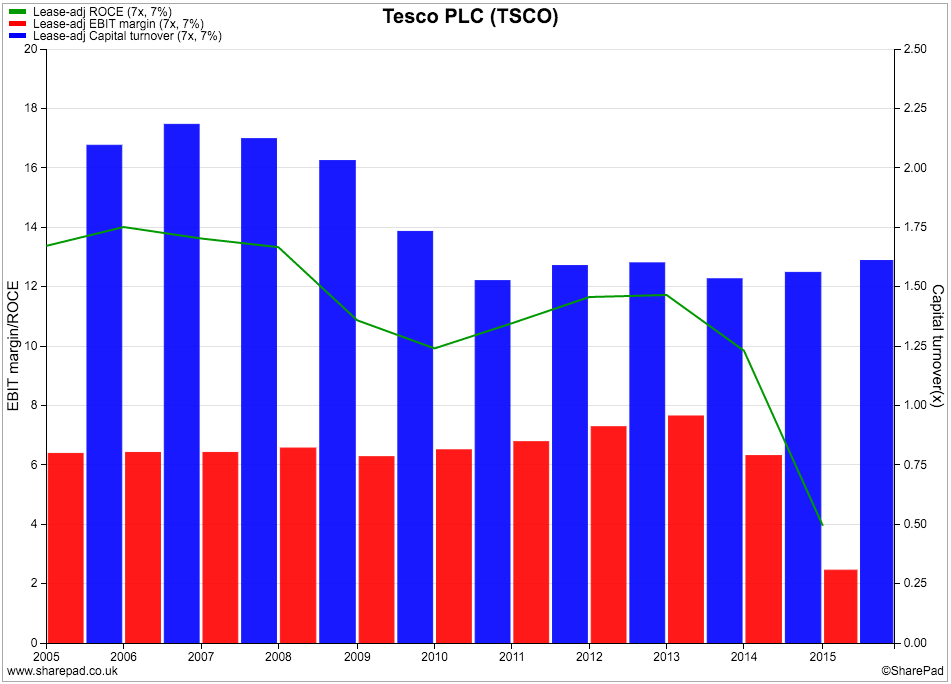
The company used to comfortably generate more than £2 of sales per £1 of capital invested. However, a spending spree across the world and the selling and renting back of supermarkets (which would have been missed in non-lease-adjusted studies) has seen this fall to £1.60. When profits were misstated and competition increased, profit margins and ROCE collapsed.
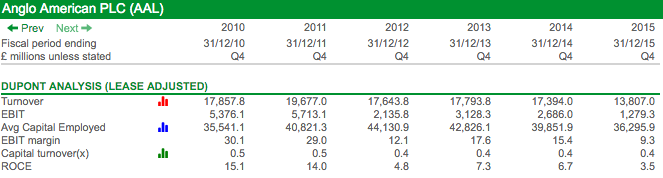
DuPont analysis clearly shows the risks of investing in economically sensitive companies such as miner Anglo American.
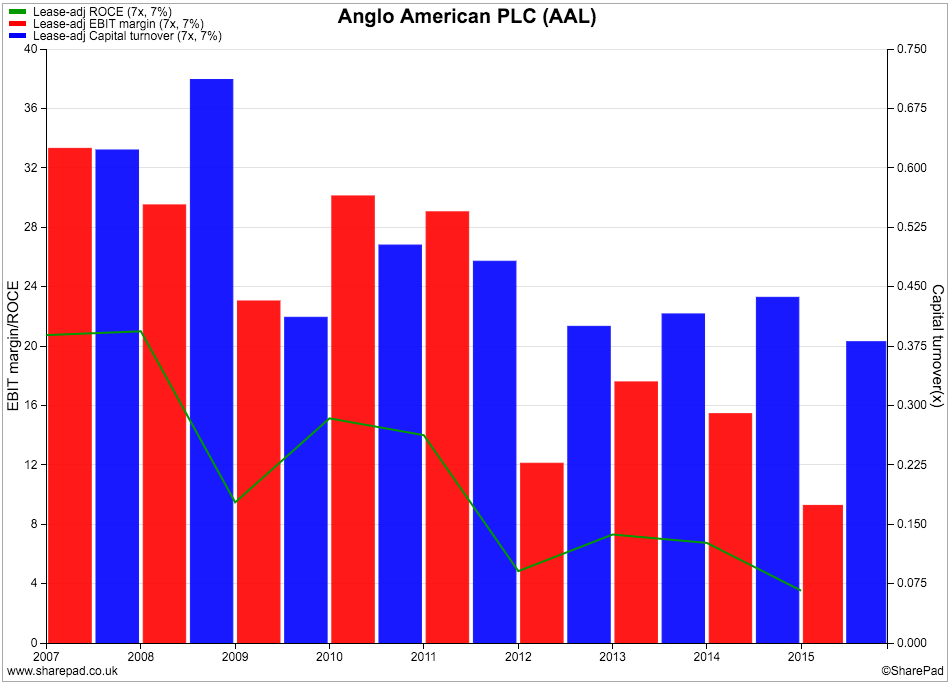
The profit margins of miners are heavily influenced by commodity prices. At the same time they are heavy investors in assets and have a low capital turnover ratio. They can only seem to earn an acceptable ROCE when profit margins are high. When they are not, they struggle to make attractive returns for investors.
To sum up
- ROCE is a key measure of how good a company is.
- DuPont analysis is very helpful in understanding how a company generates its ROCE.
- It helps to you focus on the key drivers of profit margins and capital turnover and can help you make better investment choices.
- Different industries have different ROCEs made up of different mixes of profit margins and capital turnover.
- Examining the trends in profit margins and capital turnover can help you spot improving and deteriorating companies.
Disclosure: Phil Oakley owns shares in National Grid and InterContinental Hotels Group.
If you have found this article of interest, please feel free to share it with your friends and colleagues:
We welcome suggestions for future articles - please email me at analysis@sharescope.co.uk. You can also follow me on Twitter @PhilJOakley. If you'd like to know when a new article or chapter for the Step-by-Step Guide is published, send us your email address using the form at the top of the page. You don't need to be a subscriber.
This article is for educational purposes only. It is not a recommendation to buy or sell shares or other investments. Do your own research before buying or selling any investment or seek professional financial advice.

