How to analyse a share quickly
Regular readers of my articles will realise that SharePad allows you to do a huge amount of useful, in-depth research on a company. With over twenty years of financial data available it is possible learn a great deal about how a company has performed in the past under different business conditions. This is a great benefit when you are thinking about what might happen in the future and whether you might buy or sell the shares of the company concerned.
But what can you do before you plunge in and start asking SharePad to do lots of number crunching for you? After all, many of us have other things to do with our lives; we do not want to waste too much time looking at bad companies.
In this article I am going to go back to basics. I am going to put myself in the position of a SharePad user who has found a company that they wish to learn more about and show you how to quickly move around the software to find out what's going on.
What you'll see is that you can learn a great deal about a company and whether it shares are attractive or not in less than five minutes.
Want to learn how to analyse shares like a professional? Download our FREE guide.
Sign-up to our mailing list to receive a PDF of our Step-by-Step Guide to Investing.
Share this article with your friends and colleagues:
Looking at easyJet
Let's say that you have decided to look at the shares of airline company easyJet (LSE:EZJ) and have successfully located it in SharePad using the orange Search button on the main toolbar.
The first thing I would do is look at its share price chart to see how the shares have been performing lately. You can do this by clicking on the green Chart button on the main toolbar.
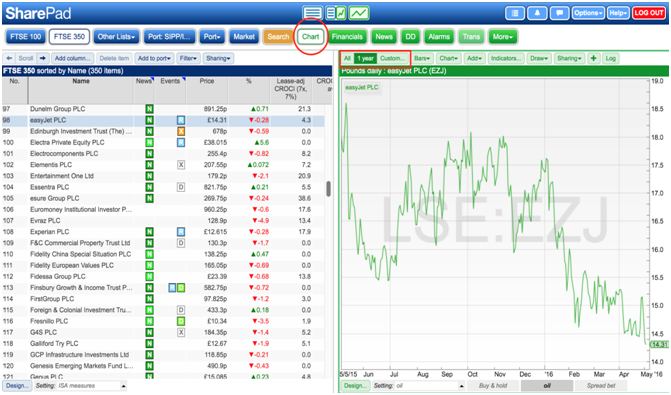
By default the Buy and hold chart setting shows the last year's price history. In the top left of the chart view, you can see your timescale options. In the screenshot above, you can see 1 year is highlighted. To show a different time period, use the Custom... button. To see the full price history, click on the All button. You can also zoom in and out on an ad hoc basis by clicking and dragging the mouse cursor on the chart itself.
Let's look at the one year chart in more detail.
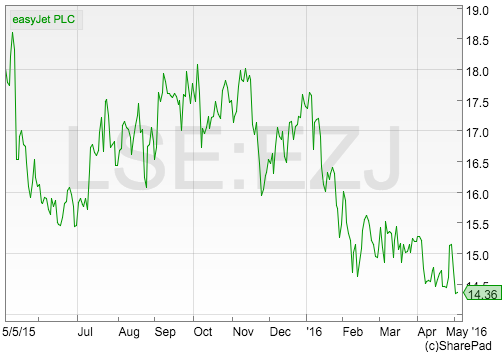
You can quickly see that easyJet shares have fallen significantly in price during the last year. Sometimes price falls are caused by general falls in the stock market - such as the falls seen in January and February 2016 - but are often due to some event such as a results announcement or trading update.
Have a look at a chart and note the approximate date of any steep share price rises or falls. You can then go and see if there was any news on those dates that may have caused them. For example, I would investigate the price falls in May and November 2015. I'll say more on the news function in SharePad shortly.
Financials
The next step is to click on the green Financials button on the main toolbar. The Financials view provides in-depth company and financial data across a number of different tabs.
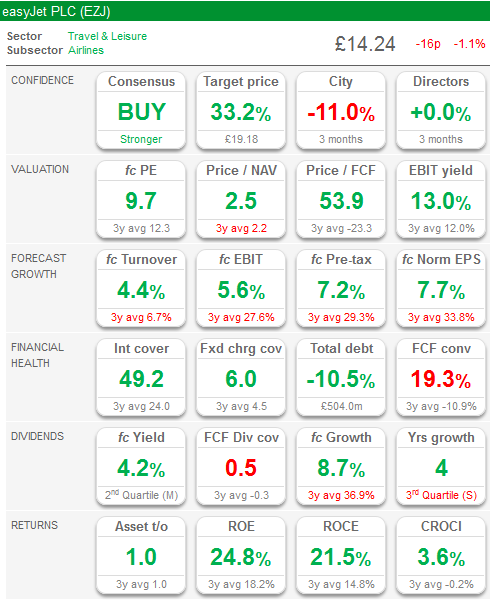
The Summary tab - or dashboard as we often refer to it - gives an overview of key metrics. Think of it as a traffic light colour-coded summary.
In very simple terms, the more green you see, the more attractive the company might be as an investment. A data item will be coloured green if it is favourable or improving or growing. For example, higher expected profits or falling levels of total debt as with easyJet above.
easjJet's dashboard is predominantly green which is a good sign.
City experts don't always get things right and you should not rely on their opinions but knowing what they currently think about a share can be quite useful in terms of weighing up sentiment. We can see that easyJet shares are viewed positively by analysts with most of them rating the shares a buy with an average target price 33.6% higher than the current share price.
The valuation section is green because on various measures of value the shares are trading below their 3 year averages. A forecast PE ratio of 9.7 times might be seen as attractive. A Price to free cash flow (P/FCF) multiple of 53.7 might be better than the three year average but is not usually seen as an indicator of a cheap share. It is telling you that easyJet's free cash flow per share is a lot lower than its earnings per share (EPS). Usually, the main reason for this is due to the company investing heavily in new assets i.e. the capital expenditure figure in the cash flow statement is much higher than the depreciation charge in the income statement.
The company's financial health is improving, dividends are expected to grow and financial returns are getting better. A forecast dividend yield of 4.2% looks quite attractive too.
Financial statements
The company's full financial statements can be found under the Income, Balance and Cash tabs.
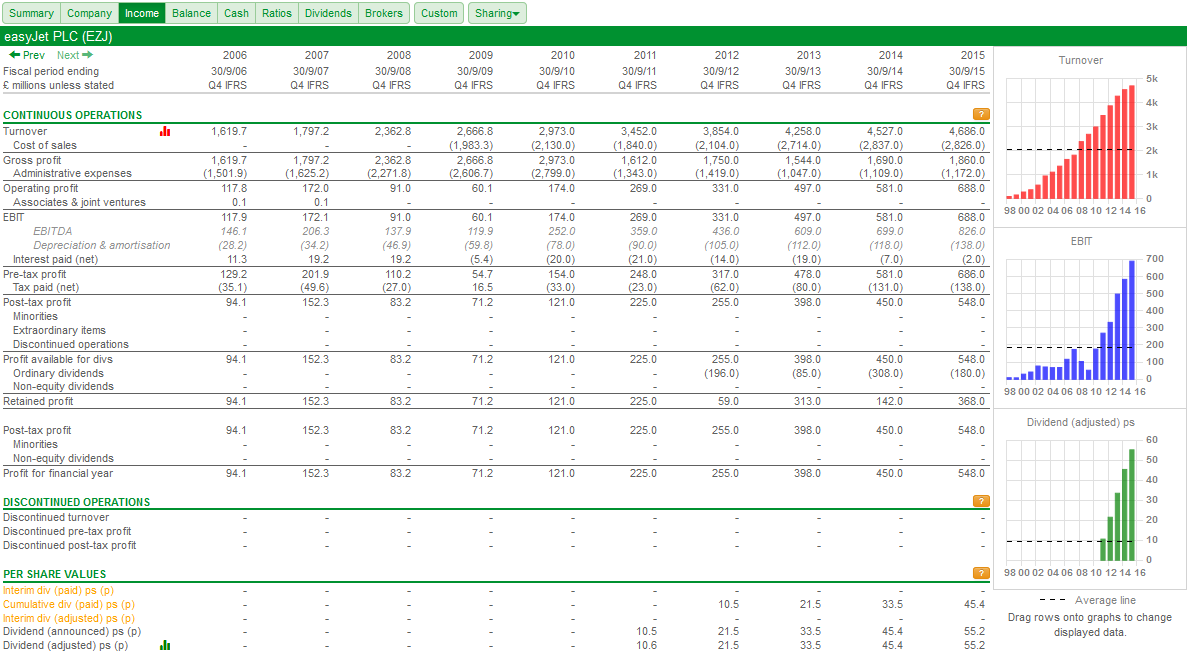
One of the most important aspects of SharePad is the amount of historical company financial data it contains. Where available, you can view twenty years or more of data. This can be extremely useful as it allows you to understand how a company has performed across good times and bad.
I often spend time looking at how companies fared before, during and after the recession of 2008-09 as well as points of stock market turbulence such as the bursting of the dot-com bubble in 2000 and the Iraq war in 2003 so that I can understand how they perform in different states of the world.
In my weekly articles, I frequently use the Financial charting tool in SharePad. If you don't use this feature, you can do something else very similar and very quick.
When you are looking at the financial statements or Ratios tabs in SharePad you can drag any item of data (e.g. Turnover) onto one of the charts on the right hand side of the view (these may be hidden on small screen sizes). With easyjet above, I can quickly see that the company has been successful at growing its turnover and operating profits (EBIT) in recent years which is always good to see.
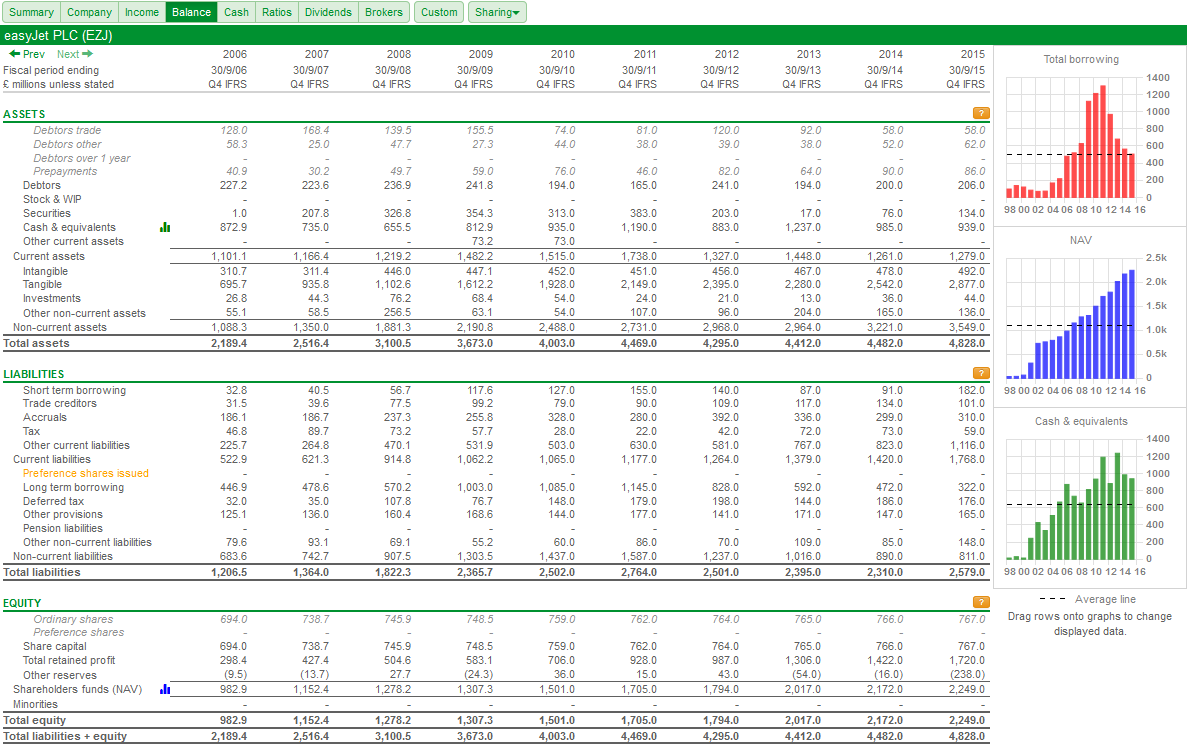
Turning to its balance sheet (below), I can see that total borrowing is coming down and the value of shareholders' equity is going up which is reassuring. Cash balances have come down a little which needs to be investigated further.
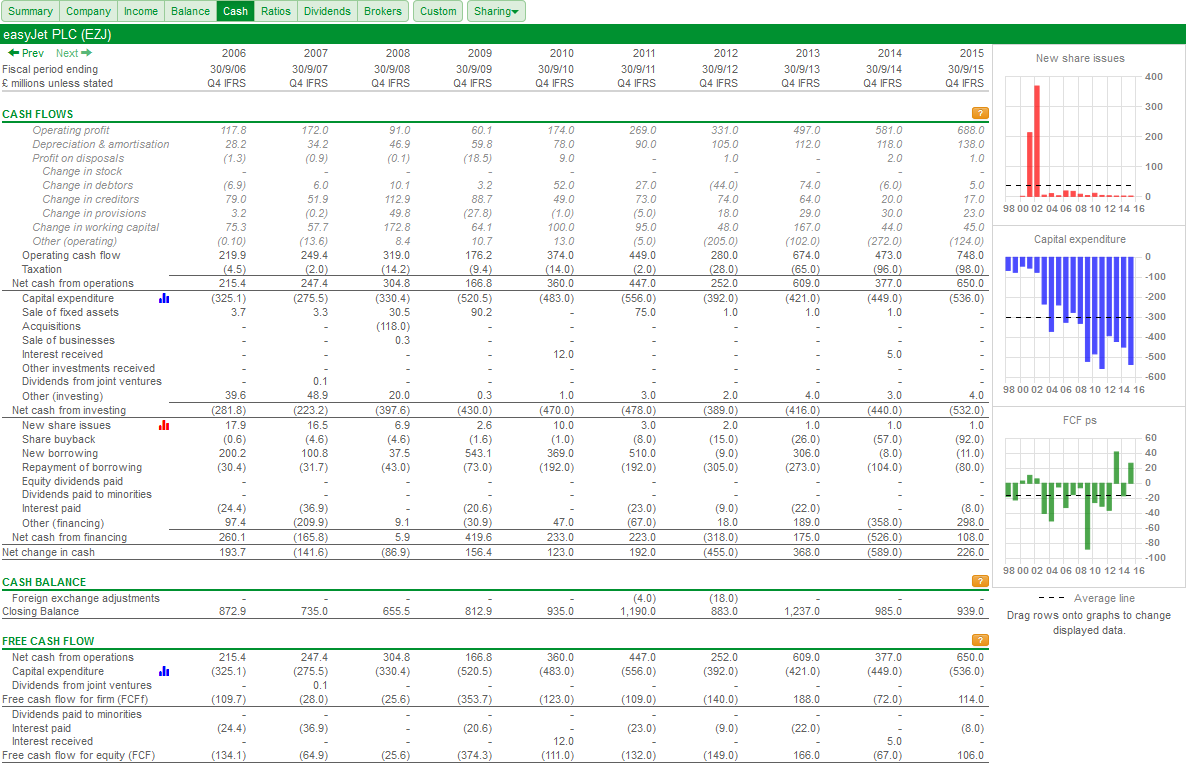
Moving on to the all-important cash flow statement, I can see that the trend in cash flow from operations looks reasonably healthy but that the company doesn't produce much free cash flow. In fact cash is flowing out more often than not. Could this be a major weakness which would lead me to avoid the shares?
The bottom right hand side chart in the screen shot below probably explains why. I've dragged Capital expenditure (investment in new assets) onto the chart and you can see that it has been very high in recent years. It is shown as a negative number because it is a cash outflow.
Ratios
SharePad has an extensive range of financial ratios which are very useful in helping to explain how profitable, how safe and how expensive the company and its shares might be.
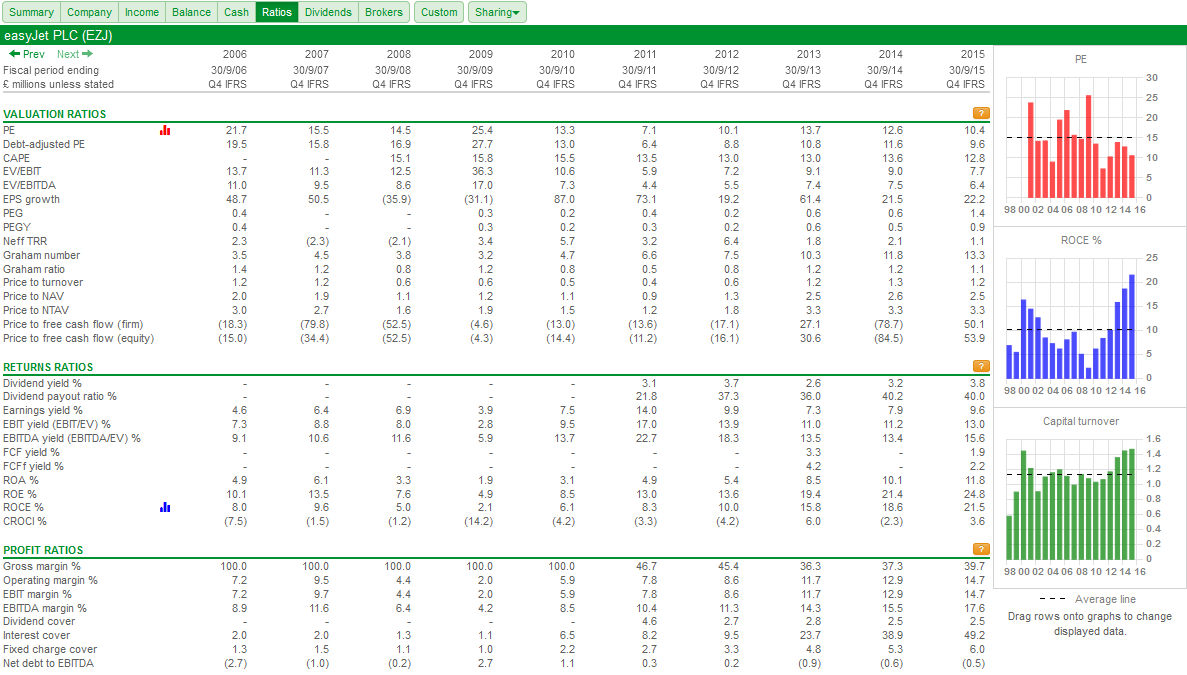
As with the financial statements above, you can drag ratios from the data to the charts on the right hand side of the screen. In this instance, I am looking at return on capital employed (ROCE), EBIT (profit) margins and fixed charge cover ratios.
ROCE tells the investor if a company is getting a decent bang for its buck by comparing its trading profits with the amount of money it has invested. It's like the rate of interest on a savings account, the higher it is the better. easyJet's ROCE has been on a rising trend as have its profit margins. However, the chart shows that these ratios are far from stable; they have hit peaks and troughs in the past. Both ROCE and profit margins are at historic highs. Are these signs that the company's performance has peaked?
Fixed charge cover is a very important ratio. It measures the ability of a company's trading profits to pay the interest on any borrowings as well as the rent bill on any leased assets such as aircraft. easyJet's fixed charge cover looks to be at a very healthy level and has been on a rising trend. Even if profits have peaked and fall for a while it would seem that the company has enough financial strength to stop shareholders' having sleepless nights.
Dividend history
Dividends can make up a sizeable chunk of the return investors get from owning a share. Companies that have paid a consistently rising dividend for a number of years are often good investments (if bought at the right price).
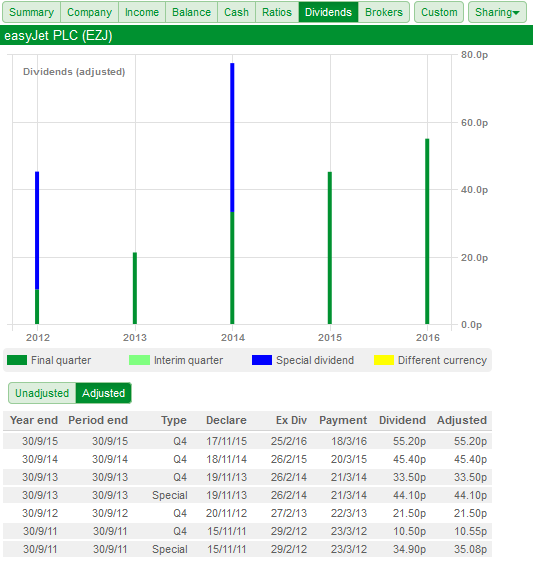
On the Dividends tab, SharePad gives you a detailed breakdown of a company's dividend history and includes any special or one-off dividends that have been paid as well. Special dividends can be a sign of a company that is good at generating lots of surplus cash flow and pay it out to shareholders. As you can see, easyJet only started paying dividends in 2011 but has been increasing the amount it has paid each year. It has also paid two special dividends since then which is encouraging. This is significant given its forecast dividend yield of 4.2%.
As with any dividend you should check if the company is producing enough cash flow to afford it and work out if this level of dividend is sustainable even if profits and cash flow fall.
Broker forecasts
I've already mentioned that broker forecasts should be taken with a pinch of salt. Human beings tend to be not very good at predicting the future and many forecasts are just some form of extrapolation of existing profit trends. City analysts are often very bad at predicting recessions or profit setbacks at companies.
It is much better to look at the financial data that is actually known and base your investment decisions on this. You can then and try and work out whether the outlook for future profits is broadly positive or negative.
That said, expectations of future profits are a key determinant of share prices and future dividend payments. It is therefore of some use to know how much money professional investors are expecting a company to make.
SharePad gives a list of stockbrokers and shows you their forecasts, stock recommendations, price targets and the date these were last revised. You can also chart forecast items such as dividends per share or EBITDA where data is available.
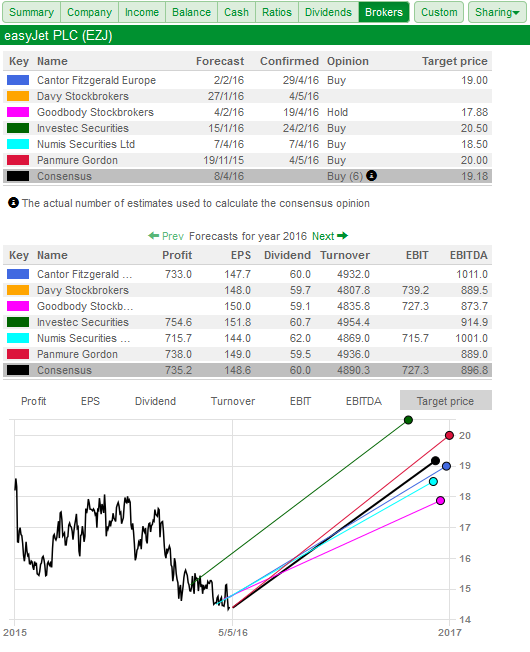
Here I can see that most of the broker forecasts and recommendations have been updated fairly recently in April (I am writing this in early May 2016) which tells me that price targets and broker sentiment is reasonably up to date. In the chart, I have displayed the expected trend in dividends per share which is showing what looks to be a decent rate of growth.
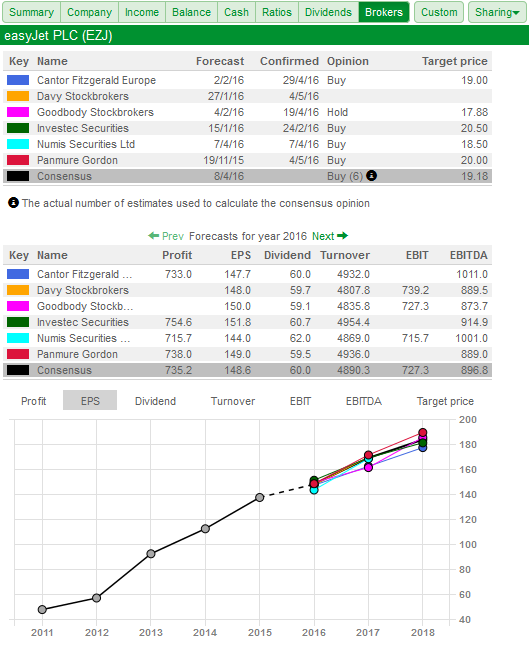
If I look at the expected trend in earnings per share (EPS) then this is expected to keep on growing too. If these analysts forecasts are realised then easyJet might be an interesting investment opportunity given its current low PE ratio and reasonably high dividend yield.
News
This is one of my favourite features in SharePad. As well as having lots of historical financial data SharePad also has a very comprehensive archive of company news - not to mention a live news feed - which is absolutely vital for investment research and portfolio management. SharePad includes regulatory (RNS) announcements as well as market and share-related commentary from Dow Jones Newswires. You can access this by clicking on the green News button on SharePad's main toolbar.
The news history tends to go back ten years. With easyJet I can go back to January 2006. This is very useful because it means I can read all the company's financial results without leaving SharePad - saving me the time and effort of downloading them from the company's website.
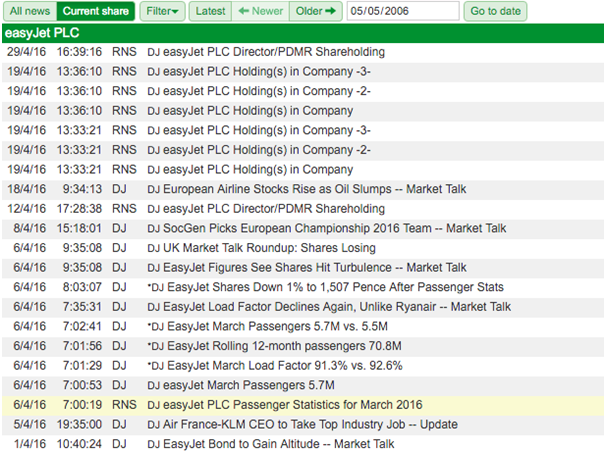
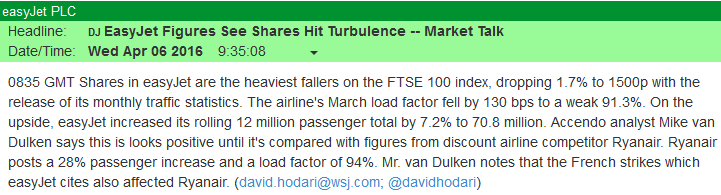
I tend to place more emphasis of RNS items such as company results and trading statements but the Dow Jones news can be very useful in telling you about what analysts think of the results and can give you a bit of extra information. Here we can see that easyJet released its passenger statistics for March 2016 on 6th April.
SharePad Pro users get a news feature called trader headlines - one line articles which summarise the key points of an RNS statement. You can see in the screenshot above that four of these stories have been released in the two minutes after the RNS statement. The headlines are that passenger numbers are growing but easyJet's planes are carrying fewer passengers per flight as measured by its load factor. The load factor has been falling in recent months and is down to 91.3% from 92.6%.
If we open up a couple of the news items we can see what's been going on.
Below is the official stock exchange (RNS) announcement from easyJet showing its passenger numbers. They are just over 4% higher than in March 2015 but the load factor was 1.3% lower. For the year to March, passenger numbers were 7.2% higher and the load factor was slightly up.
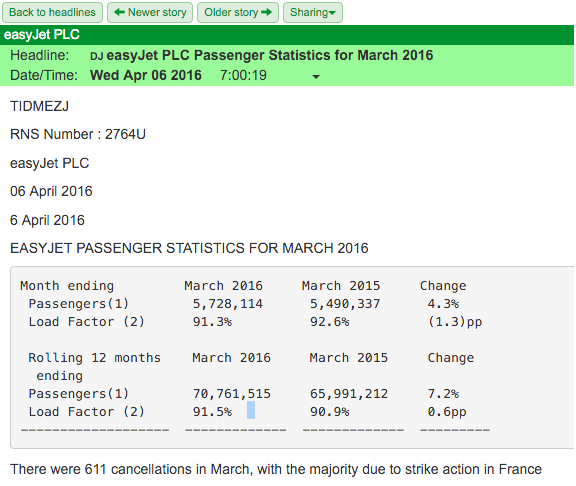
The key takeaway here is that passenger growth is slowing and load factors are falling. That said, we also know there was a strike in France in March which will have had a negative effect. Unless the strike continues this effect will not be a factor going forward.
However, it seems that some analysts are concerned that easyJet is not performing as well as its main rival Ryanair. This may explain the weak recent performance of easyJet shares.
Postscript: Passenger numbers for April should be out now. You can do your analysis on them.
Directors' shareholdings
If you are thinking of buying the shares of a company it's a good idea to check if top management (namely the chief executive, finance director and chairman) own a significant amount of shares as well. You want them to have a meaningful amount of money invested as they are likely to act in your best interests if they have a significant amount of money at stake too. You can quickly see if this is the case in SharePad by clicking on the green DD (Directors dealings) button on SharePad's main toolbar.
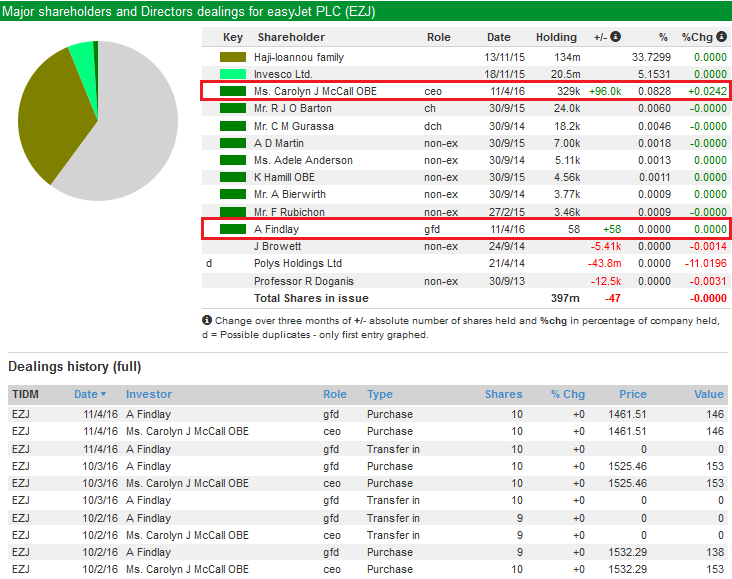
Here I can see that the chief executive, Carolyn McCall owns 329,000 shares and has been adding to her stake. At a share price of £14.37 this equates to £4.7m which should be enough money to make sure she runs the company for the benefit of other shareholders as well. That said, if I study the dealing history in more detail below I can see that her stake has been built up by exercising options (presumably at a discount to the prevailing share price) rather than buying shares on the stock exchange with her own cash which is a more favourable sign.
We can also see that the finance director only owns 58 shares. He only joined the company in October 2015 but ideally you would like to see him owning a lot more shares in the company.
Other things you can learn from this section in SharePad is the presence of large shareholders. Here we can see that the Haji-Ioannou family own just over a third of the company which gives it significant influence over how it is run. This can be a good and bad thing but something to look into further.
What you have learned
You can go through this process in SharePad in just a few minutes. Hopefully you can see that it is possible to learn a lot about a company in a very short time. Here's what we have learned about easyJet:
- The share price has fallen significantly during the last year.
- The valuation of the shares is now quite low with a forecast PE ratio below 10 and a dividend yield of more than 4%.
- City analysts are buyers and think the shares are cheap.
- Sales, profits, ROCE and dividends have been steadily improving in recent years.
- ROCE and margins have not been stable over the last decade and have moved up and down a lot. They are currently at all time highs.
- Free cash flow has been poor due to heavy investment in new assets.
- Borrowings have been coming down and fixed charge cover is very healthy.
- Analysts expect profits and dividends to keep on rising.
- Passenger growth slowed in March and load factors have fallen.
- easyJet might not be performing as well as Ryanair.
- easyJet has a large family shareholder.
- The chief executive has a significant amount of money invested in the company but has built her stake mainly with share options rather than outright purchases.
For some investors this is probably enough information to make an investment decision. Next week, I'll take the SharePad analysis of easyJet to another level and show you how to get an even better insight into the company.
If you have found this article of interest, please feel free to share it with your friends and colleagues:
We welcome suggestions for future articles - please email me at analysis@sharescope.co.uk. You can also follow me on Twitter @PhilJOakley. If you'd like to know when a new article or chapter for the Step-by-Step Guide is published, send us your email address using the form at the top of the page. You don't need to be a subscriber.
This article is for educational purposes only. It is not a recommendation to buy or sell shares or other investments. Do your own research before buying or selling any investment or seek professional financial advice.

