Stock Watch: Procter & Gamble (P&G)
The US is the home to some of the world's best businesses. If you are looking to broaden your horizons then adding some US shares to your portfolio might be something you want to think about.
The good news for SharePad and ShareScope subscribers is that data on nearly 5000 US shares is included in your subscription for no extra cost. It is possible to do the same kind of in-depth analysis on US shares as it is for UK ones.
In this article I am going to be using SharePad to look at one of the most popular shares on the US stock exchange, consumer goods giant Procter & Gamble (or P&G).
Before you jump in though, bear in mind that investing in foreign shares does come with some extra risk that you need to be aware of. As well as the risks of losing money from investing in bad companies, and the volatility that comes with the general ups and downs of share prices, there is foreign currency risk as well.
Changes in the value of currencies can mean that the changes to the value of your foreign investment in pounds sterling will usually be different to what happens to its local value. For example, let's say that £1 buys $1.50 and you own a US share with a share price of $1.50. The value of your investment is £1. During the year the share price goes up to $1.60 but the value of the pound increases as well and buys $1.60. Even though the share price has gone up by 6.7% in dollar terms you haven't made any money - it is still valued at £1 - because of the change in the exchange rate.
Sometimes the change in the exchange rate can work for you. Had the value of the pound fallen so that it only bought $1.40, the value of your investment would have been £1.14 ($1.60 divided by $1.40) giving you an extra gain on top of the local price change.
Another thing to be aware of is that dividends on foreign shares are taxed differently to UK shares. In the UK dividend income up to £5,000 is tax free and isn't taxed at all in ISAs and SIPPs. In other countries taxes on dividends are often much higher. By filling in a form (or forms if you are buying shares from more than one foreign country) with your stockbroker before you buy any shares it is possible to reduce the amount of tax you pay. A typical rate for many countries is 15% which means that you will earn less from dividends from many foreign shares than you will from UK ones.
Want to learn how to analyse shares like a professional? Download our FREE guide.
Sign-up to our mailing list to receive a PDF of our Step-by-Step Guide to Investing.
Share this article with your friends and colleagues:
What does P&G do?
P&G owns some of the best known and successful consumer brands in the world including health and grooming products Gillette, Braun and Oral-B; beauty products such as Olay, Pantene and Head & Shoulders; and home care brands such as Ariel and Fairy.
These are the kind of products that are trusted by consumers and bought time and again. They can be found in the kitchen cupboards and bathrooms of millions of homes across the world. P&G has 21 brands with annual sales between $1-10 billion which make up a very profitable and successful company - the sort of company that many investors own or might want to own a slice of.
That said, shareholders in P&G have not had a lot to be happy about in recent years. The total return from owning the shares (the change in share price plus any dividends received) has significantly lagged the return from owning an S&P 500 tracker fund and the shares of other leading consumer goods companies.
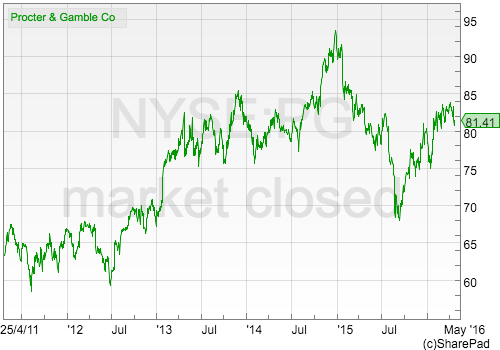
The company has been struggling and has been trying to sort itself out. It has sold off a lot of beauty brands as well as its pet food brands and Duracell battery business. It is now focusing on 65 key products.
Let's open up SharePad to take a closer look at what has been going on.
Turnover and profits history
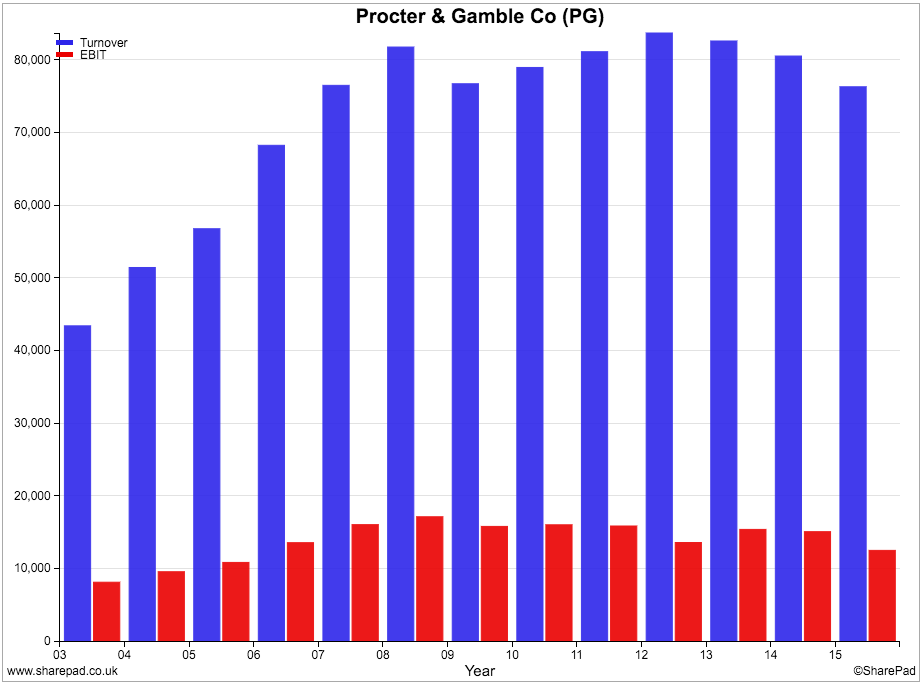
Turnover exceeded $80bn in 2009 but has struggled to grow since then. The strength of the US dollar in recent years had decreased the value of overseas sales by a significant amount. However, P&G has also struggled to sell more of its products. It has tried to get more money into its coffers by increasing its prices but often this has led to consumers buying fewer of its products.
P&G operates in a very competitive marketplace. Whilst there may be a large amount of customer loyalty to its brands it is possible to switch to rival products which can be a lot cheaper at times due to lots of promotional pricing. Supermarkets have also been improving the quality and value of their own label products as well.
Profits (EBIT) have also struggled to grow. Bear in mind that US company accounts, unlike their UK counterparts, do not tend to show underlying profits (before one-off gains and expenses). This means that large one-off gains and expenses can cause big shifts in profits from year to year. It can be quite tricky to work out what is going on without digging a little deeper. For example, in 2015 there was a $2bn non-cash expense for deconsolidating the Venezuelan business from the rest of P&G.
Regular readers of my articles will know that I believe in looking at a company's cash flow to get closer to the truth about its financial performance. This is even more relevant when you are looking at US companies.
Returns on money invested
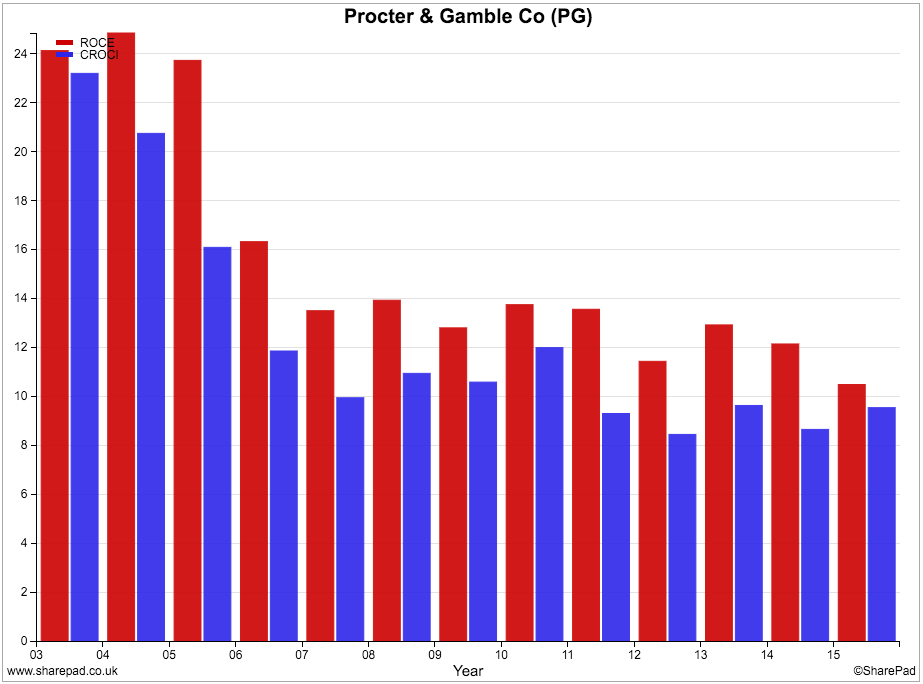
P&G's return on capital employed (ROCE) shown by the first or red bar in the chart above does not look too impressive. It was just 10.5% in 2015. Very good companies tend to have ROCEs of 20% or more year after year.
Free cash flow returns as measured by CROCI aren't that stunning either and are less than 10%. Back in the early 2000s, P&G had a ROCE of over 20% and CROCI of more than 15%. These are the kind of return numbers that I would expect from a company with lots of leading consumer brands.
So what's been going on?
If we dig down into ROCE a little further using DuPont analysis (to read more about this click here) we can shed a little bit more light on P&G's financial performance.
The red bars show that the company's profit margins have fallen but the biggest reason for the fall in ROCE has been the decline in capital turnover (the blue bars). P&G has been getting less turnover for each $1 it has invested. The ratio has fallen from over $1.20 per $1 in 2005 to just over $0.6 in 2015. That's a big fall.
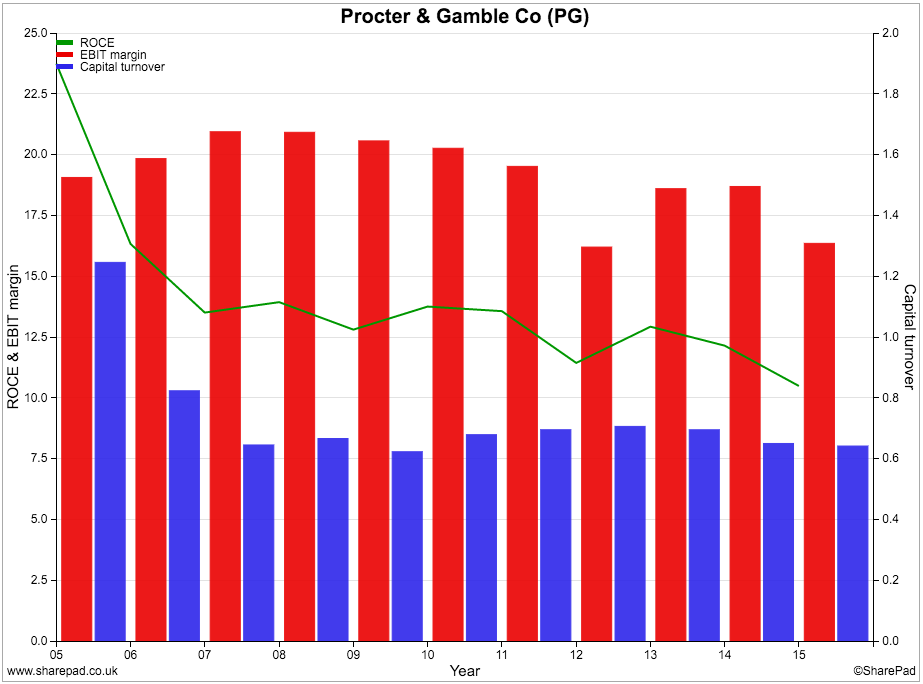
Because SharePad has lots of historic financial data it is possible to go back to try and find out why this has happened.
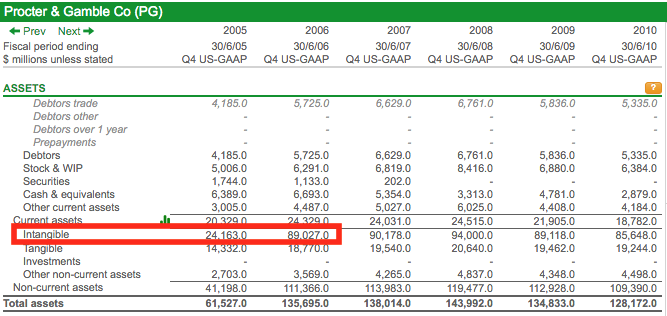
If you go back through P&G's balance sheet you can see that between 2005 and 2006 there was a big jump in the value of intangible assets from $24bn to $89bn. This is telling us that the company made a big purchase of a company during this period which included a lot of goodwill (the value paid for a company in excess of its net asset value) and or some big brands which are classified as intangible assets.
Type "P&G acquisition 2006" into an internet search and you quickly discover that P&G bought Gillette for $53.4bn in October 2005 and paid for it by issuing 962m new shares. Given the big fall in ROCE since then it might not be too unreasonable to argue that perhaps P&G paid a very a high price for Gillette, maybe too much. Excluding the value of intangible assets, SharePad calculates that P&G's ROCE would have been a very impressive 31.5% in 2015.
Free cash flow performance
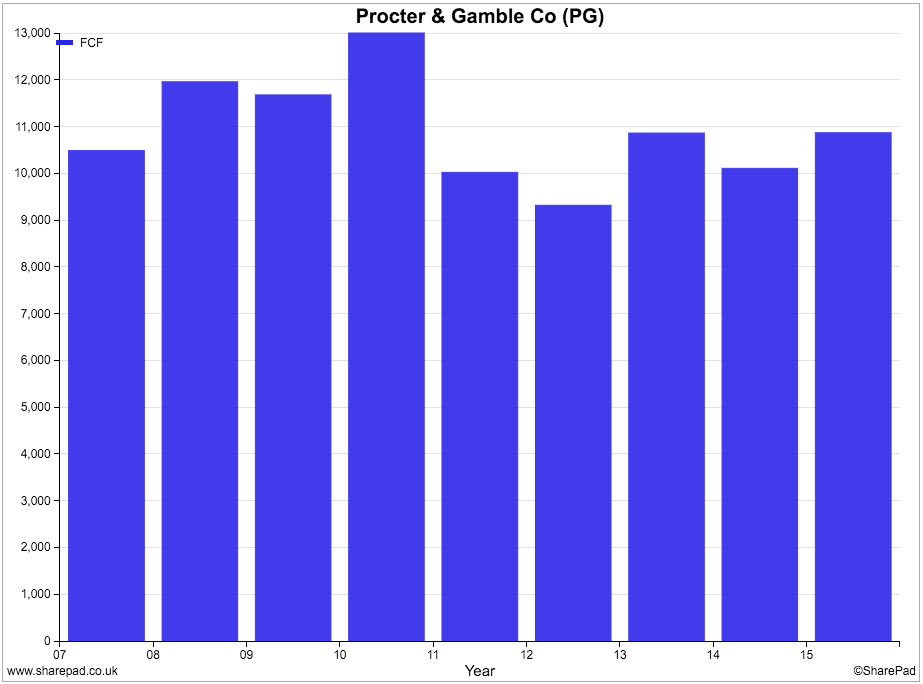
Even though ROCE and CROCI have been very modest, P&G does seem to consistently produce a reasonable amount of free cash flow. That said, free cash flow has been stable rather than growing in recent years.
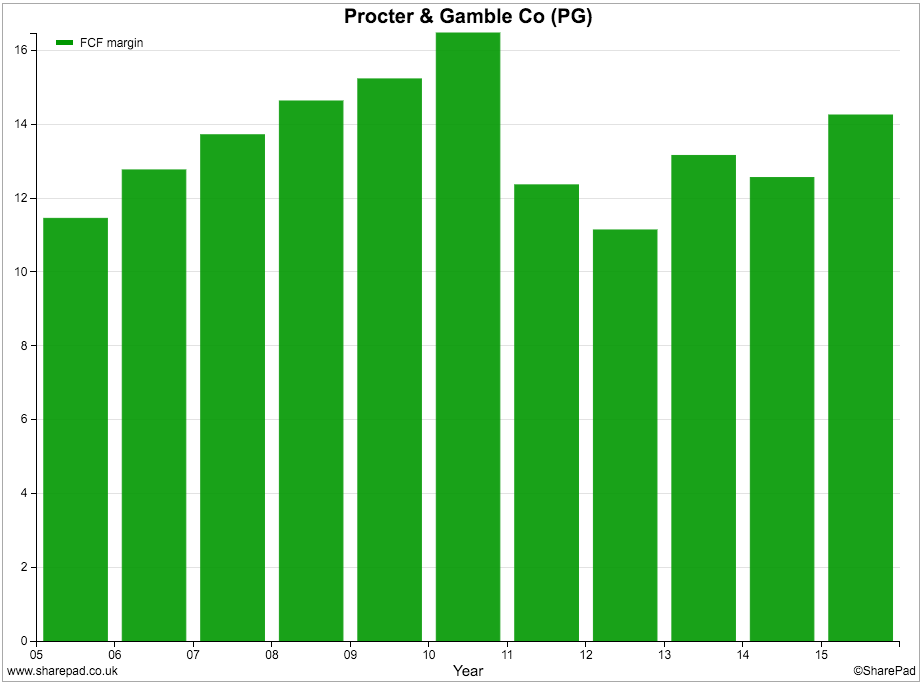
If we look at how much of its turnover it is turning into free cash flow - its free cash flow margin - we can see that after a period of growth following the Gillette acquisition in 2005 its performance has declined on this measure.
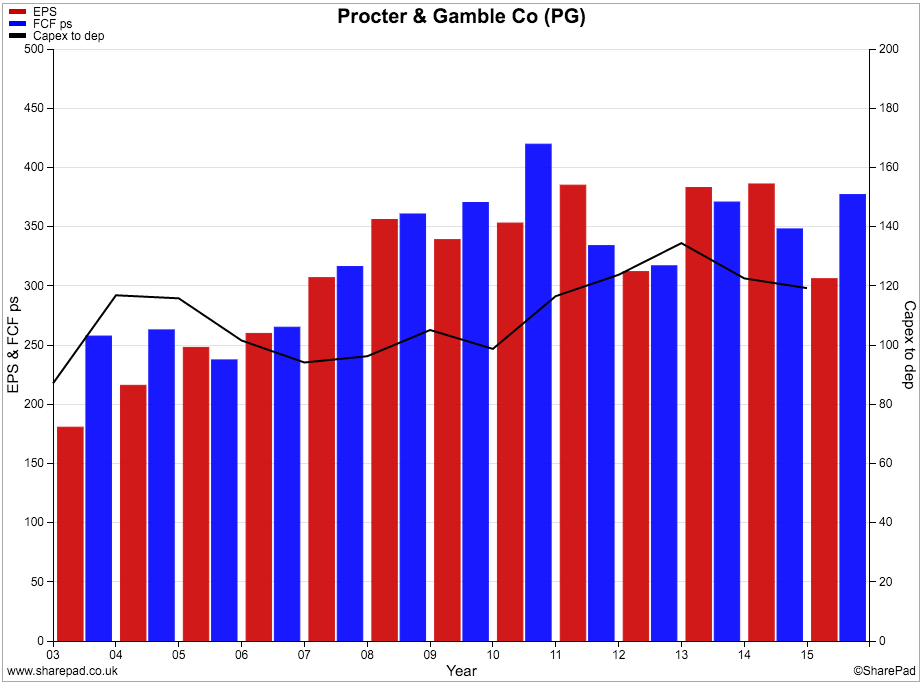
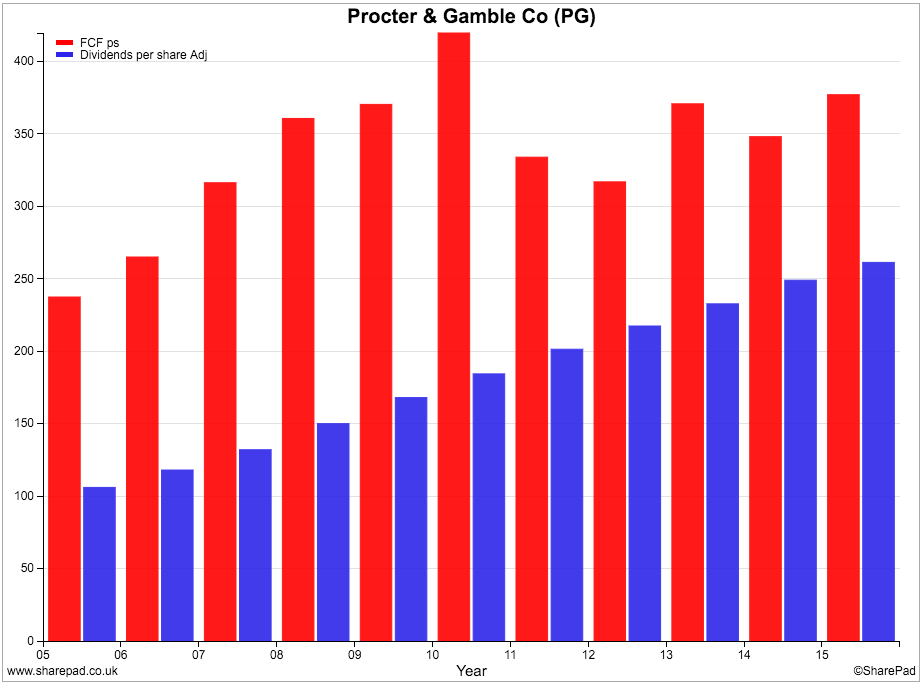
P&G looks to have a high quality of profits though. Its free cash flow per share has been close to and often higher than its earnings per share (EPS) as shown in the chart below. This is despite capex being higher than depreciation during the last five years.
P&G shares have been one of the most reliable dividend payers on the US stock exchange. The company has increased its dividend for 59 years in a row. As you can see from the chart below, the dividends have been comfortably paid from its free cash flow. The gap between free cash flow per share (the first or red bars) and the dividend per share (the second or blue bars) is quite big which suggests that as long as free cash flow levels can be maintained - and hopefully grow - there is scope for further dividend growth from the shares.
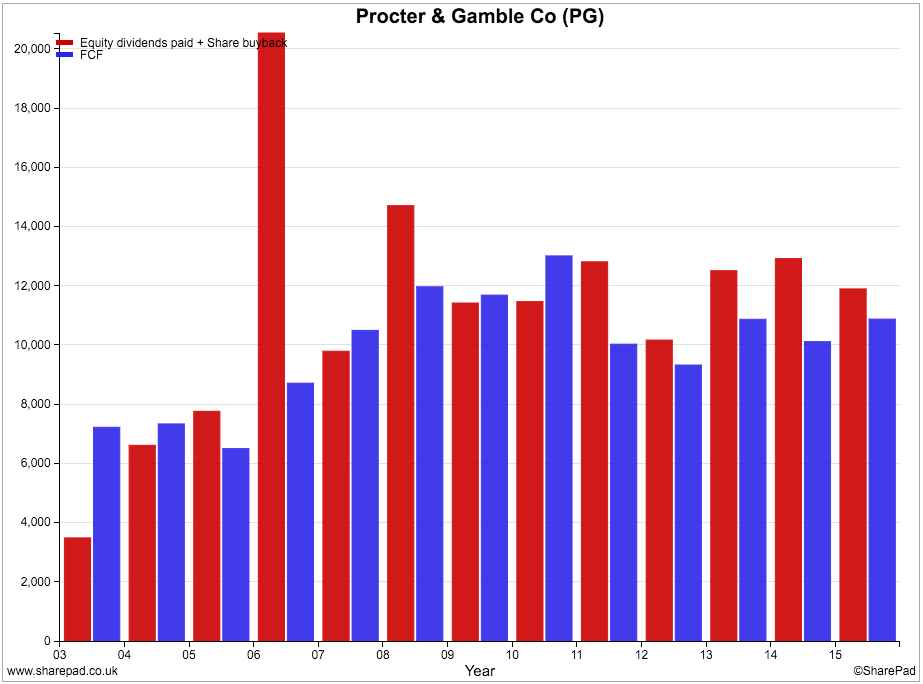
If we examine P&G's cash flow a little further, we can see that on top of the cash spent on paying dividends, large amounts of cash have been spent on share buybacks as well.
The chart below shows that P&G has been spending slightly more than its free cash flow on dividends and buybacks.
I'm not a fan of share buybacks. They are often a waste of shareholders' money because the company pays too much for them - more than the realistic value of the company. Another problem is that shares can be bought to offset new ones that are issued to employees as part of their bonuses. Companies do this to stop something known as the dilution of EPS caused by the number of shares in issue increasing. This looks to have been going on a lot at P&G.
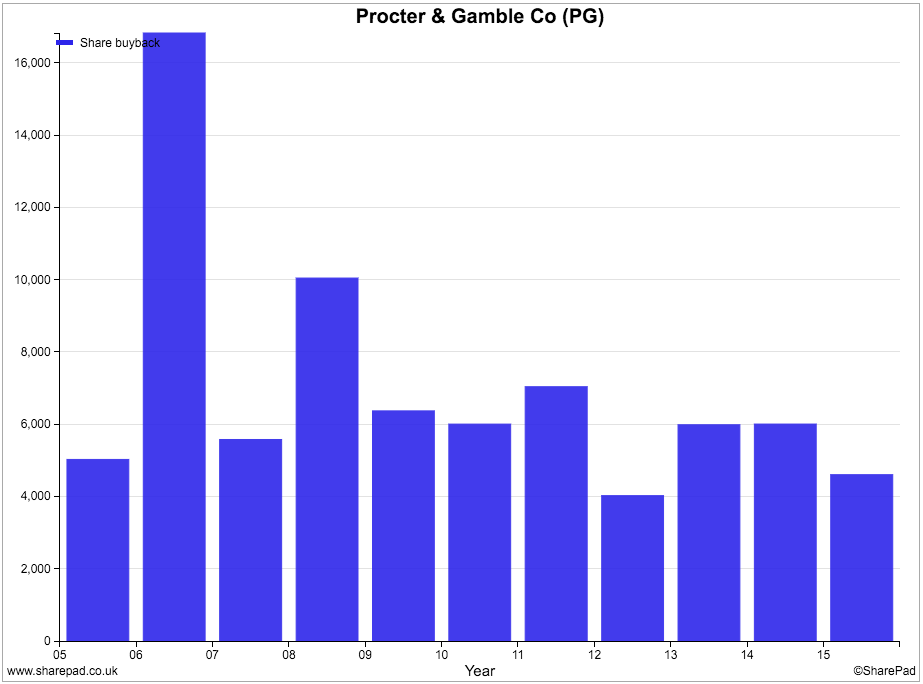
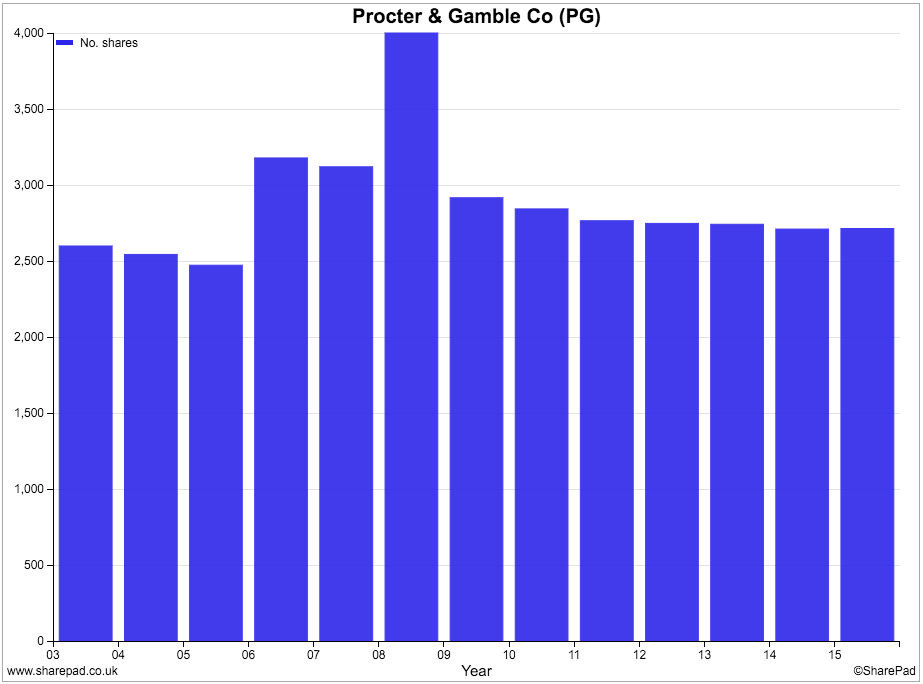
The chart above shows that billions of dollars have been spent on share buybacks in recent years. But the chart below shows that the number of shares in issue hasn't really fallen that much. Have shareholders really benefited from these buybacks? I'm not convinced that they have.
Financial position
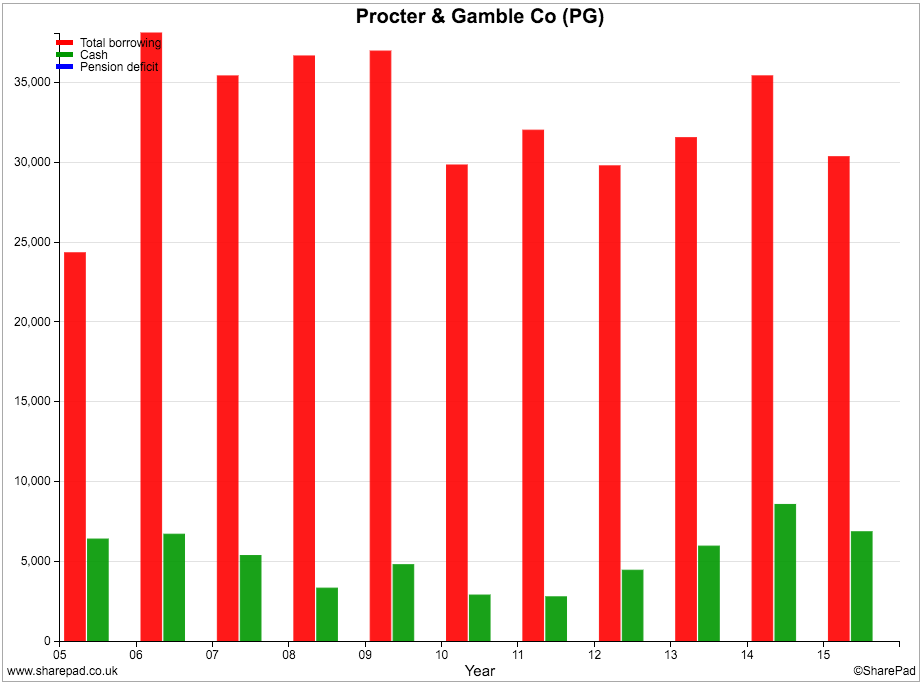
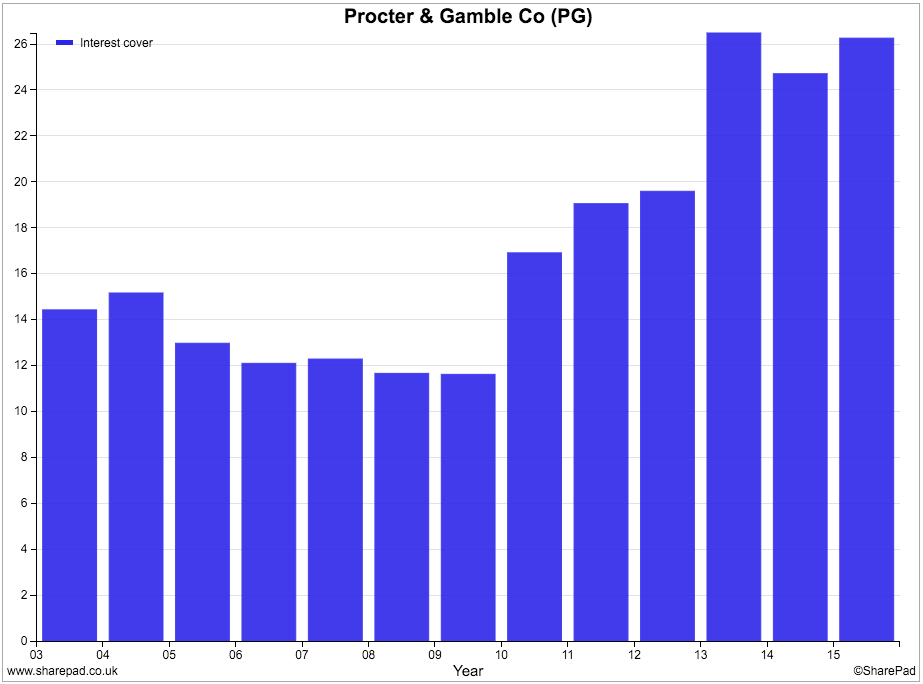
P&G's finances look to be healthy. Total borrowings have been coming down and interest cover is a very comfortable at over 26 times trading profits.
The company has a final salary pension scheme for its employees which is in deficit. The liability is not disclosed separately on the face of its balance sheet but was $5.3bn at the end of June 2013. For more on the significance of pension fund deficits to shareholders click here)
Valuation and future prospects
The shares of consumer goods companies are highly sought after by investors. They like the dependable and reasonably predictable earnings and cash flows that come from them. This means that the shares change hands for high multiples of profits and cash flows.
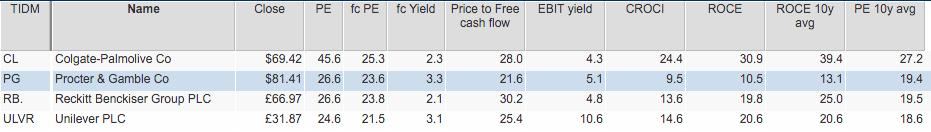
P&G shares currently trade on a forecast price to earnings ratio of 23.6 times. That is not cheap, although a forecast dividend yield of 3.3% given its free cash flow position looks more attractive. The company looks slightly cheaper on a price to free cash flow basis.
High valuations usually require reasonable rates of future profit and cash flow growth to justify them. Looking at P&G's current trading performance then this might be a problem.
Its results for the nine months to March 2016 showed that the company is still struggling to grow sales and profits. During the third quarter between January and March 2016, underlying sales growth was just 1% whilst underlying EPS fell by 3%. Even once the adverse effects of exchange rates were taken into account underlying EPS growth was zero. This does not make for encouraging reading.
There was some good news in that profit margins increased due to the company's cost savings projects but investors will probably be concerned that P&G is not selling more of its products in total. Its focus on fewer brands and product categories is clearly not paying off yet.
Higher advertising costs and a higher tax rate are also dragging down profits. With exchange rates still unhelpful the company reduced its underlying core EPS forecast for the year to June 2016 and said it would fall by 3-6% compared with the $3.76 achieved in 2015. Shareholders can still expect their dividend payout to rise modestly.
With a high valuation for its shares, P&G shares could be vulnerable to a significant price decline if profits don't start growing soon.
To sum up
- P&G has some very popular consumer brands which deliver steady and reasonably predictable profits.
- ROCE and CROCI are surprisingly modest.
- The main reason for this is the massive $53bn purchase of Gillette back in 2005 which significantly increased P&G's capital employed without a matching increase in profits and cash flows.
- Excluding intangible assets P&G's ROCE is an impressive 31.5% compared with an actual value of 10.5%.
- P&G is a good and consistent generator of free cash flow.
- Free cash flow margins are not as high as they used to be.
- Profit quality looks good with free cash flow per share close to or higher than EPS in most years.
- Free cash flow has allowed P&G to consistently grow its dividend payment and should help it to do so in the future.
- Large amounts of cash has been spent on share buybacks but they have largely offset new shares issued for employee bonuses. They seem to have been of little benefit to shareholders.
- P&G's finances are healthy.
- The company is struggling to grow its sales and profits. Volume growth from its products is low. Exchange rates are lowering the value of overseas sales and profits.
- The valuation of the shares is high on a forecast PE measure but similar to sector peers in the UK and US.
- The shares look more attractive on the basis of the forecast dividend yield and historic free cash flow.
- The shares might struggle to maintain a high valuation without future profits growth.
If you have found this article of interest, please feel free to share it with your friends and colleagues:
We welcome suggestions for future articles - please email me at analysis@sharescope.co.uk. You can also follow me on Twitter @PhilJOakley. If you'd like to know when a new article or chapter for the Step-by-Step Guide is published, send us your email address using the form at the top of the page. You don't need to be a subscriber.
This article is for educational purposes only. It is not a recommendation to buy or sell shares or other investments. Do your own research before buying or selling any investment or seek professional financial advice.

