Stock Watch: Carillion
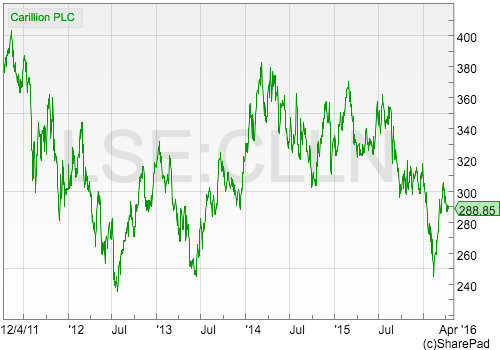
If you are trawling the stock market for shares with big dividend yields, there's a good chance that construction and support services company Carillion (LSE:CLLN) is going to appear on your list. As you can see from the share price chart above, its share price has been very volatile during the last five years. It has all the hallmarks of a share that investors quickly fall in and out of love with.
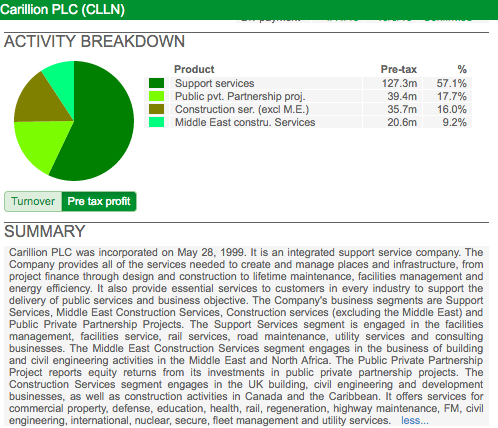
A closer look at what the company does goes a long way to explaining why this might be. Support Services - looking after buildings and services, maintaining roads, railways and energy networks - can be very good, steady business with lots of recurring income. On the flip side, the government tends to be the customer in lots of support services contracts in the UK which can turn the sector into something of a political football from time to time - especially if companies are seen to be making too much money.
Construction can be the exact opposite. New building projects are sensitive to changes in the economy which makes the workflow lumpy and difficult to predict. Contracts also tend to operate on wafer-thin profit margins at the best of times. A mistake on budgeting for building costs can blow a big hole in a company's profits. There is also considerable scope for aggressive accounting - particularly in terms of when profits are recognised. This makes them hard to understand which has led many investors to be wary of construction companies over the years.
Let's see how the company measures up after a thorough financial analysis in SharePad.
Want to learn how to analyse shares like a professional? Download our FREE guide.
Sign-up to our mailing list to receive a PDF of our Step-by-Step Guide to Investing.
Share this article with your friends and colleagues:
Turnover and profit history
The large blue bars show that Carillion's turnover has moved around a lot. It has been driven by the state of the economy - and the impact this has on construction revenues - and by buying other companies (more on this later). After taking a bit of a battering after the recession of 2008-09 it has been recovering in recent years.
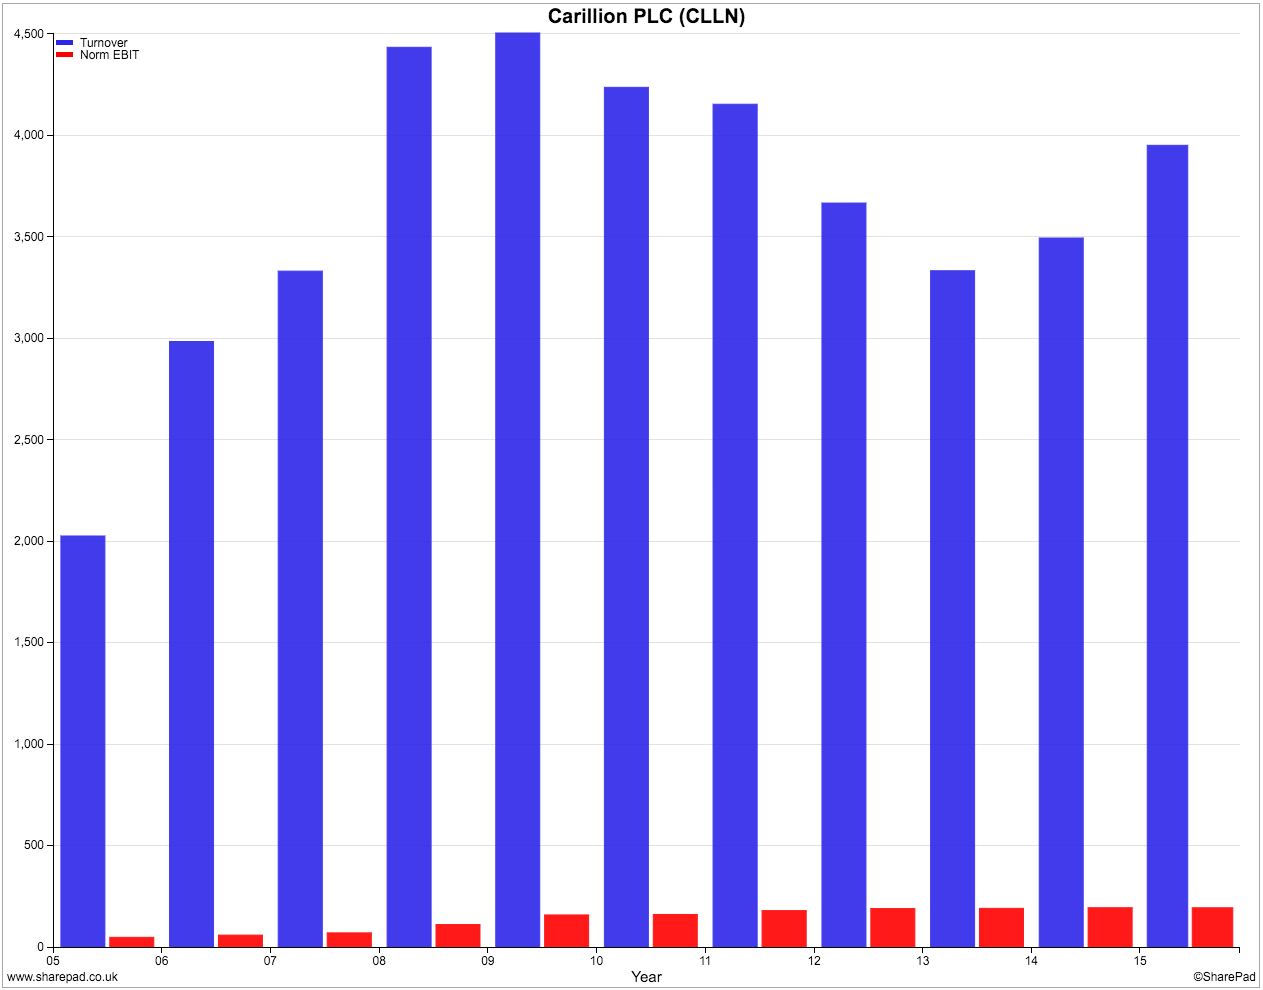
Trading profits (the red bars) are very small in comparison to turnover which is telling us that Carillion is a low profit margin business. Profit growth looks as if it has been hard to come by.
Returns on investment
Carillion's return on capital employed (ROCE) as shown by the blue or second bars below is not particularly impressive. ROCE has struggled to exceed 10% for much of the last decade. As a rough rule of thumb, a ROCE of 15% or more tends to be a reliable indicator of a good business. In 2015, Carillion's ROCE was 8.9% which was slightly lower than its ten year average ROCE of 9%.
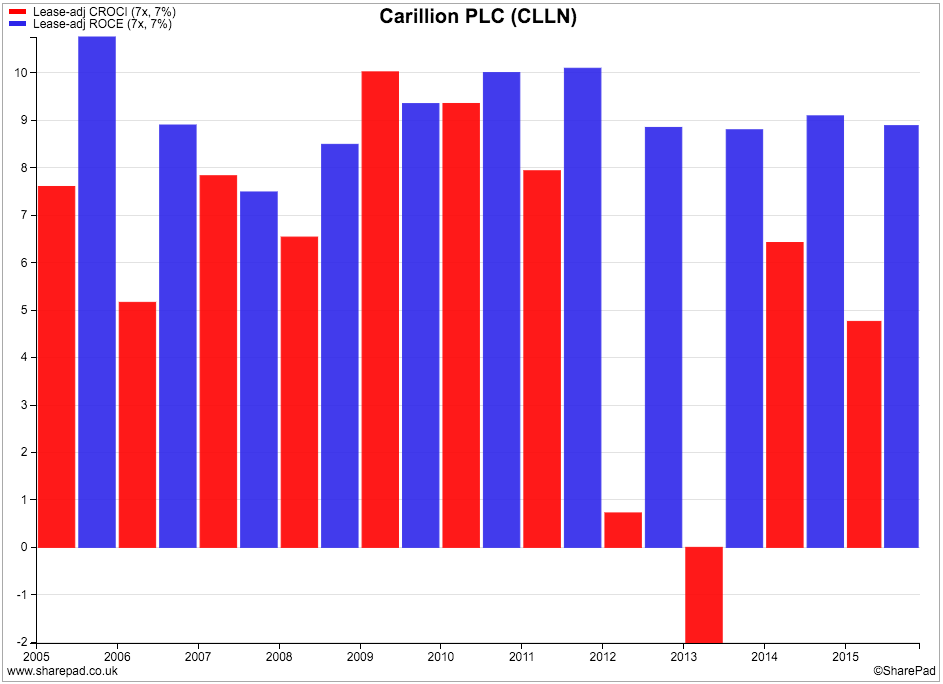
Free cash flow returns on money invested as measured by the cash return on capital invested (CROCI) has also been quite disappointing. Carillion's CROCI was 4.8% in 2015 and has averaged 5.7% for the last ten years. Very good businesses can consistently produce CROCI numbers of more than 10%.
We can take a closer look at how Carillion achieves its ROCE in the chart below which shows a DuPont analysis (read more about this here). We already know that its profit margins are low (the first or red bars) and can see that they have fallen slightly during the last three years. Capital turnover (sales per £1 of capital invested) has also fallen sharply in recent years. This can be explained by the company reducing the size of its construction business after the last recession.
The mix between profit margins and capital turnover over the last decade has seen ROCE move in an approximate range of between 8% and 10%. This shows that returns have been reasonably stable, albeit at quite a modest level.

Free cash flow performance
The chart below shows how effective Carillion has been in producing surplus or free cash flow. Its record is a bit patchy as free cash flow has been quite volatile and even negative in some years.
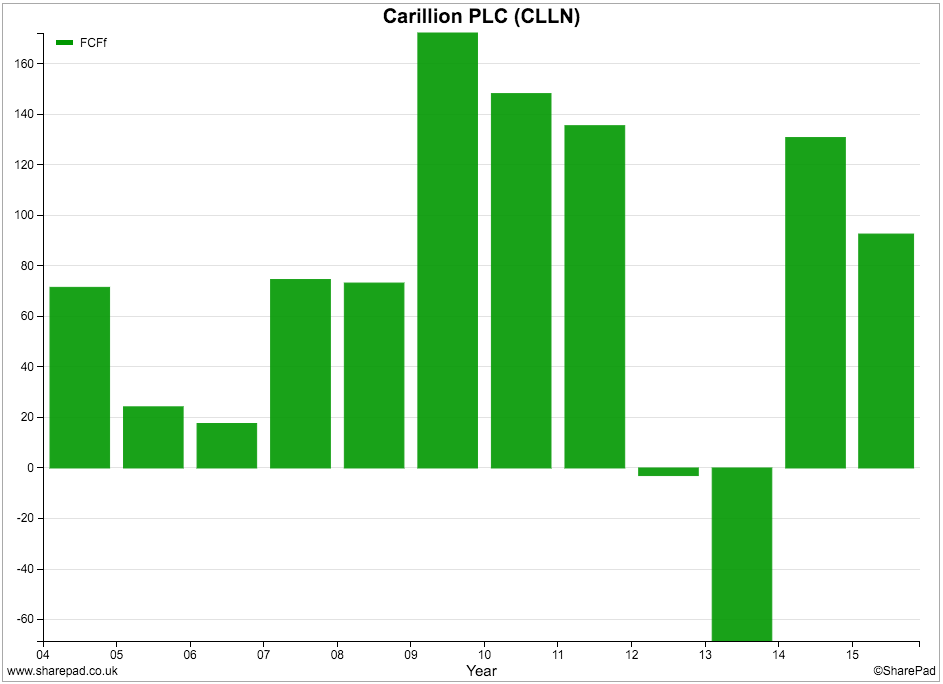
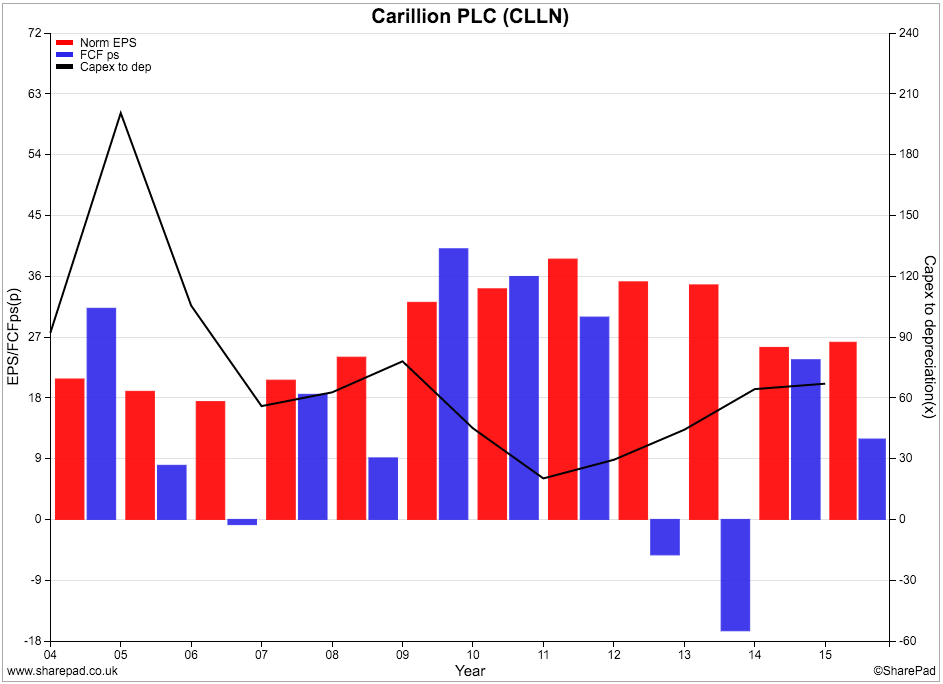
Despite consistently spending less money on new assets (capex) than its annual depreciation charge, Carillon's free cash flow per share has consistently lagged its earnings per share (EPS). This is not usually a good sign.
Note: Depreciation is a charge for the reduction in value of fixed assets and is deducted from profits - but is not a flow of cash out of the company. How much is actually spent on new or replacement assets is given by the capital expenditure figure in the cash flow statement. Depreciation is added back to profits when calculating cash flow so when capex is lower than the depreciation charge, this benefits a company's free cash flow position.
Free cash flow for shareholders (equity) was £144.1m in 2010 but was only £56.5m in 2015. If we take a closer look at Carillion's cash flow statement we can see why this has been happening.
Firstly, the company's net cash from operations was £128.6m in 2010 but only £106.2m in 2015.
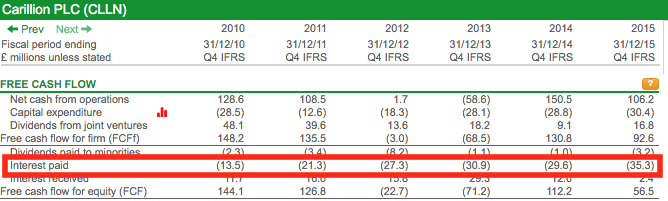
Then you can see that the company's free cash flow has taken a big hit from the fall in dividends from joint ventures. £48m was coming in from this source in 2010, just £16.8m was received in 2015.
To make matters worse, the company's cash interest bill has increased significantly from £13.5m to £35.3m over the same period. In all, from these two items, Carillion's free cash flow has taken a £50m hit in five years.
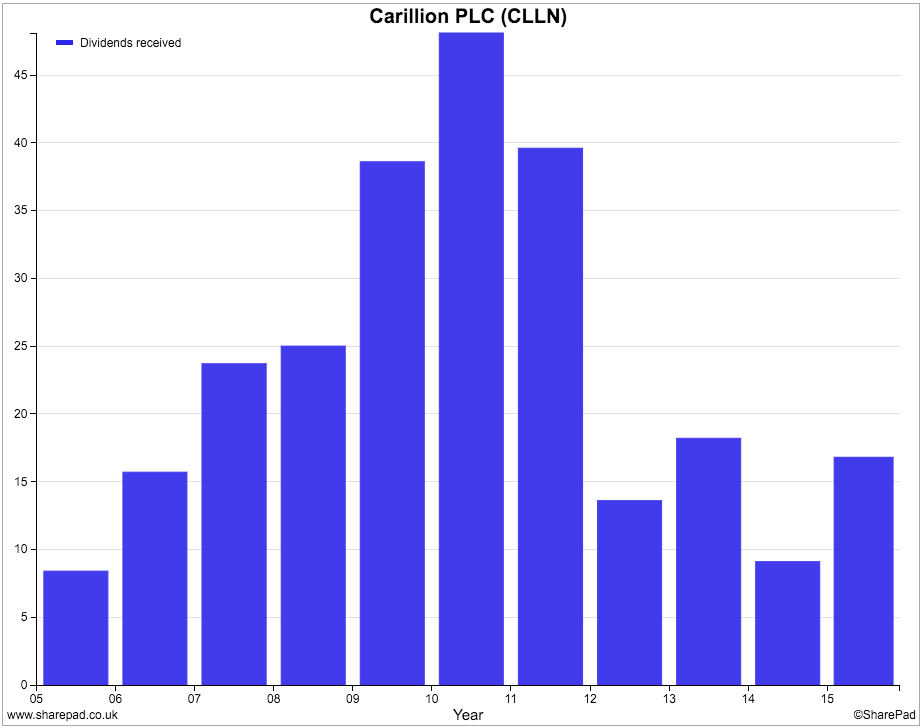
This is slightly concerning and might give rise to some concerns about the sustainability of the company's dividend payout. The chart below shows that dividends have been increasing.

However, they have not been consistently covered by free cash flow as the next chart highlights. The blue (dark) bars show the dividend per share whilst the red (lighter) bars show free cash flow per share.
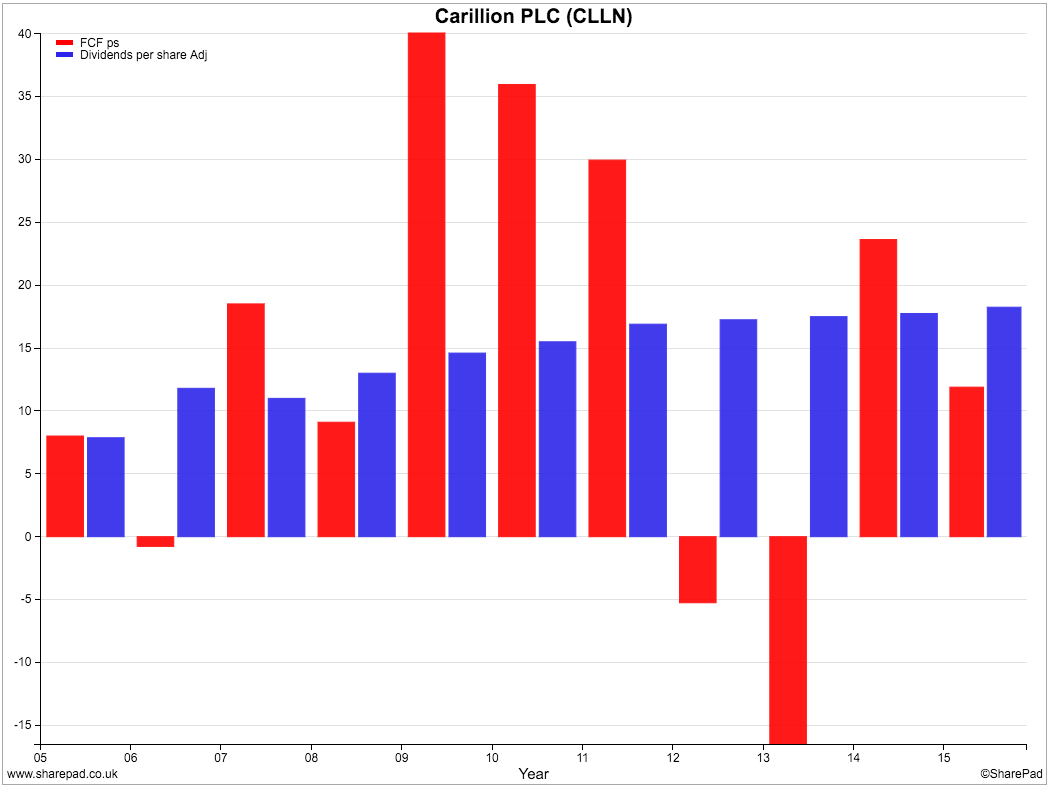
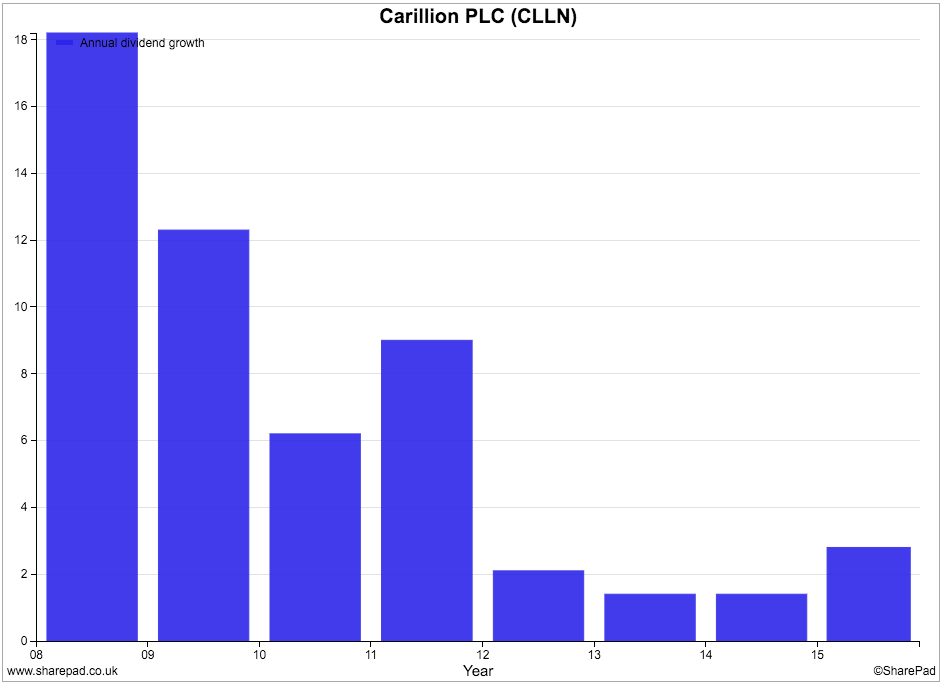
Dividend growth has also slowed dramatically from the rates seen not so long ago. Growth was 3% in 2015.
Is Carillion funding its dividend from disposal proceeds?
Have a look at the table below. It shows the cumulative free cash flow and cash dividends costs for Carillion since 2010. I'm a big fan of cumulative analysis, especially with cash flow as it allows you to spot trends that you might miss by comparing one year's figures with another's.
| Year | Free cash flow | Cash dividends | Gap | Disposals | Gap after disposals |
|---|---|---|---|---|---|
| 2010 | 144.1 | 61.4 | 82.7 | 45.8 | 128.5 |
| 2011 | 126.8 | 68 | 58.8 | 31.4 | 90.2 |
| 2012 | -22.7 | 78.6 | -101.3 | 0 | -101.3 |
| 2013 | -71.2 | 75.7 | -146.9 | 143.7 | -3.2 |
| 2014 | 112.2 | 76.7 | 35.5 | 36 | 71.5 |
| 2015 | 56.5 | 80 | -23.5 | 54.1 | 30.6 |
| Cumulative | 345.7 | 440.4 | -94.7 | 311 | 216.3 |
What we can see here is that Carillion has paid out £94.7m more in dividends to shareholders than it has generated in free cash flow. This is despite having a cash flow boost of capex being less than depreciation.
In 2010, 2011 and 2014, free cash flow has been sufficient to cover the cash cost of dividends. In other years there has been a shortfall. However, help has been at hand as Carillion has been able to sell its equity stakes in PPPs (Public Private Partnership projects) which has brought in £311m of cash to help pay a rising dividend.
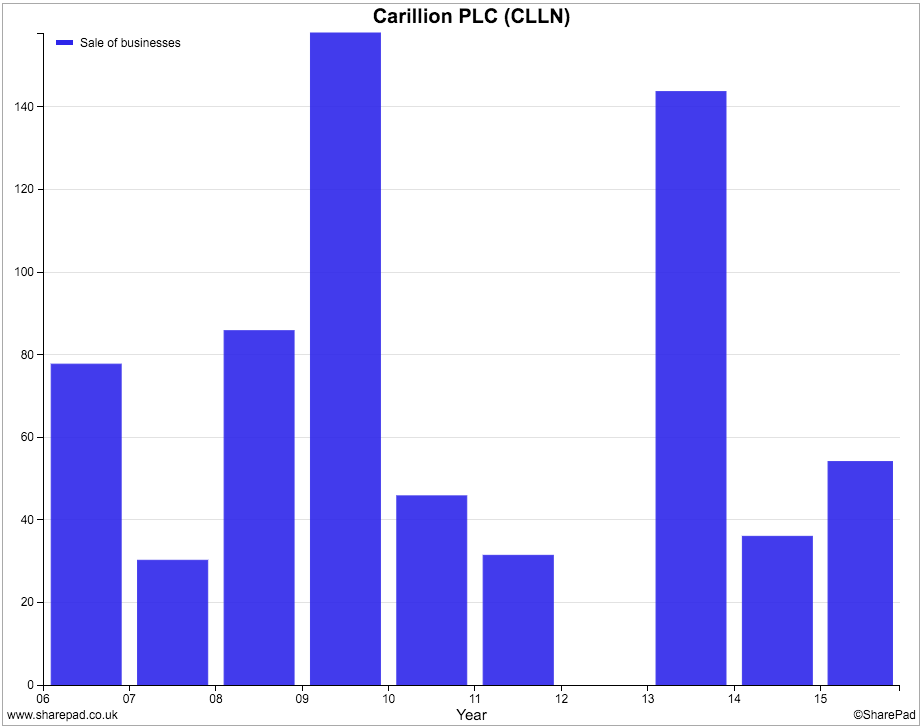
But what happens when there's nothing left to sell? The directors estimate that the remaining PPP equity has a value of £48m. Without an improvement in free cash flow, Carillion's current dividend payment could come under pressure.
Has Carillion been too reliant on buying companies in the past?
When studying Carillion's cash flow statement one thing that you can't help noticing is that it regularly spends money buying other companies (acquisitions). In some years lots of money has been shelled out.
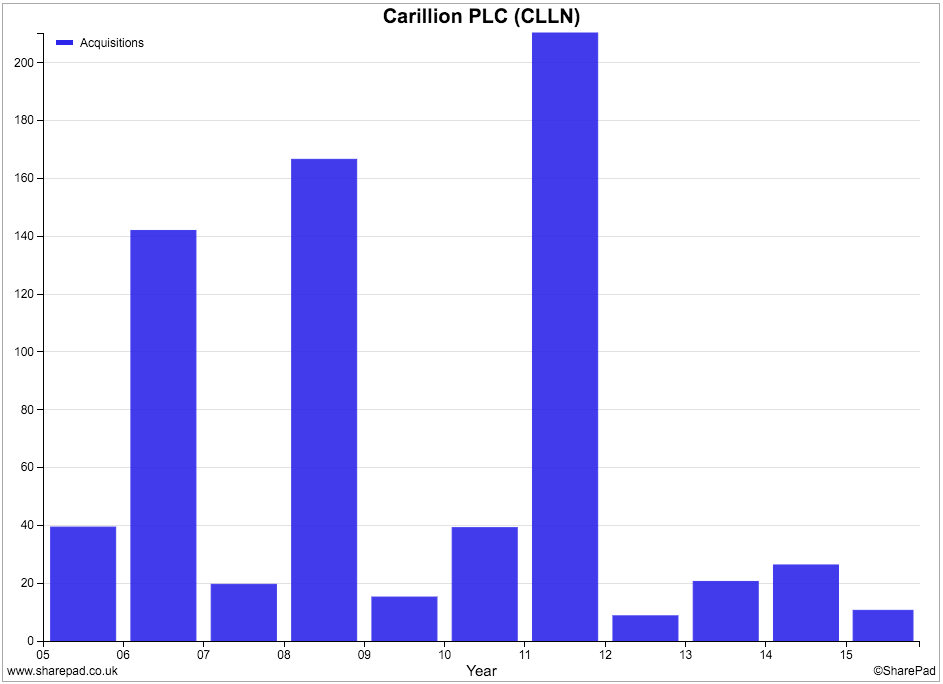
It has spent heavily on three big acquisitions as shown in the table below.
| Year | Company | Cost | Cash paid | New shares | Other |
|---|---|---|---|---|---|
| 2006 | Mowlem | 350.3 | 117.3 | 224.5 | 8.5 |
| 2008 | A McAlpine | 554.5 | 171.7 | 381.5 | 1.3 |
| 2011 | Eaga | 298.4 | 180.7 | 117.5 | 0.2 |
| Cumulative | 1203.2 | 469.7 | 723.5 | 10 |
£1.2bn was spent on these businesses which is about the same amount as Carillion's current market capitalisation. These businesses also allowed the company to make significant cost savings by integrating them into existing company structures and contributed to significant growth in profits and dividends at the time.
What is interesting is that, in all three cases, when the cost-saving projects came to an end after a couple of years, Carillion then made - or tried to make - another acquisition. This process came unstuck in 2014 when Carillion failed to merge with Balfour Beatty.
You can be forgiven for thinking that the company might have become too reliant on buying other companies - and the cost savings that come with it - to grow. Is it a coincidence that since 2013 the company's profits growth and share price performance have not been too stellar? Is this also the reason why Carillion's ROCE has tailed off recently?
As an investor you should always be wary of companies that have a habit of making big acquisitions as they often come a cropper eventually. The problem is often a case of acquisitions and their cost savings masking low underlying growth elsewhere. To keep the company's profits growing it has to keep buying companies and to make a big difference, each acquisition has to be bigger than the previous one.
Financial position
Carillion has a significant amount of borrowings (the first or red bar) totalling £632m at the end of 2015. The level of borrowings has come down from a peak in 2012. It also has sizeable cash balances of £462m giving net borrowings of £170m at the end of 2015.

You need to be very careful when assessing the borrowings and net borrowing levels of construction companies. That's because the cash flows associated with construction contracts are moving around all the time. For example, some customers may pay cash in advance before any work is done. This will show up as cash on the balance sheet and will reduce the year-end net borrowing/net cash levels.
A company's year-end balance sheets tend to show its financial position at its most favourable. As a balance sheet is just a snapshot on one particular day it may bear no resemblance to what a company's financial position might be like for most of the year.
This is the case for Carillion and the company, to its credit, is very open about this. In its annual results statement for 2015, Carillion stated that its average net borrowing for the year was £538.9m compared with £450.7m in 2014. This is a big difference from the year end position of £170m. It also means that using year-end balance sheets to calculate ratios such as ROCE and CROCI will understate the capital employed in the business - because borrowings are much higher - and overstate the ratios.
Lots of companies won't tell you what their average debt levels are. However, you can have a good stab at estimating it yourself. Let me show you how you can do this.
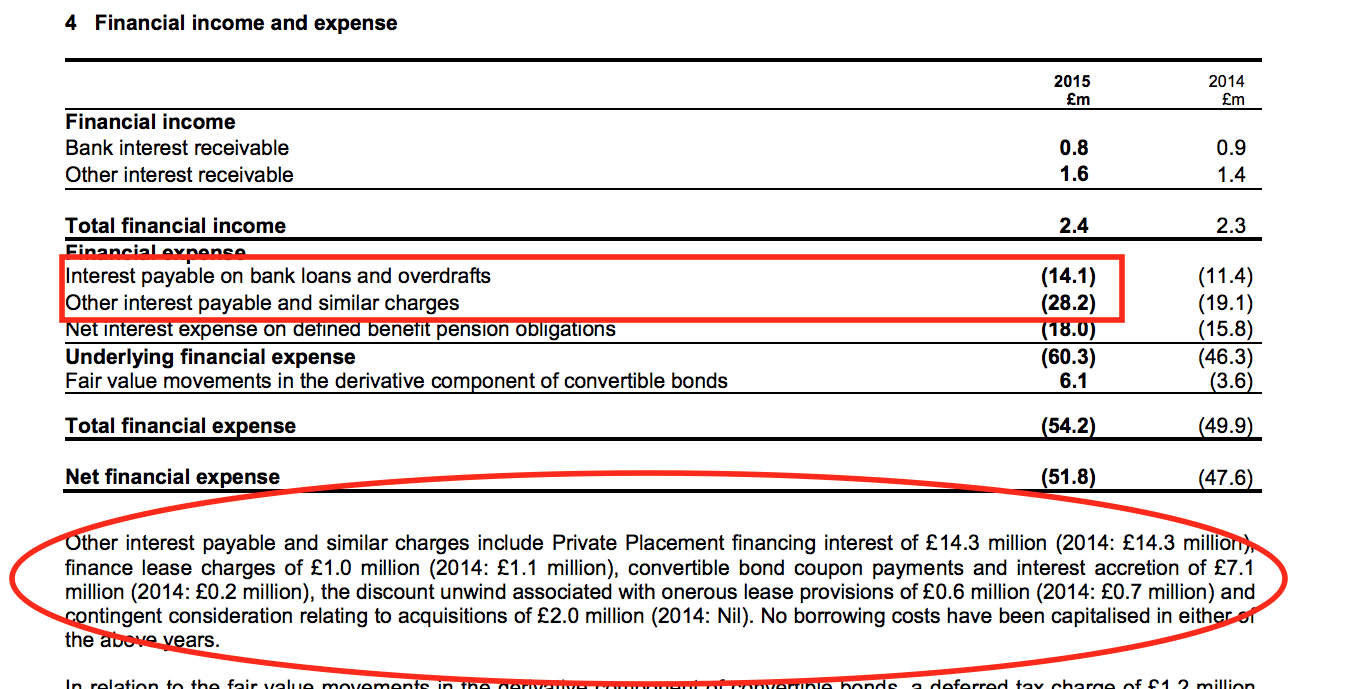
The screenshot above shows the breakdown of Carillion's interest expense. You should ignore the expense related to the pension scheme for now (more on the pension deficit shortly) and just look at the interest payable on borrowings.
To estimate the average level of total borrowings outstanding just divide the interest payable of £42.3m by an interest rate. Let's say that Carillion can borrow money at 5%. The average level of debt throughout the year would be:
£42.3m/5% = £846m
This compares with a year-end figure for total borrowing of £632m. However, the gap between average net borrowing and year-end net borrowing is £369m. This is telling us that at certain times of the year Carillion's cash balances are much lower and borrowings much higher than the above calculation suggests.
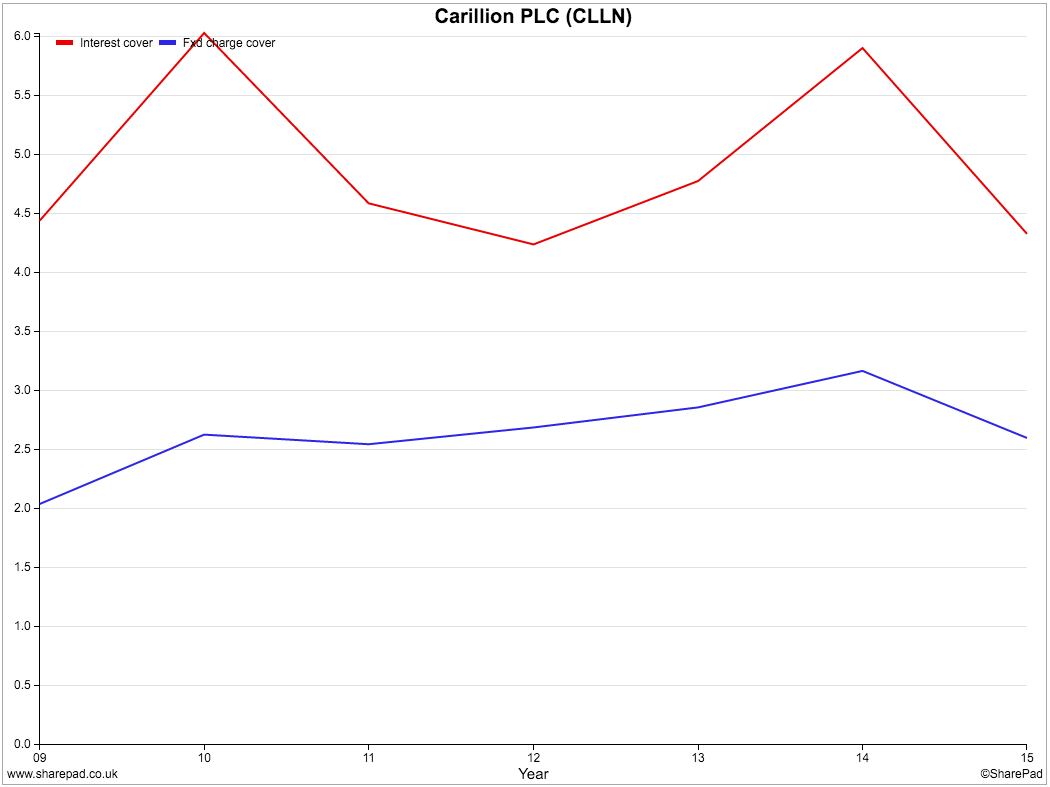
Having established that average debt levels are much higher than the year-end figures, the ratios for fixed charge cover and interest cover are not suggesting that Carillion is about to have financial difficulties. That said, given the significant level of profits coming from construction activities most people wouldn't want to see those ratios go much lower than they are currently.
One particular area of concern for investors is Carillion's substantial pension fund deficit of nearly £400m. The company contributed £47m of top-up payments in 2015 to try and plug the hole. This is a significant liability, and cash cost, and could threaten the company's ability to pay dividends in the future if the deficit doesn't come down.
Valuation and future prospects
At first glance, Carillion shares look to have a very low valuation attached to them. A forecast PE of 8.3 times and a dividend yield of 6.8% might lead you to think that the shares are very cheap. Carillion trades on a big discount to other support services companies with the exception of Interserve.
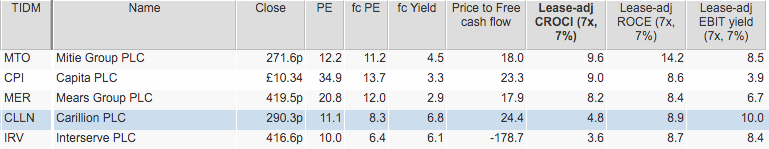
A lease-adjusted EBIT yield of 10.0% might be considered attractive too. However, bear in mind what I have just said about borrowings being understated. If average debt levels were used to calculate enterprise values and EBIT yields then Carillion would have a lower yield on this measure.
As I've said before, there are very few free lunches on the stock market - except when the stock market in general is falling - and therefore it seems that investors are concerned about the company's future prospects. The high yield in particular is usually associated with companies that offer low future dividend growth or a dividend that is likely to be cut.
What you need to try and work out is whether the stock market is right or wrong about Carillion.
The company's core Support Services business which provides the bulk of its profits seems to be doing well. It delivered decent revenue growth in 2015 of 9% and maintained its profit margins. The outstanding order book of £12.7bn represents around five year's current revenues which gives good visibility on future profits. Throw in a bidding pipeline on £12.1bn of contracts in the UK and Canada and it seems that this business is in a decent position.
Elsewhere in Carillion's business portfolio there is less transparency. The big profits from selling equity stakes in PPPs will not be repeated in 2016. The Construction businesses in the UK and Middle East have lots of opportunities to bid for new work but they represent a much lower-quality profit stream than Support Services with much less visibility. This makes them less valuable.
One of the ways you can try and work out how much Carillion shares are worth is to perform a break up or sum-of-the parts valuation (SOTP). This values a company on the basis of all its separate business units being sold off.
Professional analysts use this technique a lot when looking at companies with different businesses. They can be controversial based on the assumptions used to value each business and what liabilities have been included or ignored.
Basically, you take the operating profit for each business (you'll find this in the annual report), tax it at a rate of your choice, and apply a suitable PE multiple (or whatever valuation measure you want to use). I look for a similar business, or businesses, for guidance. This gives us an estimated enterprise value for each division and thus a total for the company. We then adjust this for cash assets and liabilities such as tax credits, debt and pension deficits - things that a potential buyer would add/deduct when valuing the company - to get an estimated equity value. Divide this by the number of shares and you have a value per share which you can compare with the current share price. Click here to read more about this valuation technique.
My valuation for Carillion is shown below. I've tried to be optimistic and have put quite high valuations on the businesses. For example, I've used the forecast PE of Capita to value the Support Services division which better-informed investors might consider to be overly generous. The Construction businesses have been valued at 10 times current post tax profits - the lower end of current multiples in the construction sector. I've used the directors' valuation estimate for the PPP business.
| Carillion SOTP (£m) | Profit | Tax @ 20% | Post tax profit | Multiple | Value |
|---|---|---|---|---|---|
| Support Services | 146.6 | -29.32 | 117.3 | 13.7 | 160,636 |
| PPP | 46 | ||||
| Middle East Construction | 25.3 | -5.06 | 20.2 | 10 | 202.4 |
| Other Construction | 37.8 | -7.56 | 30.2 | 10 | 302.4 |
| Unallocated | -14.6 | 2.92 | -11.7 | 10 | -116.8 |
| Estimated Enterprise Value | 2040.6 | ||||
Adjustments: | |||||
| Tax Assets | 103.8 | ||||
| Average net borrowings | -538.9 | ||||
| Pension deficit | -317.6 | ||||
| Minority interest | -23.8 | ||||
| Estimated Equity Value | 1,264.20 | ||||
| Shares (m) | 430.3 | ||||
| Value per share (p) | 293.8 |
I've taxed profits at a rate of 20% even though Carillion's current tax rate is nearer 12% because it is utilising past losses to lower its tax bill. 20% is a conservative number but I've given back £103.8m for the tax assets (which can be used to reduce future tax bills) on its balance sheet.
I've used the average level of net borrowings compared with the year end number. This reduces the value per share by around 85p as the difference between the two numbers is very big. The pension fund deficit less tax and minority interest figures are taken from the latest accounts.
I get an estimated value per share of 293.8p which suggests that Carillion shares are fairly valued based on my assumptions.
To sum up
- Carillion's profits and share price have struggled to make much progress in recent years.
- Returns on investment are quite modest.
- Free cash flow has suffered due to higher interest payments and lower dividends received from joint ventures.
- The pension fund deficit is large and has been eating up cash flow.
- The sustainability of the dividend is questionable based on current free cash flow and looks to have been partly funded by the proceeds from selling businesses.
- The company looks to have been heavily reliant on acquisitions to grow in the past. Profit growth has slowed in the absence of new purchases.
- Average debt levels are much higher than those on the balance sheet at the year end. This flatters ratios such as ROCE and CROCI and may lead investors to overvalue the company if this is ignored.
- A low PE and high dividend yield may reflect concerns about future growth prospects.
- An optimistic sum-of-the-parts approach suggests the shares are fairly valued.
If you have found this article of interest, please feel free to share it with your friends and colleagues:
We welcome suggestions for future articles - please email me at analysis@sharescope.co.uk. You can also follow me on Twitter @PhilJOakley. If you'd like to know when a new article or chapter for the Step-by-Step Guide is published, send us your email address using the form at the top of the page. You don't need to be a subscriber.
This article is for educational purposes only. It is not a recommendation to buy or sell shares or other investments. Do your own research before buying or selling any investment or seek professional financial advice.

