Stock Watch: Whitbread
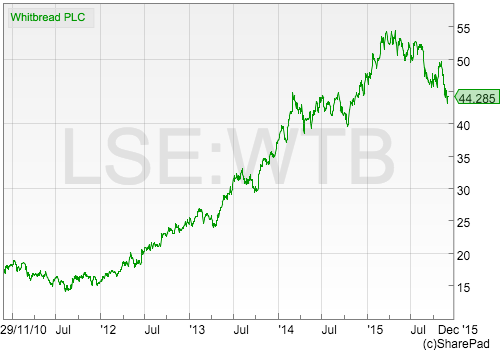
Whitbread (LSE:WTB) has been a great share to own during the last five years. Its share price has soared and when dividends are included investors have made a very nice total return of 173% on their investment.
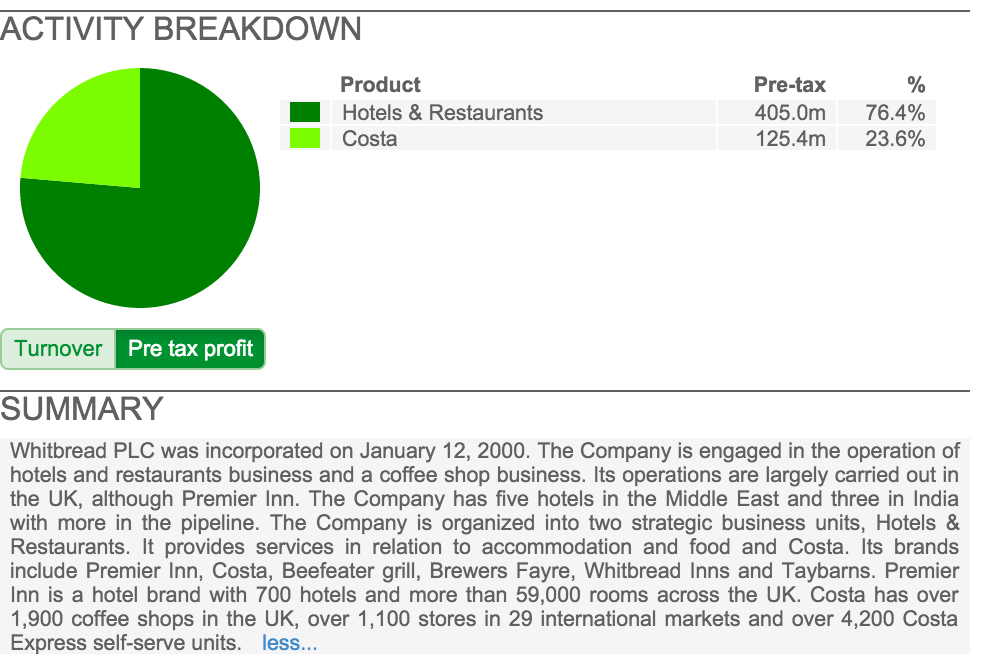
The company has been able to deliver strong growth in its profits by having two very successful consumer brands. Premier Inn hotels seems to have a winning formula by offering customers good quality accommodation at very reasonable prices without all the bells and whistles that the big hotel chains offer.
Costa Coffee has been a phenomenal success. Whilst people are spending less time in pubs, coffee shops are booming in the UK. Whitbread has also been expanding this business overseas and has now put shops in 29 countries.
The company still has very ambitious growth plans for both Premier Inn and Costa. However, it seems that the stock market has gone rather lukewarm on Whitbread shares in recent months as the price of them has fallen sharply since the summer.
The fact that the chief executive will soon leave the company has probably unsettled some investors. This is probably due to many chief executives having the uncanny knack of getting out of a company just before it hits a sticky patch. Time will tell if Whitbread is a case of this. Some analysts seem a little bit concerned that the company's growth rates are slowing down.
At the end of the day, I'm inclined to believe that it is the quality of a company's assets rather than who is running the business that has the biggest impact on its ultimate success.
Let's have a look at what's been going on.
Want to learn how to analyse shares like a professional? Download our FREE guide.
Sign-up to our mailing list to receive a PDF of our Step-by-Step Guide to Investing.
Share this article with your friends and colleagues:
The quality of Whitbread's profits growth
One of the key things to check out when you are studying a company's financial history is the quality of its profits. Companies can grow their profits in many different ways (to read more about this click here) and you need to make sure that the company you are looking at has good quality profits growth rather than bad.
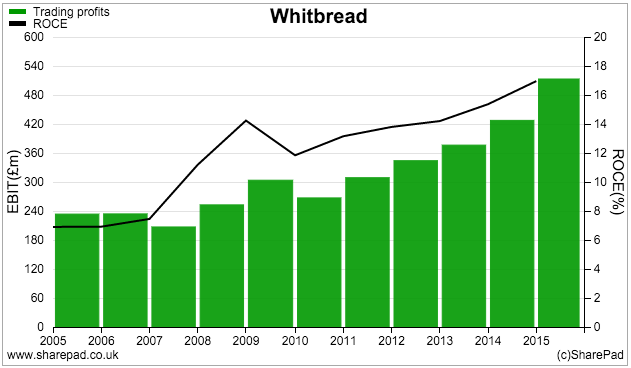
A good starting point is to look at the trend of trading profits (EBIT) with the trend in return on capital (ROCE). You are ideally looking for growing profits with a rising ROCE. Whitbread passes this test as shown in the chart below.
The next thing to do is see if its profits are being turned into free cash flow. The most common way to do this is to compare a company's normalised earnings per share (EPS) - a number investors pay a lot of attention to - with free cash flow per share.
If profits aren't being turned into free cash flow you need to find out why. It could be a sign of poor quality profits or bad accounting.
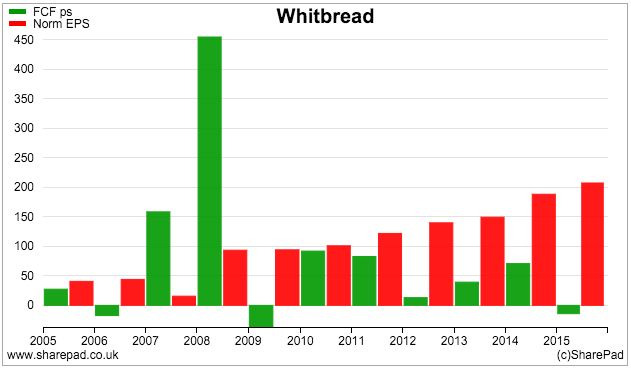
Whitbread's ability to turn EPS into free cash flow has been poor during the last five years. That doesn't necessarily mean something bad is going on, but we need to take a closer look at why this has been happening.
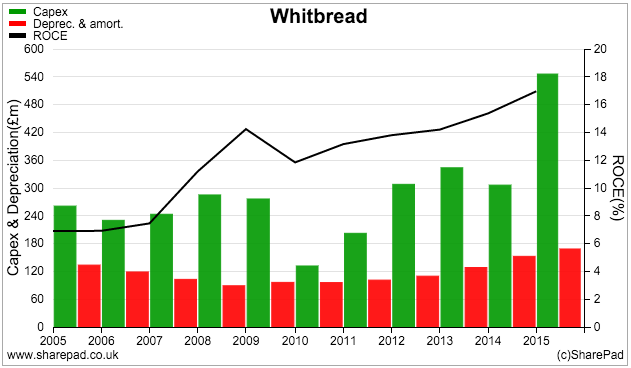
Quite often a company will have low or negative free cash flow because it is investing heavily for future growth. We can see from the chart above that Whitbread has been ploughing a lot of money back into its business with spending on new assets (capex) much higher than depreciation. We already know that this spending has led to higher profits and ROCE so there seems little to worry about here.
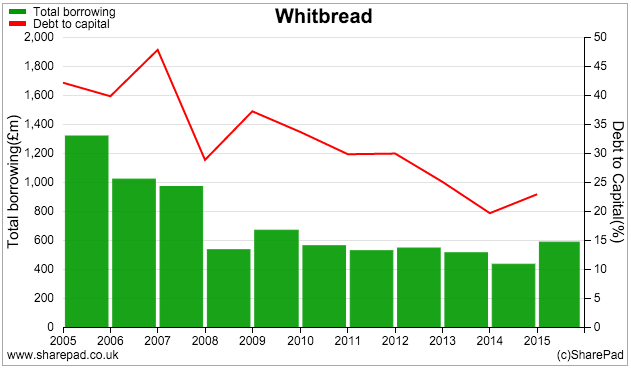
One thing to watch out for when a company is investing and growing as much as Whitbread is whether its finances are being stretched too much. You need to pay attention to what has been happening to its debts and also look to see if it has been expanding with off-balance sheet debt.
Total borrowing has been very stable in recent years as has the ratio of debt to capital (assets). This suggests that all is well in this respect and that the company doesn't have too much debt - at least on its balance sheet.
But what about debt that is hidden and off the balance sheet? Lots of companies in the retail and leisure sectors have chosen to expand by renting rather than buying properties. They do this because it doesn't involve a huge initial outlay of cash. Instead they often enter into long-term rental agreements with property companies. The agreements to pay rent in the future are a real liability that is not shown on a company's balance sheet. They are a form of hidden debt.
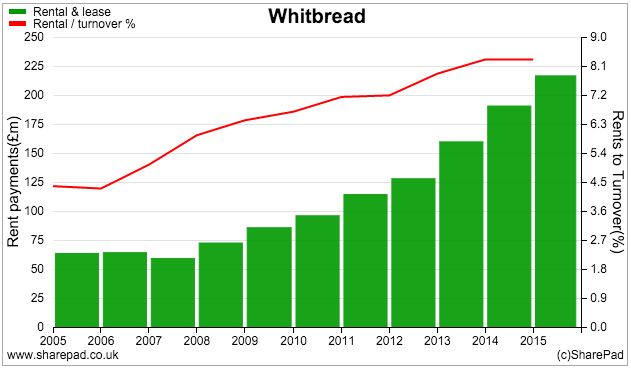
The chart above shows that Whitbread's annual rent payments have increased significantly in recent years to over £200m. This suggests that the company may have around £1.5bn of off balance sheet debt (credit rating agencies tend to multiply rent payments by 6-8 times to get an estimate of this).
What is also of interest is that rent payments have been eating up more of Whitbread's revenue as well. Rents as a percentage of turnover was around 4.5% in 2012, it is now over 8%. This trend needs to be watched carefully.
The ratio of rents to turnover may be increasing because Whitbread has opened up lots of Premier Inns and Costa Coffee shops in recent years. These hotels and shops may not have reached their potential turnover levels yet but are still paying rents.
That said, a rising rent bill increases Whitbread's fixed costs and makes the company's profits vulnerable to sharp falls if turnover starts falling in the future. This is an increasing risk for Whitbread's shareholders by the look of things.
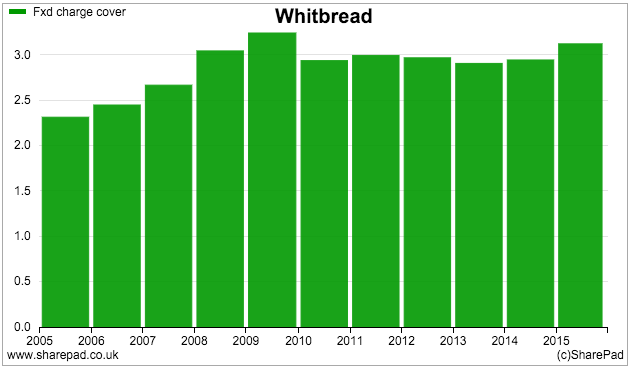
At the moment, Whitbread has sufficient profits to comfortably pay the interest on its debts and its rents as shown by a fixed charge cover ratio of over 3 times.
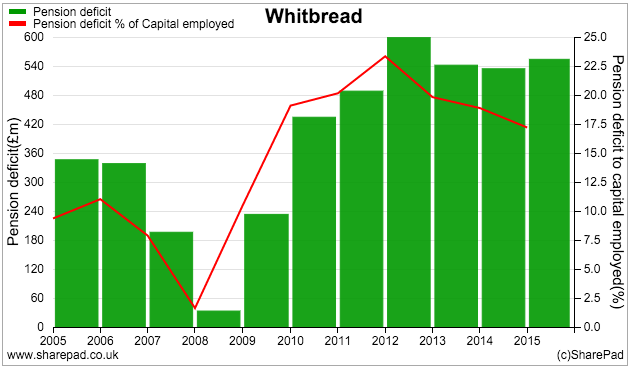
Whitbread also had a significant pension fund black hole to fill of over £500m as of March 2015. This can also be seen as a form of debt that has to be made good. The company will have to make top-up payments into the pension fund which ultimately means less cash to pay dividends.
So we have found out that Whitbread has been growing rapidly and that ROCE and profits have been going up. This is a good sign.
Less encouraging is the growth in off-balance sheet debt and the stubborn pension fund deficit.
Now I am going to dig a lot deeper into Whitbread's two businesses. Whitbread's company accounts provide a lot of really useful information which can allow the diligent investor to learn a great deal about the company.
You do this by reading the commentary in the accounts and analysing the segmental company data. In my experience, not a lot of private investors - or even many professionals - do this and so taking the trouble to do so can give you an edge. When I was a professional analyst I used to spend a lot of my working days doing this.
A closer look at Hotels and Restaurants
This division is Whitbread's biggest source of profits. It consists of the Premier Inn hotel chain and pub restaurants such as Beefeater and Brewer's Fayre - many of which are situated next to the hotels.
| Hotels & Restaurants | 2011 | 2012 | 2013 | 2014 | 2015 | TTM |
|---|---|---|---|---|---|---|
| Sales | 1177.3 | 1239.3 | 1360.1 | 1494 | 1659.2 | 1734.2 |
| EBIT | 283.7 | 296.5 | 314.8 | 351.2 | 404.8 | 429.1 |
| EBITDA | 363.4 | 376 | 401.3 | 450.9 | 514.6 | 543.3 |
| Assets | 2298.2 | 2389.6 | 2522.5 | 2914.5 | 2984.3 | 3194.6 |
| Capex | 169.2 | 244.2 | 261.3 | 231.2 | 451.1 | 512 |
| Maintenance Capex | 103.1 | 83.7 | 149.8 | 130.3 | ||
| Depreciation and Amortisation | 79.7 | 79.5 | 86.5 | 99.7 | 109.8 | 114.2 |
| Rents | 51.4 | 69.7 | 89 | 107.5 | 113.3 | |
| Ratios: | ||||||
| Sales growth | 5.30% | 9.70% | 9.80% | 11.10% | ||
| EBIT margin | 24.10% | 23.92% | 23.15% | 23.51% | 24.40% | 24.74% |
| EBITDA less Capex | 194.2 | 131.8 | 140 | 219.7 | 63.5 | 31.3 |
| EBITDA less Maint. capex | 298.2 | 367.2 | 364.8 | 413 | ||
| Capex to Depreciation | 212% | 307% | 302% | 232% | 411% | 448% |
| Capex to Sales | 14.40% | 19.70% | 19.20% | 15.50% | 27.20% | 29.50% |
| Maintenance capex to Sales | 6.40% | 6.70% | 6.60% | 6.60% | ||
| Maintenance capex to Depreciation | 119.20% | 84.00% | 136.40% | 114.10% | ||
| ROCE | 12.30% | 12.40% | 12.50% | 12.10% | 13.60% | 13.40% |
| Rents as % of Sales | 4.15% | 5.12% | 5.96% | 6.48% | 6.53% | |
| Rents at 7x | 0 | 359.8 | 487.9 | 623 | 752.5 | 793.1 |
| Lease-adj EBIT @ 7% | 321.7 | 349 | 394.8 | 457.5 | 484.6 | |
| Lease-adj Capital employed | 2749.4 | 3010.4 | 3537.5 | 3736.8 | 3987.7 | |
| Lease-adj ROCE | 11.70% | 11.60% | 11.20% | 12.20% | 12.20% | |
The data in the accounts has allowed me to crunch a lot of numbers. This process is quite hard work at first, but once you have set your spreadsheet up for one division of a company other ones can be analysed very quickly.
I have looked at the Hotels and Restaurants business for the last five years and have calculated the year-to-date or trailing twelve month financial performance as well.
Sales growth has been strong as Whitbread has opened lots of Premier Inns and hotel rooms in recent years. It currently has over 700 hotels and nearly 60,000 hotel rooms. Most of these are in the UK, but the company is opening a few hotels in the Middle East, India and Germany although these overseas hotels aren't making any money yet.
Profits have been growing slightly faster than sales as evidenced by EBIT margins going up slightly. As you can see, this business is quite profitable with EBIT margins approaching 25%.
This is only half the story though. This business has to spend money building new hotels and restaurants in order to grow. You can see from the Capex to depreciation ratio in the table above that during the last couple of years, capex (new hotels and restaurants) spending has risen sharply. It is currently running at over 4 times annual depreciation and nearly 30% of turnover (Capex to sales) - these are big numbers.
Whilst profit margins are high, ROCE is reasonable rather than stunning at 13.4%. If leases are included, ROCE falls to 12.2%. This makes Premier Inn a reasonable rather than exceptional business in my view. However, if Whitbread builds enough new hotels earning 12-13% you can see how profits can grow strongly. Whitbread wants to have 85,000 rooms in service by 2020 and will therefore be spending a lot of money.
Given the high levels of investment, it's not surprising that the free cash flow of this business is less than profits. You can estimate the free cash flow of a division by calculating EBITDA and taking away capex. During the last year or so, this business has not had much cash left over.
In the finance director's report, Whitbread very helpfully tells us how much money it is spending on refurbishing its hotels (new beds, carpets etc) or its maintenance or stay in business capex. This has generally been more than the company's depreciation expense and has been consistently about 6.5% of sales. This might suggest that its profits are slightly overstated. During the last year EBITDA less maintenance capex was £413m against reported EBIT of £429m.
What seems clear from this analysis is that Premier Inn needs to spend a lot of money to grow and also spend a lot of money to keep its hotels attractive for customers and therefore maintain sales. This explains why its ROCE is acceptable rather than great. What would happen to growth if Whitbread stopped opening new hotels?
The business is still trading well, especially in London. Like-for-like sales (sales from hotels and restaurants that have been open at least a year) are growing at 5%, compared with 9% last year.
Costa Coffee
Costa has been growing faster than Premier Inn. Not only has Whitbread been opening lots of new coffee shops in the UK and abroad it has also been installing self-service coffee machines in places like petrol stations, hospitals and train stations. Like-for-like sales have been growing strongly and profit margins have been going up.
| Costa | 2011 | 2012 | 2013 | 2014 | 2015 | TTM |
|---|---|---|---|---|---|---|
| Sales | 422.3 | 538.7 | 672.4 | 807.7 | 951.9 | 1023.5 |
| EBIT | 48.2 | 69.7 | 90.1 | 109.8 | 132.5 | 147.6 |
| EBITDA | 69.6 | 99.9 | 132 | 162.1 | 190.4 | 210.2 |
| Assets | 178.3 | 215.3 | 259.9 | 271.4 | 286.1 | 306.2 |
| Capex | 31 | 62.2 | 76.7 | 72 | 67.4 | 70.9 |
| Maintenance Capex | 18.2 | 21.9 | 25.9 | 27.3 | ||
| Depreciation and Amortisation | 21.4 | 30.2 | 41.9 | 52.3 | 57.9 | 62.6 |
| Rents | 56.5 | 72 | 92.5 | 101 | 104.9 | |
| Ratios: | ||||||
| Sales growth | 27.60% | 24.80% | 20.10% | 17.90% | ||
| EBIT margin | 11.41% | 12.94% | 13.40% | 13.59% | 13.92% | 14.42% |
| EBITDA less Capex | 38.6 | 37.7 | 55.3 | 90.1 | 123 | 139.3 |
| EBITDA less Maint. capex | 113.8 | 140.2 | 164.5 | 182.9 | ||
| Capex to Depreciation | 145% | 206% | 183% | 138% | 116% | 113% |
| Capex to Sales | 7.30% | 11.50% | 11.40% | 8.90% | 7.10% | 6.90% |
| Maintenance capex to Sales | 6.20% | 6.50% | 6.10% | 6.10% | ||
| Maintenance capex to Depreciation | 0.00% | 0.00% | 43.40% | 41.90% | 44.70% | 43.60% |
| ROCE | 27.00% | 32.40% | 34.70% | 40.50% | 46.30% | 48.20% |
| Rents as % of Sales | 10.49% | 10.71% | 11.45% | 10.61% | 10.25% | |
| Rents at 7x | 0 | 395.5 | 504 | 647.5 | 707 | 734.3 |
| Lease-adj EBIT | 97.4 | 125.4 | 155.1 | 182 | 199 | |
| Lease-adj Capital employed | 610.8 | 763.9 | 918.9 | 993.1 | 1040.5 | |
| Lease-adj ROCE | 15.90% | 16.40% | 16.90% | 18.30% | 19.10% | |
Cash profits (EBITDA less maintenance capex) and ROCE are more impressive than at the hotels and restaurants business. In stark contrast to Premier Inn, Costa's maintenance capex has been consistently less than its depreciation charge. Is Costa under-investing perhaps? If it isn't then maybe its profits are understated. EBITDA less maintenance capex for the last year (TTM) was £182.9m compared with EBIT of £147.6m - a significant difference - and a positive one at that.
Even with over £700m of hidden debt taken into account, lease-adjusted ROCE is currently running at 19.1% and is rising. Based on its free cash flow and ROCE performance, Costa looks to be an extremely good business.
But can the good times continue? You could be forgiven for thinking that Britain is saturated with coffee shops with one on every corner. Yet Whitbread remains optimistic that it can still grow in the UK and abroad in places like China. It points out that British people drink a lot less coffee per head than American people do and that this can increase. It is aiming to have 2500 stores in the UK by 2020 compared with just under 2000 now. It wants to increase the number of Costa Express machines from around 4300 to 8000.
If all goes well, Costa sales will reach £2.5bn by 2020 compared with just over £1bn now according to the company, This would imply a very rapid and big jump in profits.
Sales growth at Costa has slowed slightly recently whilst increases in staff wages could threaten profits growth.
The valuation of Whitbread shares
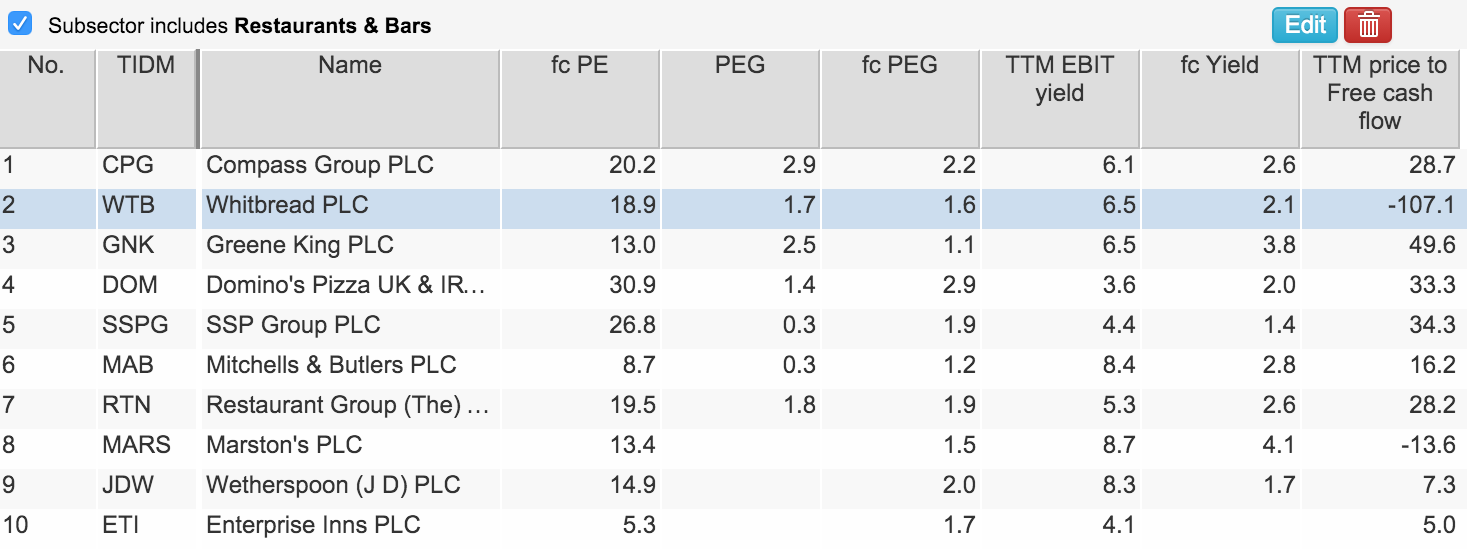
It's hard to argue that Whitbread shares are very cheap based on traditional valuation multiples such as PE, PEG and EBIT yield. Then again, based on the expectations of future profits growth it is not surprising.
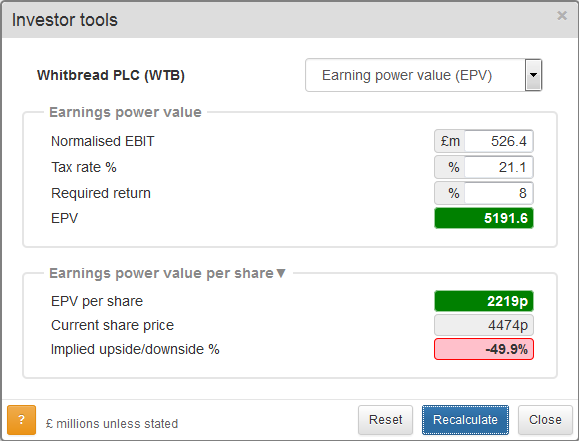
This is also shown up in the earnings power value (EPV) - a valuation of the shares based on current profits staying the same forever - which gives a value of 2219p or half Whitbread's current share price. This means that half its share price is attributable to future growth in profits based on a required return of 8% in the EPV model. So quite a lot of growth could be baked into the share price.
I have used Whitbread's forecast normalised EBIT (£526.4m) for this calculation.
What do City analysts think?
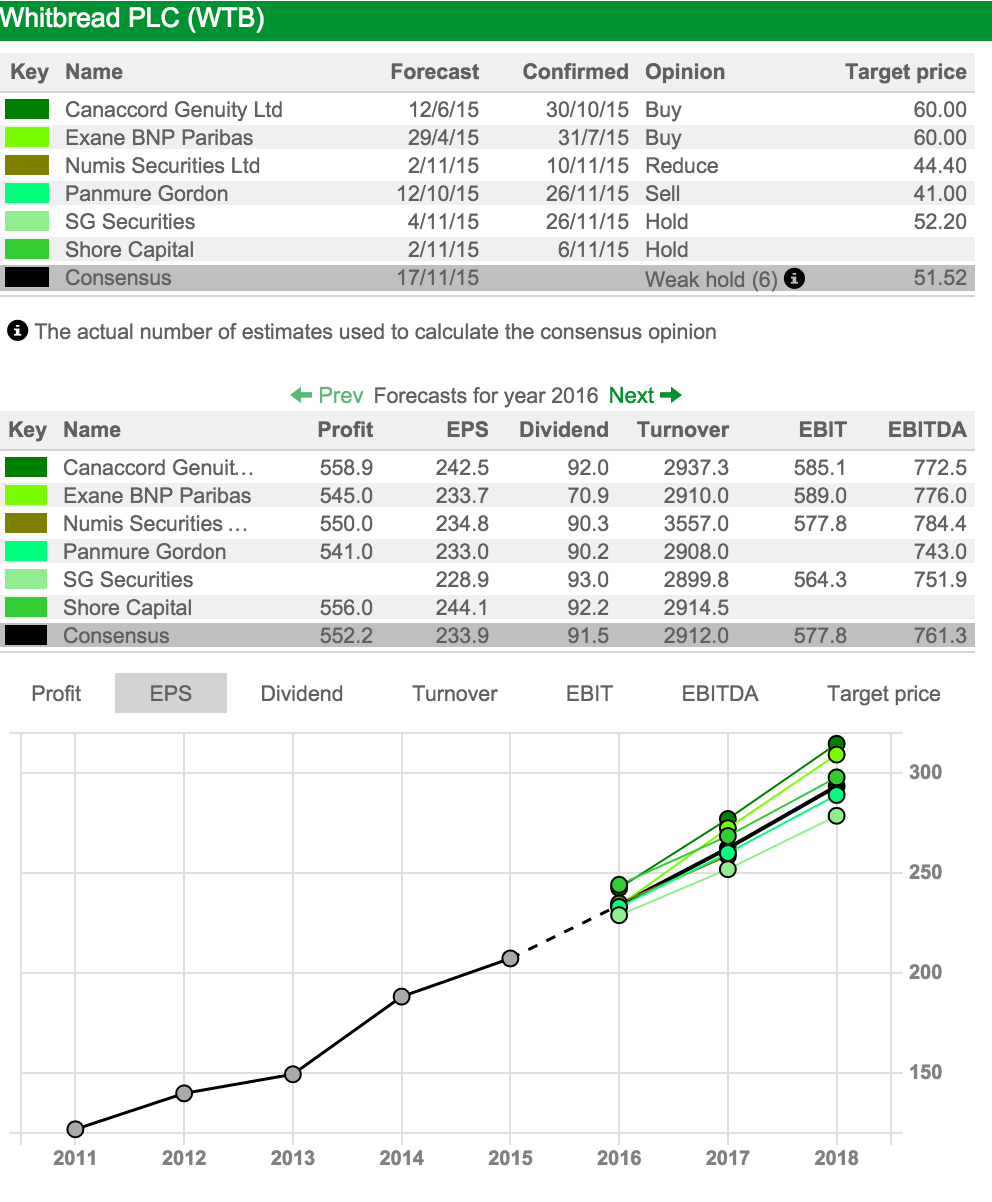
The more recent analyst updates has seen opinion turning more bearish on Whitbread shares. The consensus opinion from the six analysts surveyed is a weak hold. As you can see from the chart below, EPS profits are still expected to grow strongly.
Could Whitbread be broken up?
Some commentators have suggested that Whitbread shares could be worth more if the company was broken up and the Hotels and Costa parted company. One way to estimate what the company could be worth is to do a sum-of-the-parts or break up valuation. This is when each business is valued separately then added together to see what the value might be. (To read more on this approach click here). This is how many City analysts determine their price targets for a share.
I am not an expert hotels or coffee shop analyst but I've had a go at a break-up valuation for Whitbread below. I've based it on its current cash profits (EBITDA less maintenance capex) and applying EBIT yields of similar companies to the Hotels and Costa to get an estimated per share value of the business.
The thing to bear in mind with this approach is that they may be wildly inaccurate as the companies used to get comparator valuations may be under or overvalued themselves. You may not be able to find a similar company to get a valuation at all. If you are doing this approach yourself with any company, you need to be as conservative as possible and run different high and low valuation scenarios before you come to a decision on whether the shares are a buy or a sell.
| Whitbread plc SOTP £m | TTM Cash profits | EBIT yield | Reason | Implied EV |
|---|---|---|---|---|
| Hotels | 413 | 5.90% | Same as Inter-Conti Hotels | 7000 |
| Costa | 182.9 | 4.30% | Same as Starbucks | 4253 |
| Central costs | -30 | 8% | Same forever(EPV) | -375 |
| Estimated Enterprise Values | 10878 | |||
less (TTM): | ||||
| Net borrowings | -725.9 | |||
| Pension deficit | -430.9 | |||
| Minority Interests | -4.5 | |||
| Estimated Equity Value | 9717 | |||
| Shares in issue (m) | 182.5 | |||
| Estimated Value per share(p) | 5324 | |||
If you have found this article of interest, please feel free to share it with your friends and colleagues:
We welcome suggestions for future articles - please email me at analysis@sharescope.co.uk. You can also follow me on Twitter @PhilJOakley. If you'd like to know when a new article or chapter for the Step-by-Step Guide is published, send us your email address using the form at the top of the page. You don't need to be a subscriber.
This article is for educational purposes only. It is not a recommendation to buy or sell shares or other investments. Do your own research before buying or selling any investment or seek professional financial advice.

