Understanding a company's debt
Debt or borrowings can be the biggest enemy of anyone investing in shares. The simple reason for this is that lenders always get paid before shareholders do.
Shareholders are last in the queue to get a slice of a company's profits or assets. This means the more debt that it is in front of you, the more risky your investment in a company's shares can be.
Debt is something that investors can become very complacent about. When times are good, debt can be very helpful and juice up profits growth via a process known as financial gearing. When times are bad, the process can work in reverse and devastate profits for shareholders. In a worse-case scenario it can wipe them out completely.
In this article, I am going to show you how to weigh up a company's debt position. Once you understand it, you will be able to stay away from potentially dangerous companies and make better investment decisions.
You will be able to examine a company's total borrowings, pension fund deficits and hidden debts and find out how risky its shares could potentially be.
Want to learn how to analyse shares like a professional? Download our FREE guide.
Sign-up to our mailing list to receive a PDF of our Step-by-Step Guide to Investing.
Share this article with your friends and colleagues:
Why debt can be dangerous to shareholders
There is nothing wrong with debt per se. Many companies borrow in order to try and grow the business. It is too much debt that is the problem. When companies borrow too much and make bad investments it is the shareholders who can end up footing the bill.
The best way to understand the risk of debt to shareholders is to show how it can have a big impact on the profits made for them. The interest on debt magnifies the changes in shareholder profits resulting from a change in sales. This is known as financial gearing.
Just as a higher gear on a bike means that you can travel further with each turn of the pedals, more debt and more interest has a bigger impact on profits for each percentage change in sales. This is great when things are going well and sales are growing. Not so good when times are tough and sales are falling.
Have a look at the example below.
Let's compare two identical companies with identical amounts of money invested (£1 billion) and both earning £200m in trading profits a year. This gives a return on investment (ROCE) of 20%.
Company A has no debt. Company B has lots of debt. It has chosen to finance its £1 billion of assets with £800m of debt at an interest rate of 10% and £200m of shareholders' equity. Company B therefore has an £80m interest bill to pay every year (10% x £800m).
Looking at Company A first.
| £m | Normal | Good | Bad |
|---|---|---|---|
| Sales | 1000 | 1200 | 800 |
| % change | 20.00% | -20.00% | |
| EBIT | 200 | 240 | 160 |
| %change | 20% | -20% | |
| Interest | 0 | 0 | 0 |
| Profit before tax | 200 | 240 | 160 |
| Taxation @ 20% | -40 | -48 | -32 |
| Profit for shareholders | 160 | 192 | 128 |
| % change | 20.00% | -20.00% |
Company A turns £1bn of sales into £200m of EBIT and £160m of profit for shareholders after taxation at a rate of 20%. To keep things very simple, I've assumed that the percentage change in sales will feed through to the same percentage change in EBIT just to illustrate financial gearing.
This won't be the same in the real world as companies have operating costs which are fixed and don't change when sales change. This gives rise to something known as operational gearing which means that for a given percentage change in sales there will be a bigger percentage change in trading profits.
The easiest way to spot a company with high operational gearing is to look at the track record of its turnover and trading profits. If you see that profits move up and down a lot over a long period of time that is usually a telling sign. Buying shares in companies with stable profits and profit margins reduces your risk as an investor.
As you can see with the case of company A, with no financial gearing, the change in profits for shareholders mirrors the percentage change in sales. A 20% change in sales leads to a 20% change in profits. Even when sales fall by 20% there is still £128m of profits for shareholders.
Now let's look at Company B
Here, the existence of debt and interest payments gears the change in profits because the £80m of interest has to be paid come what may. A 20% increase in sales leads to a 33.3% change in profits.
| £m | Normal | Good | Bad |
|---|---|---|---|
| Sales | 1000 | 1200 | 800 |
| % change | 20.00% | -20.00% | |
| EBIT | 200 | 240 | 160 |
| %change | 20% | -20% | |
| Interest @ 10% | -80 | -80 | -80 |
| Profit before tax | 120 | 160 | 80 |
| Taxation @ 20% | -24 | -32 | -16 |
| Profit for shareholders | 96 | 128 | 64 |
| % change | 33.30% | -33.30% |
That's fine when times are good. However, during bad times shareholders take a big hit. Company B's shareholders end up with half as much money as Company A's.
This is why debt can be very dangerous for shareholders, particularly in the case of cyclical companies whose sales have a tendency to move up and down a lot in line with the general economy or commodity prices.
How to check out a company's debts
When you are looking at a company's debts there are three things you need to consider:
- Total borrowings - the amount of money provided by lenders.
- Pension fund deficit - this is a form of debt in everything but name. If a company was liquidated then the pension fund deficit would have to be made good before shareholders received a penny. Deficits also have to be plugged with extra cash contributions. This is cash that can't be paid out to shareholders as dividends or invested in the business.
- Hidden debts - operating leases or rents on assets used in a business.
You will find the first two items disclosed on the face of a company's balance sheet classified as liabilities. You'll also find them in SharePad. Total borrowings can be short-term liabilities which are due to be paid within one year, or long-term borrowings which have to be paid after one year. Pension fund deficits are long-term liabilities. (To read more about pension fund deficits click here.)
Hidden debts are not shown on a company's balance sheet. However, the obligation to pay rents on properties or for plant and equipment for a number of years in the future is a significant liability. They will have to be shown on balance sheets from 2019 onwards but don't have to be at the moment. SharePad can estimate the amount of hidden debts that a company has (click here to read more about hidden debts).
Let's look at each of these different types of debts in turn by examining a real company. I am going to use Tesco (LSE:TSCO) to do this.
Below is a screenshot of Tesco's balance sheet taken from SharePad. Its short-term and long term borrowings are clearly shown as is the pension fund liability.
At the bottom of the balance sheet is a supplementary table which shows Tesco's total borrowings and when they are due to be paid back.
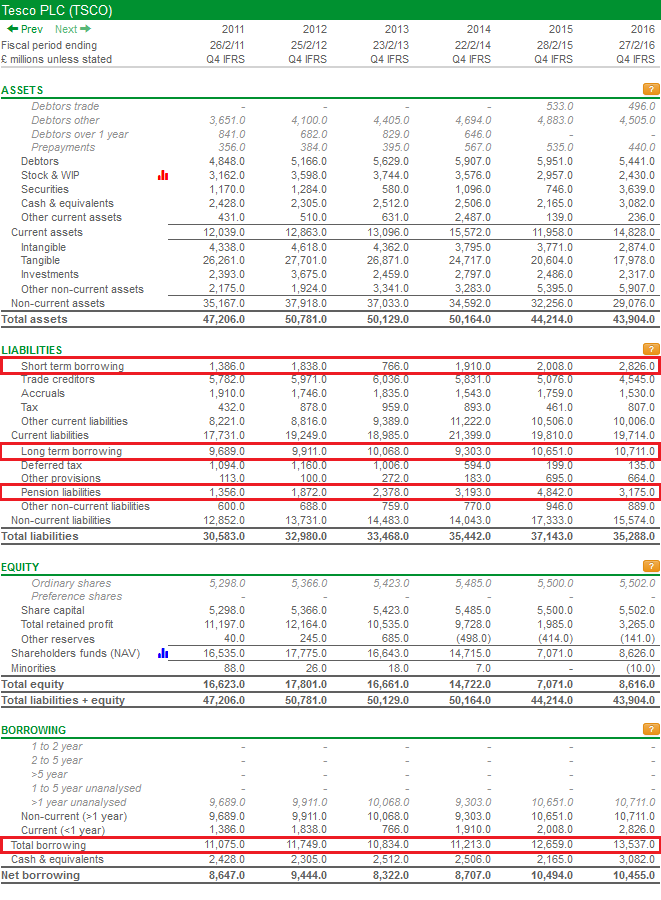
It's a good idea to keep an eye on the split between short-term and long-term borrowings. Large debts that are due to be repaid are usually replaced with another loan. If interests rates are rising then a company might have to pay a higher rate than its existing loan which could depress profits. If interest rates are falling, then the interest costs on the new loan might be lower which might boost profits.
Large amounts of debt falling due was a big problem for companies during the financial crisis in 2008. Some were unable to get the amount of money they needed at a reasonable interest rate. It gave investors a stark warning of the risks of a company being financed with debt and is a reason why some investors avoid companies with any debt at all.
Finding the amount of borrowings/debt and pension fund deficits is very straightforward. You now need to try and make sense of them. The first thing you should do is look at the trend of the debt and pension deficit numbers - are they rising or falling?
This is easy to do in SharePad as it has over 20 years of financial data for companies - provided they've been around for that long. Ideally, you should look at financial data over at least 10 years to see what's been going on and whether there is any pattern.
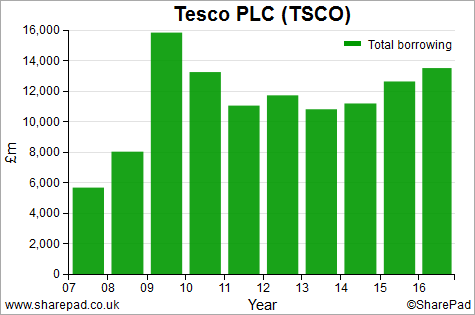
Below we can see that Tesco's total borrowing peaked at just under £16bn in 2009. It then came down significantly but has been rising every year since 2013.
Let's have a look at what's been happening with the pension fund deficit.
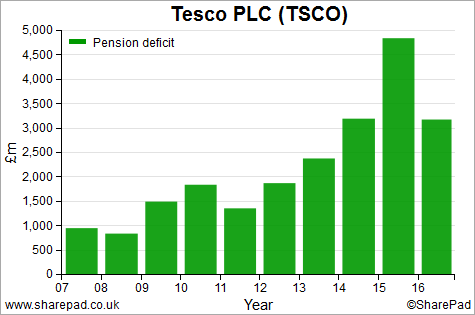
As we can see, the deficit has increased from around £1bn to over £3bn in 2016, having been nearly £5bn in 2015. You can also see that the deficit has moved around a lot - in other words it is quite volatile.
Tesco's interim results released in early October 2016 (as I write) reveal that its pension fund deficit has ballooned to £7.1bn. As a rough rule of thumb, pension fund trustees will ask a company to plug a deficit over ten years.
So if you divide the deficit by 10, Tesco will have to make extra top-up payments of around £700m per year to plug the deficit. That's £700m of cash that can't be paid to shareholders. This is why pension fund deficits matter.
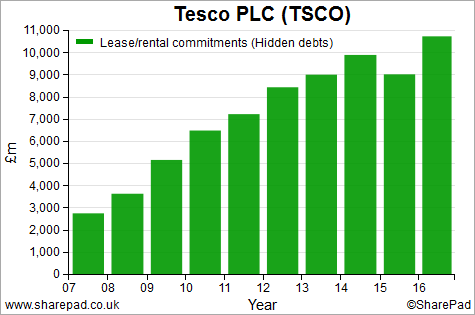
In the chart below you can see that its hidden debts (lease & rental commitments) have increased significantly as it has sold a lot of its supermarkets to property companies and rented them back under long-term agreements.
So we can see that Tesco has significant total borrowings, pension fund deficit and hidden debts. It has a lot of debt. But what does this actually mean for an investor?
Debt ratios in SharePad
SharePad has lots of different debt ratios which can help you weigh up a company's debt position. It gives you lots of options when calculating the ratios so that you can dig deeper into a company's finances.
As the pension fund deficit is effectively a form of debt, SharePad gives you the option to add it to borrowings when calculating debt ratios.

All these ratios are useful and some of them are telling you broadly the same thing. Later in the article, I'll tell you which I prefer.
Gross Gearing
This ratio tells you the size of a company's borrowings relative to the amount of money (equity) invested by shareholders - its equity finance. As a rule of thumb, the bigger the total borrowings relative to equity, the more potential risk the shareholders are exposed to.
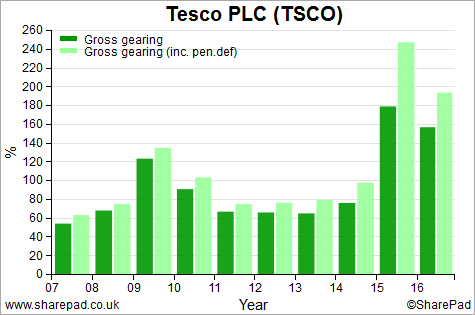
Tesco's gearing has increased significantly since 2014, especially when the pension fund deficit is taken into account.
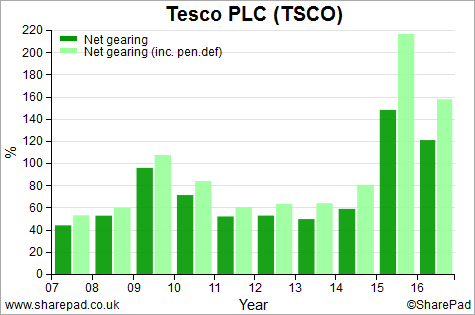
Net gearing
This is similar to gross gearing with the exception that cash balances are taken away from total borrowings to compare net borrowings with equity. Again, the higher the ratio the more potential risk shareholders are exposed to.
As with the gross gearing ratio, it shows that the financial risks to Tesco shareholders has increased since 2014.
Debt to net operating cash flow
This is another measure of how well-placed a company is to deal with its debts. It tells you how long it would take for a company to repay its debts from its net operating cash flow (its after-tax trading cash flow). This ratio is used a lot by credit rating agencies. The bigger the ratio, the more indebted a company is.
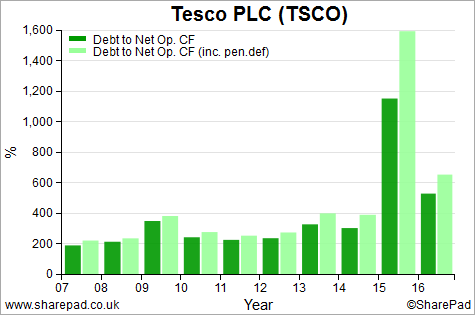
In effect this ratio looks at a company's ability to repay its debts if it cut back its capital expenditure to zero - which can't be done for long - and gives you a feel for how fast debt could come down if it needed to.
The ratio can change for two reasons. Either debt is going up or cash flow is falling. Both happening at the same time could be very uncomfortable.
This is what happened with Tesco in 2015. In 2016, net operating cash flow recovered, but it would still take over 6 years (i.e. the debt to net operating cash flow is over 600%) to repay all its debt and pension fund deficit.
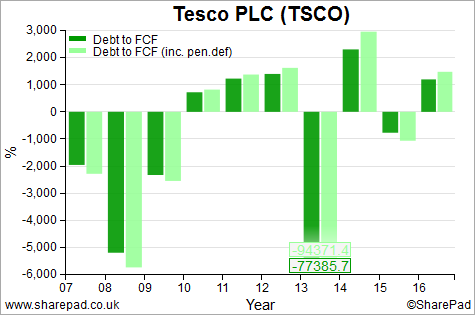
Debt to Free cash flow
A much more prudent measure of a company's debt-paying ability is to compare total debts to free cash flow. Free cash flow is the cash that is left over after a company has paid all its essential bills such as tax, interest on debts, pension fund payments and investment in new assets (capex).
The company is free to do whatever it wishes with this cash. For example, it could pay it to shareholders in the form of a dividend, reinvest it in the business or it could reduce its borrowings. The Debt to free cash flow ratio tells you how many years it would take a company to repay its debts based on its most recent free cash flow.
Tesco has not looked good on this measure for a number of years as it was not generating much free cash flow. Based on its most recent free cash flow it would take almost fifteen years to pay off all its debts and pension fund deficit.
Note this ratio can be a negative number if free cash flow is negative.
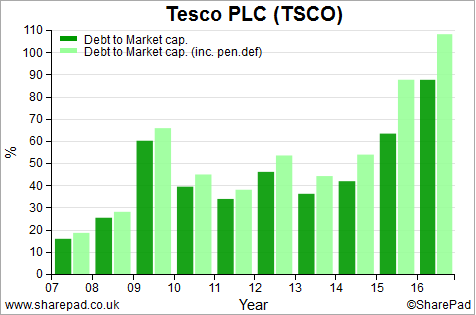
Debt to Market Capitalisation
This ratio compares the total borrowings of a company with its market capitalisation (the number of shares in issue times the share price).
A ratio above 100% shows that the value of debt is bigger than the current face value of the company's shares and may be a sign of a company with a weakening or distressed financial position.
Tesco's financial position has been deteriorating in recent years. Including its pension deficit, Tesco's Debt to Market cap. is currently over 100% (October 2016).
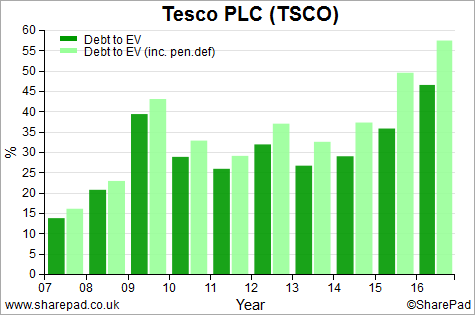
Debt to Enterprise Value
Comparing the level of debt to EV is a better measure of financial risk than debt to market cap.
Enterprise value (EV) is a more prudent or realistic measure of the market value of a company. SharePad calculates EV by adding the value of net debt, pension deficit/surplus and minority interests to market capitalisation. All these 'debts' would be a cost to a prospective buyer.
Essentially:
Enterprise value = Market capitalisation + debts
Enterprise values in SharePad include pension fund deficits as standard. As an option, you can also include rental/lease commitments (hidden debts).
If a company's trading profits fall, or are expected to fall, then its EV is likely to fall. As the debt part of EV is fixed in the short term, it is the market capitalisation (and therefore the share price) that has to fall.
The higher the proportion of debt to EV, the more the effect on market capitalisation is magnified and the greater the risk to shareholders. I explain how in the box below.
Let me show you how this plays out in practice. However, before I do let me explain something which I consider to be quite basic but very important.
The accounting value of a company's equity is the value of its assets less its liabilities. This is clearly shown on every company balance sheet.
The market value of a company's assets is its enterprise value.
To get a market value of equity - a market capitalisation - we need to take away the value of borrowings and pension fund deficit from enterprise value.
Other big liabilities such as trade creditors and accruals are ignored as they have been expensed against revenues and are therefore included in the calculation of profits (and a company's assets).
Just like the equity value in your house is determined by the house's value (its asset or enterprise value) less the value of your mortgage, the same principle applies to the equity value of companies. It is the residual asset value - what is left over - after debt has been taken away from the total asset value.
So let's see what happens to a company's equity value when its enterprise value falls.
Company A and Company B have identical trading profits (EBIT) of £100m. The EV for both companies is £1bn or 10 times EBIT.
Company A has £700m of debt-like liabilities giving a debt to EV of 70%. It's market capitalisation is therefore £300m.
Company B has £200m of debt giving a debt to EV of 20%. Its market capitalisation is £800m.
Both companies see profits fall 10% to £90m but the market value is still 10 times profits (£900m) - also a 10% fall. In the table below you can see what happens to the respective EVs and market capitalisations of both companies.
| Company A | Company B | |||||
|---|---|---|---|---|---|---|
| Before | After | %change | Before | After | % change | |
| EV | 1000 | 900 | -10% | 1000 | 900 | -10% |
| Debt | -700 | -700 | 0% | -200 | -200 | 0% |
| Market Cap | 300 | 200 | -33% | 800 | 700 | -13% |
| Debt/EV | 70% | 78% | 20% | 22% | ||
Company A with a higher debt to EV ratio sees a 33% fall in its market cap compared to just 13% for the far less indebted Company B. This is why companies with high debt to EVs are more risky.
Tesco's rising debt to EV ratio can be clearly shown in the chart below:
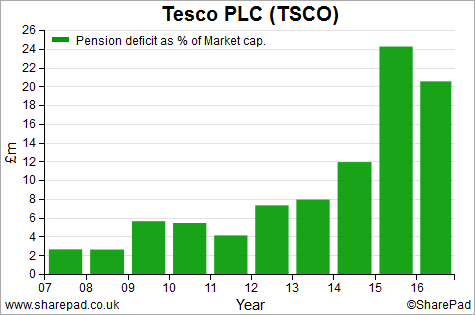
Pension fund deficit as % of market cap
The pension fund deficit as a percentage of market capitalisation can be split out on its own so that you can identify companies where the pension fund deficit has the potential to cause a lot of problems. Tesco's ratio has been increasing.
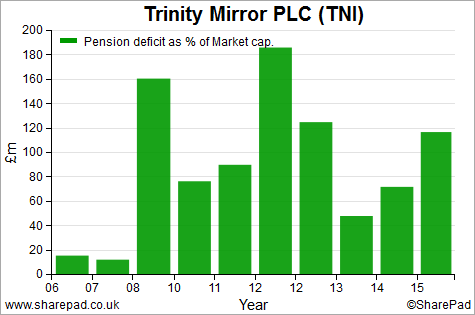
At over 100% of market capitalisation, Trinity Mirror's pension fund is a big problem.
Measuring how well a company can cope with its debts
So far we have just looked at balance sheet ratios. You can get a measure of how indebted or not a company is by looking at how well its income or profits can cope with costs of debt (interest) and the rents on hidden debts.
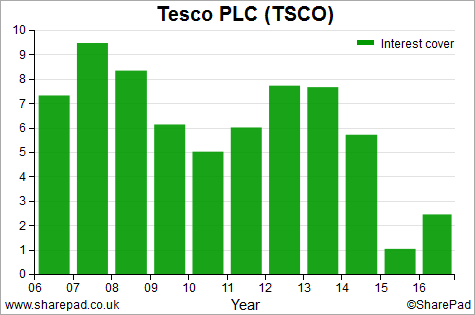
Interest cover
The most commonly used ratio is interest cover which tells you how many times a company's trading profits (EBIT) can pay the annual interest bill on its borrowings. Property and utility companies can have low interest cover ratios of 2-3 times and it not be a problem. For other non-financial companies, interest cover of less than 3 times would generally be a cause for concern. Tesco in 2015 and 2016 is a case in point.
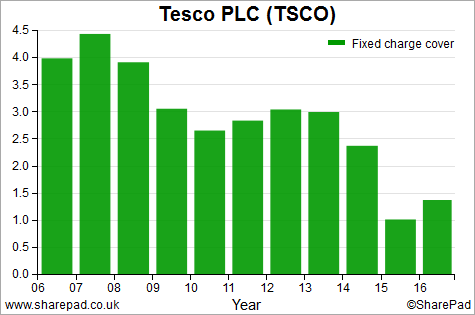
Fixed charge cover
This is similar to interest cover, but it also takes into account the rental costs on leased assets which give rise to hidden debts.
Fixed charge cover is very relevant in sectors such as retail or transport when lots of assets are rented (e.g. shops and airlines). A deteriorating fixed charge cover ratio can be a sign of financial difficulties ahead and is something to worry about if it goes below 1.3 times.
Which debt ratio should I use?
It's up to you as all of them are useful. However, I think it makes sense to include the pension fund deficits in every ratio as these 'debts' matter. If I had to choose just four debt ratios I would look at the following:
- Gross gearing including pension deficit.
- The value of and trend in hidden debts.
- Fixed charge cover - this is arguably the most valuable as it tells you how well a company's profits can cope with both interest and lease/rental payments.
- Debt to EV including pension deficit - a measure of how risky the shares could be if profits fall.
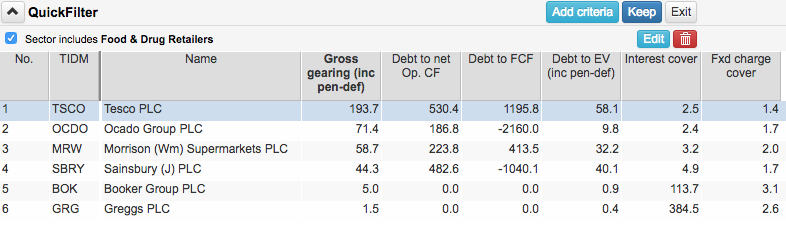
Comparing debt ratios across sectors in SharePad
It is very easy to compare debt ratios - or any ratio for that matter - in SharePad. You just add your ratio columns to a list of shares and then select a sector filter. One for Food and Drug retailers in the FTSE 350 index is shown below.
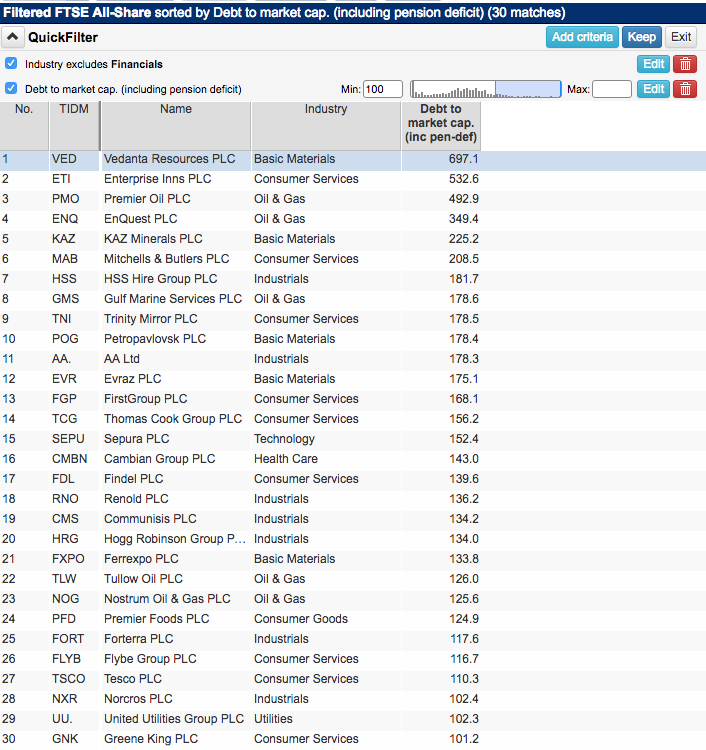
Screening for companies with high debts
Avoiding companies with lots of debts and big pension fund deficits is usually a good idea. However, if you are a spread better you might consider looking for companies with weak finances as a strategy to bet on their share prices falling, particularly if you think their trading performance will deteriorate.
Below is a list of non-financial companies with high levels of debt, including any pension fund deficit which is greater than 100% of the current market capitalisation. Financial companies naturally have a lot of debt.
Other things to consider
SharePad can help you thoroughly examine a company's debt position so that you can avoid risky companies. That said, there are other things that you might want to consider as well.
Remember that debt levels on balance sheets are based on a snapshot on one particular day. Companies tend to present their year end balance sheets when they give the most favourable picture of their financial position. Average debt levels can be a lot higher throughout the year.
One way of checking for this is to divide the cash interest paid figure in the cash flow statement with the total borrowings figure on the balance sheet. If the percentage figure is a big number - say more than 10% - then average debt levels are probably higher than year-end levels - the company has more debt than it is showing on its year end balance sheet.
Watch out for special types of creditors which are debt in all but name. For example, housebuilders can have big land creditor liabilities (land bought but not yet paid for) which can increase their debt levels.
To their credit, companies such as Barratt Developments (LSE:BDEV) and others are very up front about this and disclose their land creditor positions in their annual accounts. This figure should be added to total borrowings to get a true picture of their debts.
If you have found this article of interest, please feel free to share it with your friends and colleagues:
We welcome suggestions for future articles - please email me at analysis@sharescope.co.uk. You can also follow me on Twitter @PhilJOakley. If you'd like to know when a new article or chapter for the Step-by-Step Guide is published, send us your email address using the form at the top of the page. You don't need to be a subscriber.
This article is for educational purposes only. It is not a recommendation to buy or sell shares or other investments. Do your own research before buying or selling any investment or seek professional financial advice.

