Tutorial: New highs & lows
This tutorial looks at the different ways you can look for shares that have reached a New High or New Low. That is, shares whose latest closing price is the highest or lowest it has been for a specified period of time.
This can be a great way to identify trending stocks and breakouts of major support and resistance levels. It may also be useful for Turtle Traders using 20-day and 55-day breakouts as entry points.
New Highs/Lows can be identified for any instruments (not just shares) and for any list (such as the All list, Shares, FTSE 100, Indices, Foreign Exchange or even one of your Portfolios or a Data mining filter).
Current List Highs and Lows
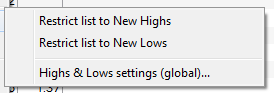
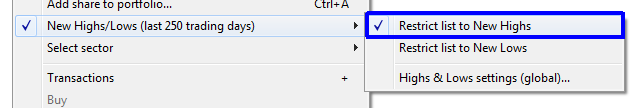
Right-click within any list screen and on the context menu you will see an option for New Highs/Lows. This option contains a sub-menu with three further options, shown below.
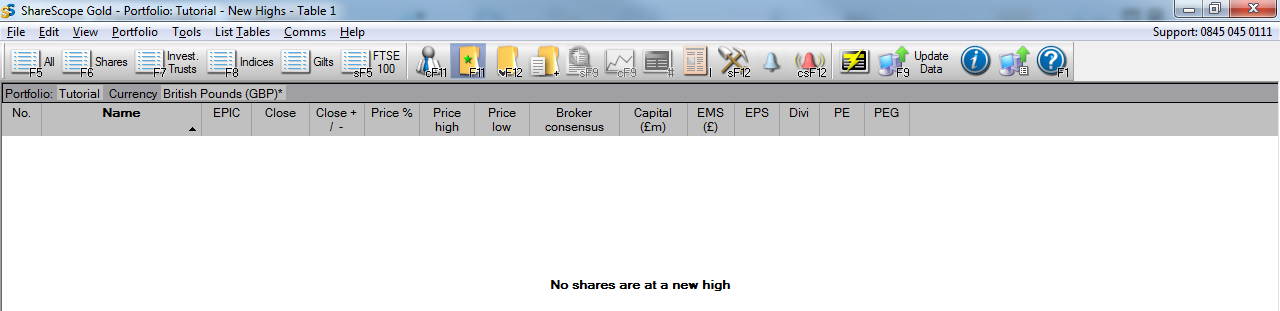
Select either of the first two options to filter the list to show just those shares that have reached either a New High or a New Low. The default look back period is the last 250 trading days (equivalent to 1 year or 52 weeks). The example below shows a list of FTSE 350 shares that have been restricted to show just those that have reached a New High.

Notice New Highs is shown on the caption bar, in ShareScope Plus and Pro this is shown on the title bar of the currently selected list.
Note: The New Highs and New Lows lists will only display a share when its closing price first reaches a new high/low. If the next day's closing price is not another new high/low (even if it is the same) then the share will no longer be displayed in the list.
When selected, the New Highs or New Lows filter will be applied to all lists (including Portfolios and Data Mining filters) until deactivated. You can see this by selecting a different list of shares, or a portfolio, where you will see a shortened list. If there aren't any shares in the list that are at a New High or New Low then the program will inform you of this where you would otherwise see a list of shares.
To remove the restriction and return to the full list, right-click in the List to display the context menu. You will notice that there is a tick next to the New Highs/Lows option. Clicking on the option on the sub-menu that has the tick next to it will remove the tick and show the full list of shares.
 As a shortcut to New Highs and Lows, use the tab key on your keyboard. Press once for New Highs, press again for New Lows and press a third time to return to the full list.
 You can also add New Highs and New Lows as buttons to one of your toolbars.
 These can be added to your toolbar via the Customise Toolbars menu. More information about how to do this can be found in Tutorial 11 - Make ShareScope your own.
As mentioned, the default time period used is 250 trading days. You may, however, prefer to use a shorter or longer time period. To change the time period used, right click in the list to display the context menu. Go to New Highs/Lows and click on Highs & Lows Settings (Global).
The following dialog will be displayed:
This allows you to change the look back period:
- The All history option uses the full price history that ShareScope has for each share.
- You can specify the preferred number of trading days - or use calendar days instead.
- Selecting Since 1st Jan (up to 1st April) looks for a new high/low since the beginning of the year. However, up until the 1st April ShareScope will measure from the beginning of the previous year due to the small amount of data available for the current year. Once April 1st is reached, ShareScope will automatically start measuring from the beginning of the current year.
- Alternatively, use the Since option to enter a specific date from which to measure. If you have added the toolbar buttons for New Highs and New Lows, press the Shift key and left click either button to access the Highs & Lows Settings (Global) dialog.
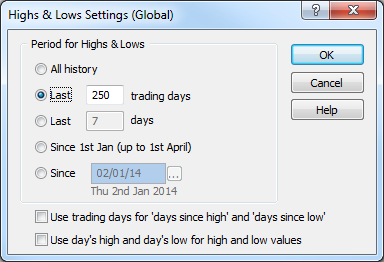
By default the New Highs and Lows options looks at Closing prices to determine if a share has made a new high or low. However, the Use day's high and day's low for high and low values option used the High and Low prices instead of the Close. Use trading days for 'days since high' and 'days since low' is used when you select Add Price High/Low Column or when you data-mine for Highs and Lows. If you tick this option then the program returns a value in trading days rather than calendar days for the number of days since a High or Low was reached.
High and Low Columns
You can add multiple columns to your List Tables using different High and Low time periods. This can be useful if Turtle Trading is part of your strategy.
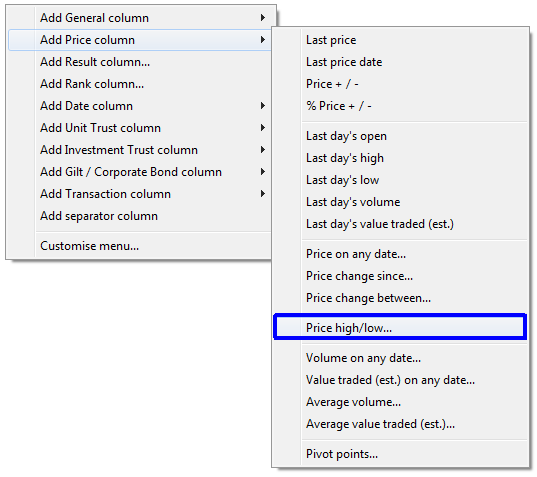
Right click on an existing column heading and go to Add Price Column, then select Price high/low.
The following dialog will be displayed:
Select either Highs or Lows. If you select Lows, the options in the Displaysection will change accordingly. Choose to display either the actual High or Low price, the date the High or Low occurred, how many calendar days there have been since the High or Low, or the % change in price since the High or Low. For the Look Back Period, use either the Global setting, or select a Custom setting for this column. Using the custom setting enables you to add multiple High and Low columns using different look back periods (as illustrated below).
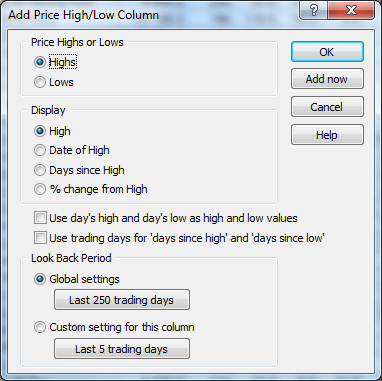
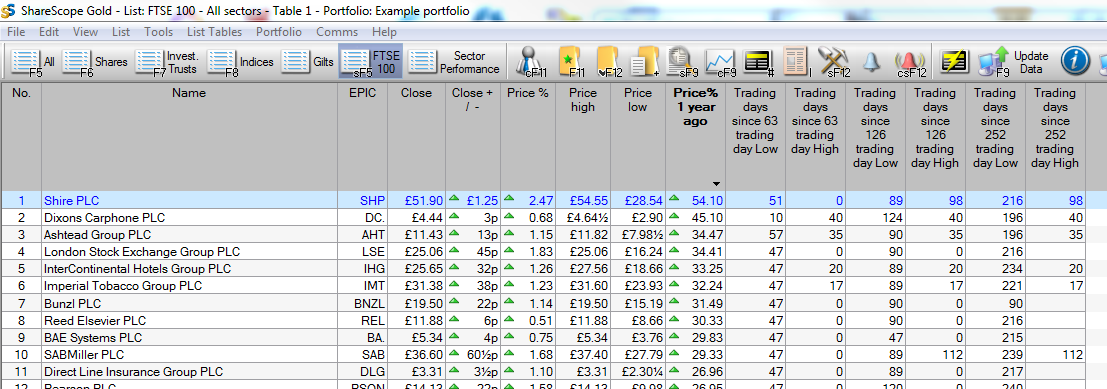
Here you can see we've used 252 trading days to represent a calendar year. We've used this figure as it divides by 12 to give a 21 trading day month. 63 trading days is 3 months and 126 trading days is 6 months.
You can sort using different columns, by double left clicking on the column heading, to help analyse the shares in more detail.
High and Low Columns
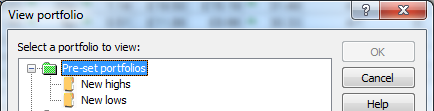
ShareScope maintains two dynamic portfolios: New Highs and New Lows. You can open these via the Select Portfolio button (or F12). They reside in the Preset portfolios folder.
During the daily update, each portfolio is updated to include all instruments that have recorded a new high (or low) that day. The look-back period used is the same one set in the Highs & Lows Settings (Global) dialog. These portfolios use the All list as their basis, so any instruments in ShareScope that have reached a New High or New Low will be included in these portfolios.
Note: unlike the New High/Low filters applied to a List, these portfolios will include instruments that have been at their New High or New Low price for more than one day. Small cap stocks, for example, may remain at the same price for days or weeks on end.
Remember, if you have any trouble finding or using any of these features, please don't hesitate to contact our Customer Support team. They will be delighted to help.

