Stock Watch: Stagecoach Group
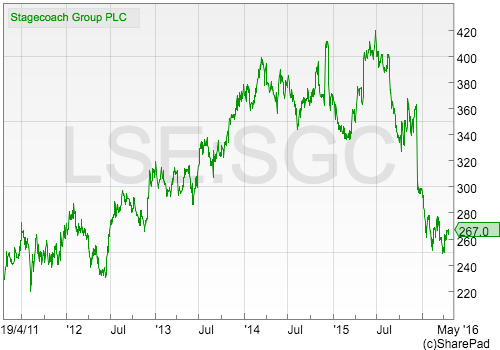
Shares of bus and rail operator Stagecoach (LSE:SGC) have had a dramatic fall from grace in recent months. From being seen as one of the transport sector's most dependable companies it seems that it has run into a wall of worry about its future prospects. The shares have lost around a third of their value during the last year.
Sometimes stock markets can make mountains out of molehills by overreacting to temporary blips in a company's fortunes. So I've decided to open up SharePad and take a closer look at Stagecoach to try and find out what's been going on.
Want to learn how to analyse shares like a professional? Download our FREE guide.
Sign-up to our mailing list to receive a PDF of our Step-by-Step Guide to Investing.
Share this article with your friends and colleagues:
Turnover and profit history
The chart below shows that Stagecoach has been a steady performer. Turnover growth has been very reasonable over the last decade. In recent years, a large chunk of this growth has come from winning new rail franchises in the UK. These tend to come with lots of turnover but have modest profit margins and therefore bring in a modest amount of additional profit.

The company has also had a lot of success with its regional (outside London) bus companies in the UK where profits growth has been good. It has also been investing in a low cost bus service called megabus.com in the UK, USA and continental Europe.
Financial returns
Rail companies in the UK don't tend to own their trains and carriages. These are leased (rented) from specialist rolling stock companies and are returned at the end of the franchise term. This means that companies such as Stagecoach have a lot of hidden or off-balance sheet debt which needs to be taken into account when looking at its financial performance.

In the year to April 2015, Stagecoach had rental and lease expenses of £207.7m. Capitalising these at a multiple of 7 (see How to analyse companies with hidden debts for more on this important topic) gives an estimate of hidden debt of £1454m.
This number will probably go up again in the year to 2016 when a full year of the East Coast rail franchise is included. The good news for shareholders is that most of these hidden debts would disappear if it no longer owned its rail franchises - the profits from them and the liabilities are matched against each other.
Even when these large hidden debts are taken into account, Stagecoach has been able to produce some decent returns on the money it has invested. ROCE was 12.9% in 2015 compared to a ten year average of 13.5%. Free cash flow returns as measured by CROCI were 9.7% compared with a ten year average of 12.8%. These numbers suggest that we are looking at a fairly decent company here.

If we break down the company's ROCE a little further, we can see that it has been relatively stable although it has been trending down a little in recent years. Profit margins (the first/red bars) have fallen a bit as more of the company's turnover has come from lower margin rail activities. The capital turnover has edged up slightly as rail franchises tend to have higher turnover per £1 invested than bus companies.
Free cash flow
Stagecoach consistently produces free cash flow for its shareholders which is an encouraging sign. The amount of free cash flow is significantly less than it was in the latter half of the last decade when the company was spending very little on new assets (capex). Free cash flow has been relatively stable at around the £100m mark in recent years.

The black line in the chart below highlights the low capex spending (relative to depreciation) in 2007 and 2008. This led to free cash flow per share being significantly higher than earnings per share (EPS) in those years.
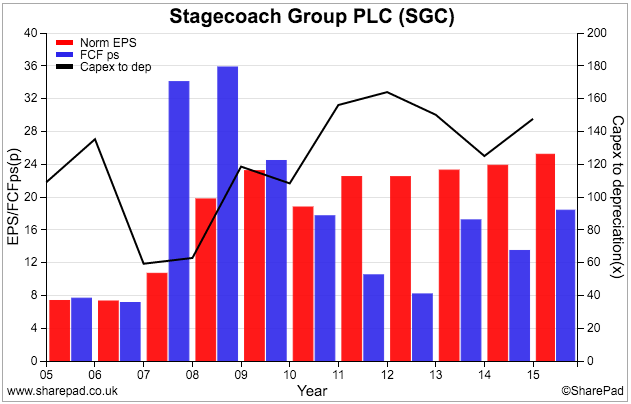
Since then, capex spending has been comfortably higher than depreciation which has resulted in free cash flow per share (the second/blue bars) lagging EPS. It is worth noting that free cash flow for rail companies can be quite lumpy. At the beginning of the franchise there tends to be an inflow of cash from season ticket balances which boost free cash flow (even though the cash has not been earned yet) with the reverse happening when the franchises end and season ticket cash balances are transferred to the new owner.
Stagecoach's free cash flow performance has comfortably covered its dividend payments to shareholders. This has enabled the company to deliver strong rates of dividend growth in recent years.

Since 2005, Stagecoach's annual dividend has increased more than threefold from 3.4p per share to 10.5p.

Financial strength
The company's finances look to be in a reasonable state. Total borrowing levels have remained fairly stable for the last few years.

As bus and rail companies employ a lot of people (drivers and support staff) it is not too surprising to see a deficit in the final salary pension scheme (the liability to pay pensions to current and past employees is bigger than the pot of money in the fund) but this does not look as if it is going to cause any problems at the moment.
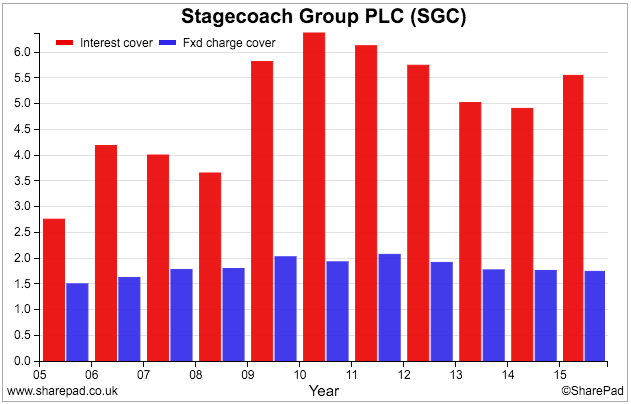
Interest cover is fairly comfortable at over five times. Fixed charge cover which takes into account the high level of rental expenses was 1.7 in 2015 and has been trending lower. The level of fixed charge cover is reasonable but investors probably wouldn't want to see it much lower than 1.5.
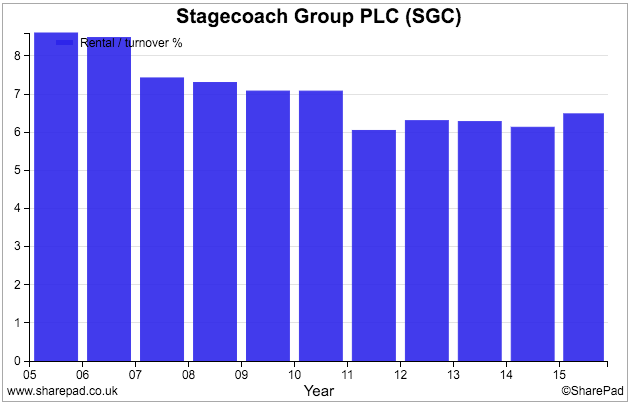
Even though rental payments have been rising in recent years, they have been eating up a lower proportion of turnover as the chart below shows.
Valuation & future prospects
The sharp fall in its share price has seen the valuation of Stagecoach shares come down to quite low levels. The shares trade on a forecast PE of 9.4 times and offer a prospective dividend yield of 4.4%. A lease-adjusted EBIT yield of 9.3% is much higher than its peer group and suggests that investors have become quite pessimistic about Stagecoach's future prospects.
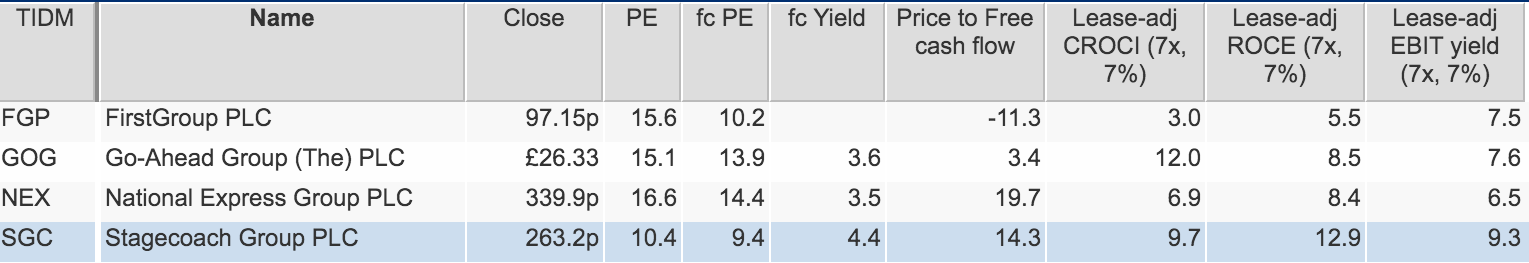
This pessimism is shown in the table below which looks at City analysts' forecasts.
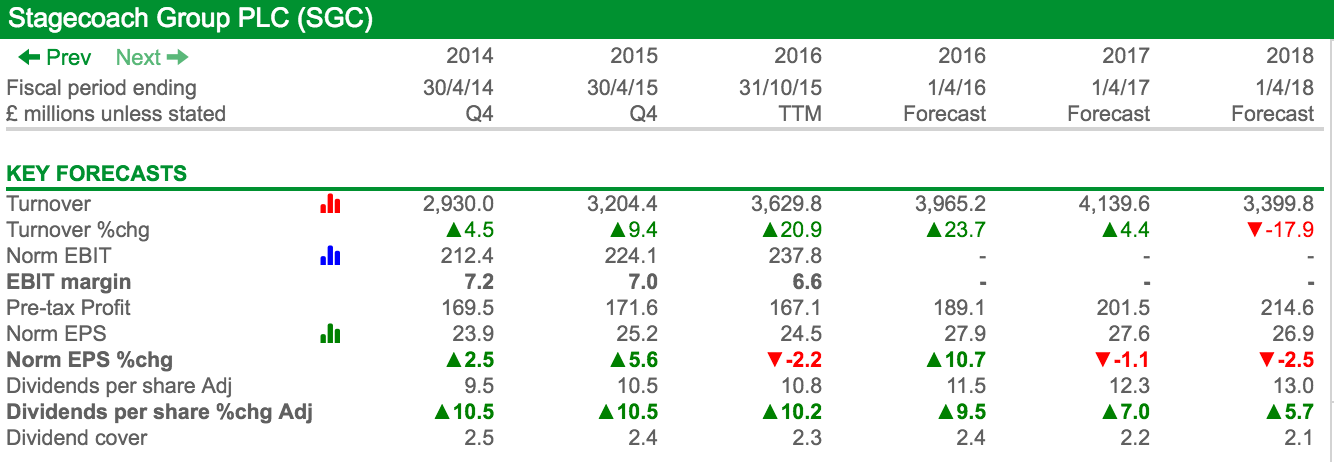
Whilst the company should deliver a reasonable rate of EPS growth for the year to April 2016, this is mainly due to a full year's profit contribution from the East Coast rail franchise which contributed very little to profits in 2015 (the franchise only started in March 2015 compared with an April year end). No growth in EPS is expected for the following two years although dividend growth is still expected to be reasonable.
What is concerning professional investors is that Stagecoach's growth rate of revenues has been slowing down.
| LFL sales growth (%) | 40 weeks | 26 weeks | 14 weeks |
|---|---|---|---|
| UK Regional Bus | 0.7 | 1 | 0.1 |
| UK London Bus | 1.3 | 1.4 | 1.1 |
| UK Rail | 4.6 | 6 | 2 |
| North America | -4.4 | -6.6 | -0.3 |
| Virgin Rail Group | 6.6 | 9.1 | 2 |
LFL = Like for like
The company released a trading update in early March which gave the rates of like-for-like sales growth for each of businesses for the first 40 weeks of its financial year. These can be compared with the growth rates given for the half year (26 weeks) in December 2015.
With the exception of the North American bus business, the trend of revenue growth has been getting worse. By comparing the differences between trading updates it is possible for you to work out the most recent rate of growth - in this case, the last 14 weeks - using some very simple maths. This is a very useful exercise that can be applied to lots of different companies and can often be very revealing.
Let me show you how to do this:
| LFL sales growth | 40 weeks | 26 weeks | 14 weeks | Implied LFL |
|---|---|---|---|---|
| UK Regional Bus | 28 | 26 | 2 | 0.1 |
| UK London Bus | 52 | 36.4 | 15.6 | 1.1 |
| UK Rail | 184 | 156 | 28 | 2 |
| North America | -176 | -171.6 | -4.4 | -0.3 |
| Virgin Rail Group | 264 | 236.6 | 27.4 | 2 |
We will use the UK regional bus business as an example. Start with the most recent trading period of 40 weeks and multiply it by the growth rate of 0.7% to get 28 (40 x 0.7). Then take the 26 week growth rate and repeat the process (26 x 1) to get 26. Take away 26 from 28 to leave you with 2. Now divide this by 14 (the number of weeks between 26 and 40) to get the current rate of growth of 0.14% (2/14).
We can see that the UK bus and UK rail businesses (including Virgin Rail Group) have seen a significant slowdown in revenue growth. The UK regional bus business is barely growing at all.
This business is facing a number of short-term challenges. Concessionary revenues (money paid to bus companies to carry people such as pensioners for free) are not growing much as central and local governments look to reduce costs. Bus companies are now questioning whether they are being paid enough money for this service which makes up around a quarter of total bus revenue. Road congestion in urban areas and falling petrol prices have also lowered the attractiveness of bus travel for some users.
Elsewhere, the company is putting a lot of money into launching new European routes for megabus.com which will reduce profits by around £20m this year. Longer term, though, this value for money service could produce some reasonable sales and profits growth for the company both in Europe and the USA, despite the cost of driving coming down due to lower petrol costs.
Lower fuel costs for the bus fleets this year and next should offset some of these issues.
Rail is where investors are probably concerned the most. Three of the company's rail franchises end in the next couple of years (South West Trains in 2017, East Midlands Trains in 2018 and Virgin West Coast in 2018). Whilst incumbent operators are well placed to retain franchises whether they can make the same amount of money from them in the future as they have in the past cannot be taken for granted.
Competition for lucrative London commuter routes and inter-City franchises is fierce. The potential profits from these franchises means that in order to win a franchise, a bidder has to promise to make large annual payments back to the government.
Sometimes - as was the case with National Express's and the East Coast franchise in 2009 - these franchises can go badly wrong. National Express took over the East Coast franchise in 2007 with promises to pay the government £1.3bn in premiums for the privilege over 10 years. When the recession hit in 2009, the franchise wasn't making enough to make good on these payments and the whole company's future was placed in jeopardy.
Thankfully, Stagecoach is not in the same position as National Express was. Even though it has promised to pay £2.3bn over 8 years to run the East Coast franchise, the company's finances are much more prudent. The franchise contract also gives a degree of protection to revenues in the event of a big recession as the government has agreed to share some of the pain of any shortfall between actual and expected results.
However, there are some analysts who are concerned that a slowdown in revenue growth at East Coast could see future profits come in much lower than was expected and make the company less valuable. Because the franchise payments have to be made, any slowdown in revenue made against the expected budget can see a sharp fall in expected profits.
It looks as if this worry could be the main reason behind Stagecoach's recent share price drop. The value of the company has fallen by nearly £900m since last June. Maybe Stagecoach shares were too highly valued back then - although a forward PE of 15 would not be considered outrageous by many investors - but if they were not then the drop could have priced in a lot of potential trouble ahead.
To sum up
- Stagecoach has been a very dependable business during the last decade.
- Despite having large amounts of hidden debts from its rail franchises, ROCE and CROCI numbers have been respectable and consistent.
- Free cash flow generation has allowed the company to significantly increase dividend payments to shareholders.
- The financial position of the company is reasonably comfortable, although fixed charge cover is probably low enough for comfort.
- Revenue growth has slowed sharply in recent years.
- Earnings growth may be hard to achieve in 2017 and 2018.
- The East Coast rail franchise has the potential to reduce future profits growth.
- The valuation of the shares has fallen significantly since June 2015 with the company having a much lower valuation than its peers.
If you have found this article of interest, please feel free to share it with your friends and colleagues:
We welcome suggestions for future articles - please email me at analysis@sharescope.co.uk. You can also follow me on Twitter @PhilJOakley. If you'd like to know when a new article or chapter for the Step-by-Step Guide is published, send us your email address using the form at the top of the page. You don't need to be a subscriber.
This article is for educational purposes only. It is not a recommendation to buy or sell shares or other investments. Do your own research before buying or selling any investment or seek professional financial advice.

