The risks of buying and holding high PE shares and how you can calculate an entry price
There are two ways to make money from owning shares. The slow and steady way is to buy shares that pay good dividends, reinvest those dividends to buy more shares and then hold on to them for as long as you can (read my article on dividend investing).
The other way is to buy a share and hope it goes up in price. This is known as investing for capital appreciation and is a strategy used by lots of investors. Many of us are looking for those shares that have the potential to make us multiples of the money that we invest in them. Peter Lynch, a famous American investor, used to look for potential "ten-baggers" shares where the price could increase tenfold or even more.
Want to learn how to analyse shares like a professional? Download our FREE guide.
Sign-up to our mailing list to receive a PDF of our Step-by-Step Guide to Investing.
Basic stock market maths
However, it is useful to consider why shares go up in price in the first place. This can happen when a company is taken over and is bought by another company. In most cases though, share prices rise over time for two main reasons:
- Growth in a company's profits or earnings.
- An increase in the valuation the stock market puts on those profits - the valuation multiple - such as the price to earnings or PE ratio.
If you can buy a share where both these events can happen then you could be on to a winner. Let's say you buy a share in a company for 100p when its earnings per share (EPS) is 10p (the share has a price to earnings or PE ratio of 10 times - 100/10). Over the next five years, the EPS doubles to 20p but the stock market values the shares at 20 times earnings (a PE of 20) or 400p each (20p x PE of 20). You feel great having made four times the money you invested in it.
If the shares had still traded at a PE of 10 times they would only have doubled in price to 200p (20p EPS x PE of 10). In this case, the stock market has given you a helping hand by assigning a higher PE ratio to the shares. However, what stock market history tells us is that it's a lot harder for shares on PEs of 20 to deliver big gains than it is for cheaper shares with lower PEs.
What it also tells us is that PE ratios can and do go down as well as up. This is known as PE multiple compression and it can have a devastating effect on the price of shares with high PE ratios. Unlike dividends - which once paid cannot be taken away - share price gains can disappear very quickly in a bear market and take years to get back, if at all.
That's not to say that buying and owning shares with high PEs cannot make you money. They often do as long as their profits keep on growing strongly. But the high price - as evidenced by the high PE - can make these shares very risky if profit growth slows or stops, or if the stock market enters a bear market and PE ratios in general fall.
High PE stocks in the UK market
I'm not going to get into the nitty gritty of how PE ratios are determined in this article except to say that they are largely determined by the outlook for profit growth, the riskiness of the shares concerned and the general level of interest rates (high interest rates tend to give low PE ratios, low rates give high PE ratios).
What we have seen since the stock market bottomed back in March 2009 is that many high quality companies with a good track record of growing profits have seen the PE ratios on their shares continue to go up.
But will they continue to go up and will their profits keep on growing? Maybe, maybe not. If you own a share with a high PE ratio, or are thinking of buying one, it is worthwhile taking the time to consider what has driven its share price over the last few years.
Has the share price changed mainly because profits have changed? Or is it because of changes in the PE ratio?
This is important. If profits have been the main driver of the share price then that might mean the share is less risky if profits can keep on growing and the PE ratio isn't too high. If the bulk of the price change is due to a change in PE ratio and profits growth has been sluggish then the shares might be more risky if profits start to decline and PE ratios fall.
I've asked ShareScope to find shares in the FTSE 100 with high forecast PE ratios. What I've then done is look at what has happened to their share prices, EPS and PE ratios over the last six years (since the stock market bottomed) and what EPS growth is expected in the future.
I've taken six popular shares from the FTSE 100 and the data from ShareScope is shown in the table below.
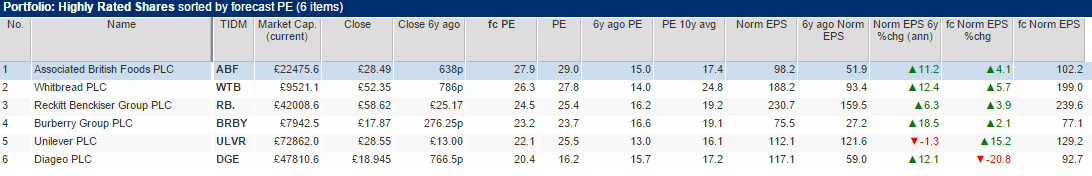
You can create the same table in ShareScope.
Once you have filtered the list of FTSE 100 shares, you can create a portfolio in ShareScope and then add results columns to the table. Don't worry about the amount of data fields I've included, hopefully you will see why I've included them in a short while.
What you can see is that all six shares have posted big gains in their share prices over the last six years and now trade on high forecast PEs. By looking at the changes in their PEs and EPS you can begin to understand what has caused their previous share price rise which can help you decide whether to buy or sell a share or hold on to it.
Let's have a look at what's been going on with these six companies.
What if the PE ratios had remained the same?
I've used a spreadsheet to calculate some numbers but a pen and paper and a calculator is all you need.
I've taken the forecast EPS estimate for each company from ShareScope and multiplied it by the PE ratio of the shares 6 years ago to get the implied share price today if the PE ratio was unchanged. This gives the change in the share price due to changes in profits/EPS. So for Whitbread, its share price has increased by 2000p due to its profit growth.
| Fc EPS(p) | 6y ago PE | Implied Price(p) | Price 6y ago(p) | Change(p) | |
|---|---|---|---|---|---|
| Associated British Foods | 102.2 | 15 | 1,533 | 638 | 895 |
| Whitbread | 199 | 14 | 2,786 | 786 | 2,000 |
| Reckitt Benckiser Group | 239.6 | 16.2 | 3,881 | 2517 | 1,365 |
| Burberry Group | 77.1 | 16.6 | 1,280 | 276 | 1,004 |
| Unilever | 129.2 | 13 | 1,680 | 1300 | 380 |
| Diageo | 92.7 | 15.7 | 1,455 | 766 | 689 |
Once you know the change in the share price due to earnings growth, you take that number away from the total change in share price to give you the change which is explained by the PE ratio.
| Price | Price 6y ago(p) | Change in price | EPS growth | PE change | EPS % | PE% | |
|---|---|---|---|---|---|---|---|
| Associated British Foods | 2,849 | 638 | 2,211 | 895 | 1,316 | 40.50% | 59.50% |
| Whitbread | 5,235 | 786 | 4,449 | 2,000 | 2,449 | 45.00% | 55.00% |
| Reckitt Benckiser Group | 5,862 | 2517 | 3,345 | 1,365 | 1,980 | 40.80% | 59.20% |
| Burberry Group | 1,787 | 276 | 1,511 | 1,004 | 507 | 66.40% | 33.60% |
| Unilever | 2,855 | 1300 | 1,555 | 380 | 1175 | 24.40% | 75.60% |
| Diageo | 1,894 | 766 | 1,128 | 689 | 439 | 61.10% | 38.90% |
So Whitbread's share price gains can be explained 45% by its earnings growth and 55% by the increase in its PE ratio. For Unilever, just over 75% of its share price increase is explained by a higher PE ratio. For Burberry, 66% of its gain is due to earnings growth.
What happens in the future is anyone's guess. But all these shares now trade on what most people would acknowledge are high PE ratios. These PE ratios could keep on rising but they are unlikely to expand by as much in the next 6 years as they have in the past 6 years. Therefore it may not be wise to count on the stock market giving these shares as big a boost in the future as it has in the past. The ability of these companies to grow their profits will be much more important going forward.
Working out your risks
Investing is just as much about managing the risks you are taking with your money as it is about finding the next winning share for your portfolio. With high PE shares the risks can be very high but as I mentioned earlier there are two main ones that spring to mind:
- Can profits keep on growing?
- The risk of falling PE ratios
As far as future profit growth is concerned, we can use the analysts' estimates that are available in ShareScope to see what is expected. I'll let you draw your own conclusions as analysts forecasts aren't always worth a great deal but only Unilever with expected EPS growth of 15% looks like growing strongly. Diageo's profits are expected to shrink by 20%.
What about the risk of falling PE ratios?
It's fairly easy to work out what would happen if PE ratios started to decline.
If PE ratios were to return to 2009 levels and applied to forecast EPS then these high PE shares could see their share prices fall significantly as shown in the table below:
| Forecast EPS(p) | 6y ago PE | Implied Share price(p) | Current price | Difference | |
|---|---|---|---|---|---|
| Associated British Foods | 102.2 | 15 | 1533 | 2,849 | -46.20% |
| Whitbread | 199 | 14 | 2786 | 5,235 | -46.80% |
| Reckitt Benckiser Group | 239.6 | 16.2 | 3881 | 5,862 | -33.80% |
| Burberry Group | 77.1 | 16.6 | 1280 | 1,787 | -28.40% |
| Unilever | 129.2 | 13 | 1680 | 2,855 | -41.10% |
| Diageo | 92.7 | 15.7 | 1455 | 1,894 | -23.20% |
Alternatively, you could apply the ten year average PE from ShareScope to forecast EPS.
| Forecast EPS(p) | 10y avg PE | Implied Share price(p) | Current price(p) | Difference | |
|---|---|---|---|---|---|
| Associated British Foods | 102.2 | 17.4 | 1778 | 2,849 | -37.60% |
| Whitbread | 199 | 24.8 | 4935 | 5,235 | -5.70% |
| Reckitt Benckiser Group | 239.6 | 19.2 | 4600 | 5,862 | -21.50% |
| Burberry Group | 77.1 | 19.1 | 1473 | 1,787 | -17.60% |
| Unilever | 129.2 | 16.1 | 2080 | 2,855 | -27.10% |
| Diageo | 92.7 | 17.2 | 1594 | 1,894 | -15.80% |
Here, the predicted downside is less.
As always, do your own research when looking at potential shares to invest in. Being a good investor is a lot about thinking about risks and what might happen in the future and ShareScope can help you with this. Investors in some high PE shares may continue to do well but by looking at what has explained a share price in the past you can make more informed decisions before parting with your money.
Possible shares to consider
Avoiding losses and thinking about risks is something that every investor should think about. But what about using the kind of analysis I've been talking about to try and find shares that might have better prospects ' where the PE ratio and EPS could go up.
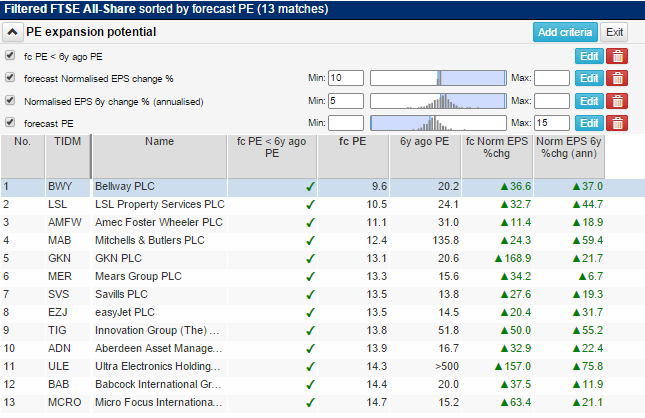
What you can do in ShareScope is look for shares where the forecast PE is less than the PE of 6 years ago. In others words it looks as if the stock market doesn't like them as much as it used to but the market has gone up a lot in the meantime. Perhaps these are shares that might have been left behind?
You can add whatever criteria you like to your filter. This is what I've asked ShareScope to look for:
- A forecast PE less than the PE of six years ago.
- Annualised EPS growth of at least 5% during the last 6 years.
- A forecast PE of less than 15.
- Forecast EPS growth of at least 10%
The 13 shares listed are not shares you should go out and buy without doing more research on. Hopefully though, you will see the immense flexibility that ShareScope and ShareScope have in helping you look for good investments.
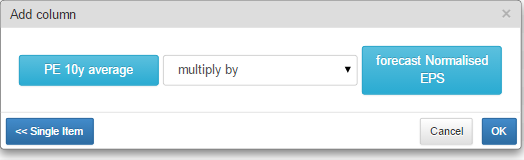
Setting a target price based on PE ratios
You can ask ShareScope to calculate a target price for you based on the average PE over a period of years or a PE up to 10 years ago.
There's a very handy feature in ShareScope that allows you to create a column that combines data fields. This allows the users to configure almost endless combinations of ratios and financial data to help them answer lots of questions about a company and its valuation.
Taking the list of 13 companies above, I've asked ShareScope to take the 10 year average PE ratio (where it can be calculated) and to multiply it by the forecast EPS. This will give me a share price based on the 10 year average PE which can be compared with the current share price.
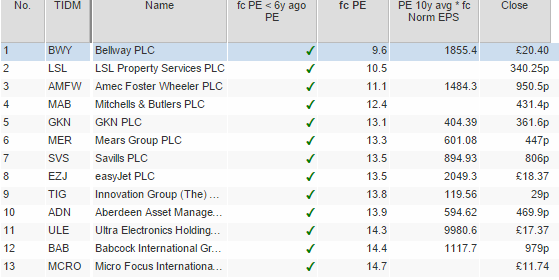
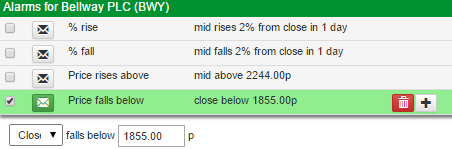
Let's say you were interested in the shares of Bellway. Its shares are currently trading above its 10 year average PE, but you can set an alarm in ShareScope to tell you when the price falls below 1855p. ShareScope will even send you an email when Bellway reaches the target price.
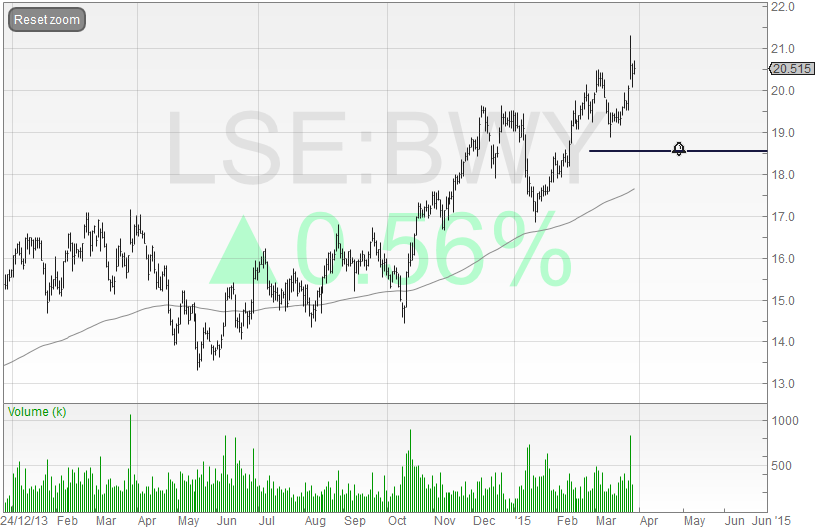
For a more visual reminder, you can draw a line on Bellway's share price chart at 1855p and set a line alarm to tell you when the price has been reached.
Phil Oakley

