Stock Watch: What's next for Next?
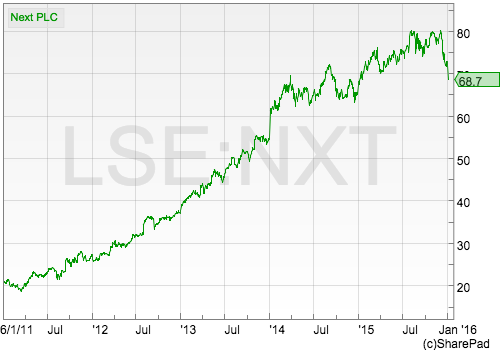
UK retailer Next (LSE:NXT) has been a great share to own in recent years. Whilst many high street shops have struggled, Next has prospered and so have its investors.
Anyone buying the shares back in January 2010 and still holding on to them now will have earned a total return on their investment - share price growth plus dividends received - of close to 300% (see table below). Profits growth and the clever use of share buybacks has seen earnings per share more than double whilst growing dividends have been topped up with some large one-off, special dividends as well.
| Year | 2010 | 2011 | 2012 | 2013 | 2014 | 2015 | 2016 |
|---|---|---|---|---|---|---|---|
| Period Ending | 30/01/2010 | 29/01/2011 | 28/01/2012 | 26/01/2013 | 25/01/2014 | 24/01/2015 | 01/01/2016 |
| Result Type | Q4 | Q4 | Q4 | Q4 | Q4 | Q4 | Forecast |
| Year end share price | 19.66 | 19.77 | 26.19 | 40.58 | 62.5 | 68.6 | 68.6 |
| PE | 10.26 | 9.1 | 10.27 | 14.15 | 17.1 | 16.63 | 15.53 |
| Norm EPS | 191.67 | 217.26 | 255.02 | 286.82 | 365.57 | 412.61 | 441.6 |
| Dividends per share Adj | 66 | 78 | 90 | 105 | 129 | 150 | 395.1 |
How shareholders have made money | £ | % | |||||
| Change in share price | 48.94 | 248.90% | |||||
| Change due to EPS growth | 25.64 | 130.40% | |||||
| Change due to higher PE | 23.3 | 118.50% | |||||
| Dividends received | 8.62 | ||||||
| Total Return | 57.56 | ||||||
| Total return % | 292.80% | ||||||
| from share price change | 248.90% | ||||||
| From dividends | 43.80% |
Opening up SharePad and looking at some key numbers, it's not difficult to see why Next has been a firm stock market favourite.
Want to learn how to analyse shares like a professional? Download our FREE guide.
Sign-up to our mailing list to receive a PDF of our Step-by-Step Guide to Investing.
Share this article with your friends and colleagues:
A closer look at Next's financial performance
To do some meaningful analysis on retail companies you have to take into account that many of them rent (or lease) rather than own their shops. This means that they are not listed as assets on a company's balance sheet (they are on a property company's who owns them) whilst the agreement to pay rents in the future is a form of hidden debt. To learn more on this topic read my article How to analyse companies with hidden debt.
What this means in practice is that you have to adjust key financial ratios such as return on capital employed (ROCE) for these hidden debts. If you don't include an estimated value of hidden debts, then you might mistakenly think that a company is better or safer than it really is. SharePad can do all these adjustments for you in seconds.
The good news for investors in Next is that even when leases are taken into account this is a company that has scrubbed up really well.
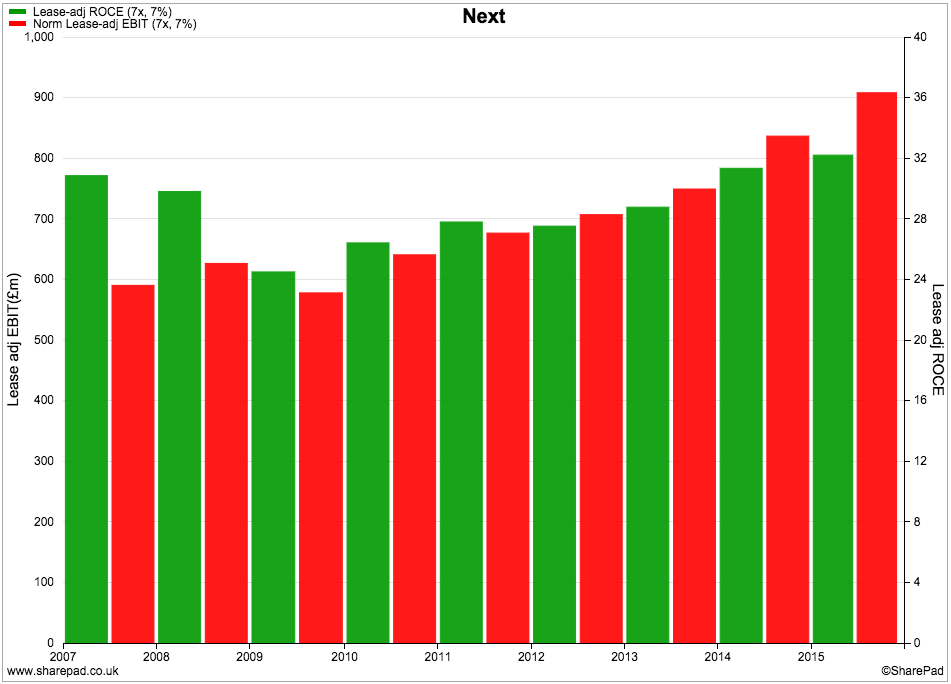
Next has made consistently good returns on investment (ROCE) for years as shown by the green or first bar in the chart above. Both ROCE and profits (the red or second bar) have been on an upwards trend during the last few years and were remarkably resilient during the UK recession of 2008-09.
Lease-adjusted ROCE in the year to January 2015 was an impressive 32%. You won't find many retailers that can do that.
The other classic hallmark of a high quality business is an ability to produce lots of free cash flow. Next passes this test with flying colours with free cash flow per share being consistently close to EPS - a sign of high quality profits.
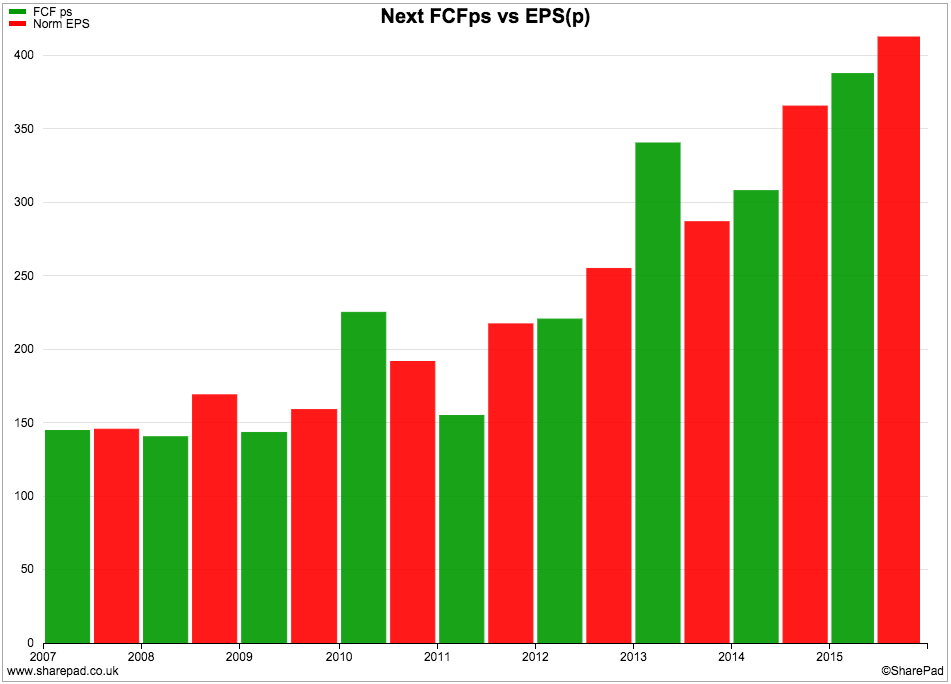
A company's free cash flow is often less than its reported profits because it is investing (in stocks of goods and new shops for example) to grow the business in the future. However, cash flow is the lifeblood of a business and investors should pay very close attention to it. It's also a lot harder to fudge than profits over the long haul.
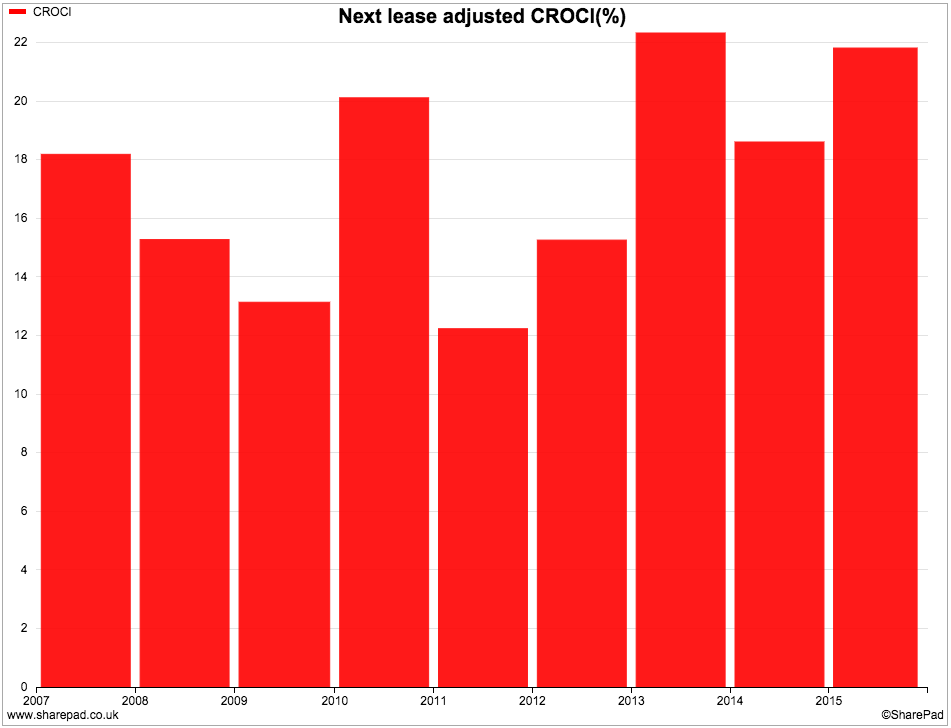
These days I spend a lot more time looking at a company's free cash flow return on the money it has invested (CROCI) than ROCE. I want to see a consistent ability to generate high cash returns.
I've used SharePad to estimate a lease-adjusted CROCI (using the combined items feature) for Next.
If you take a look at the chart below you can see that Next has been able to produce some good cash returns ranging from a low of around 12% in 2011 to around 22% in 2013 and 2015 - all very reassuring stuff.
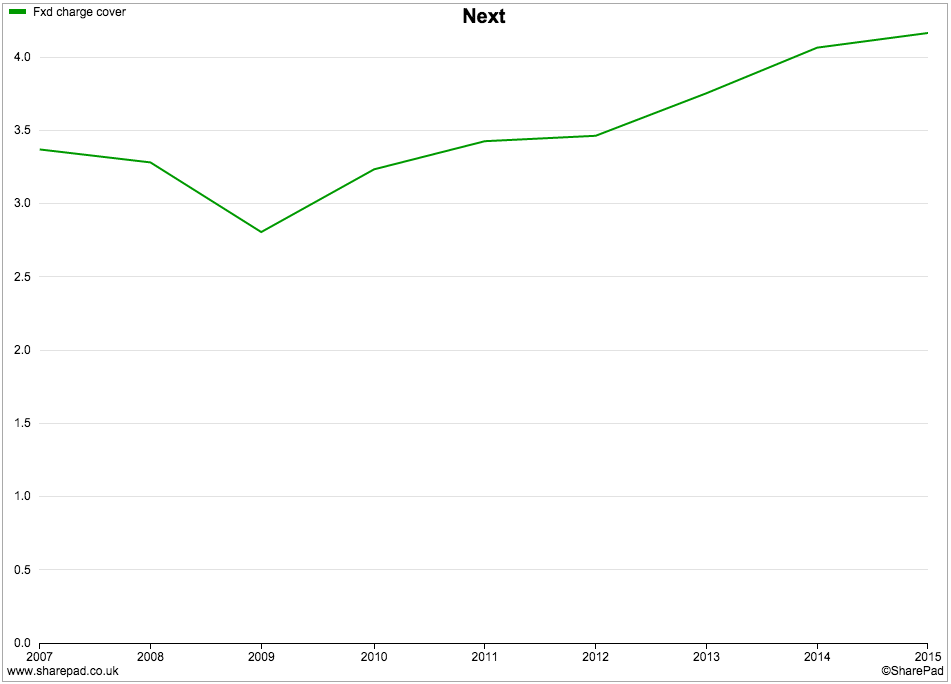
The other ratio that you should never forget to look at when analysing a retailer is its fixed charge cover. This tells you how comfortably a company's trading profits (or EBIT) can cover the interest payments on its debt and the rents on its leased assets.
Some retailers can have fixed charge cover ratios of 1.5 or less which could see them get into financial difficulties if profits fall. Equally important is the trend in the ratio. A fixed charge cover ratio that is falling is often an early warning sign of a company that may be overextending itself.
Next has one of the healthiest fixed charge covers out there. The ratio was over 4 times in 2015 showing that the company's finances are in a very healthy state and could cope with a substantial fall in profits. The trend has also been upwards which is a very good sign.
How does Next stack up against other retailers?
Very well it seems. If we compare it with its rival Marks & Spencer you can see that Next trounces it in terms of ROCE and fixed charge cover. In fact, very few companies come anywhere close to its stunning financial returns.
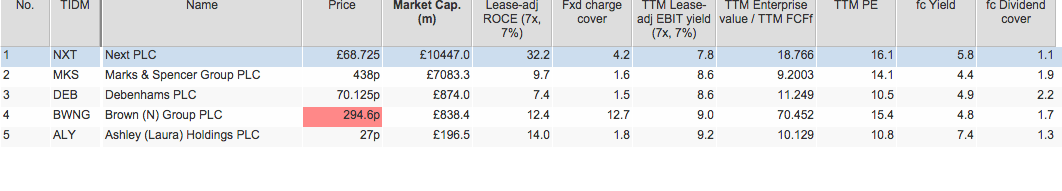
Usually you have to pay a bit more for quality and this is the case with Next. If you look at valuation measures such as EBIT yield or PE ratios, Next is more expensive than its less impressive peers.
But are Next shares too expensive? The answer to this question largely depends on whether Next can keep churning out impressive financial results.
What's going on at the moment?
UK high street retailers have been under a cloud for some time. Clothing retailers such as Next even more so as people have been worrying that the warm winter weather will have meant that people won't have bought this year's fashions.
Well it seems that Next has hit a bit of a rocky patch but is still doing reasonably well - just not as well as City analysts and investors thought it might do. That said, all these worries have weighed on the company's share price which touched £80 at the end of October and is less than £70 at the time of writing.
Next's recent trading statement said that things had been a bit subdued during the six weeks leading up to Christmas Eve. Underlying sales were slighty lower than last year if new shops are excluded, whilst sales through its Next Directory business only grew by 2%. It blamed the warm weather, increasing competition for Next Directory from rivals and a few problems in getting enough of the right products to sell.
Yet Next has cushioned itself well. It never sells items on sale until after Christmas and has been able to maintain its profit margins. In fact, profits look like holding up reasonably well if you read the trading statement in SharePad:
FULL PRICE SALES, PROFIT AND EPS GUIDANCE FOR THE FULL YEAR
"Full price sales for the year to date are currently +3.7% ahead of last year, just below the bottom end of our previous guidance of +4.0% to +6.0%. However, good control of margins, costs and stock, along with healthy clearance rates means that we expect profits for the full year to remain within our profit guidance of GBP810m to GBP845m, issued in October".
"Our revised central forecast for full year Group Profit is now GBP817m, though this might increase or decrease by GBP7m depending on trade in January. GBP817m would represent an increase of +4.4% on last year. The table below sets out our central guidance for total shareholder returns for the full year to January 2016."
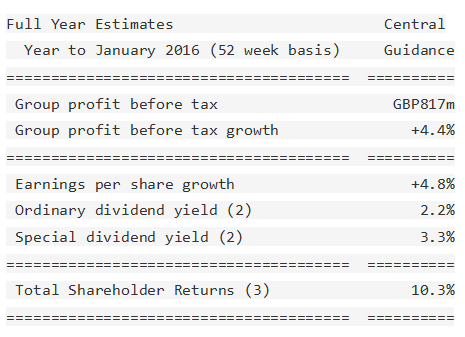
"The guidance in the table above is based on 52 weeks for the years ending January 2015 and 2016. The current financial year will actually be the 53 weeks to 30 January 2016 and we estimate the additional week will add GBP15m to profit before tax."
What about next year's profits? Building your own simple forecast
Share prices are based on expectations of future profits. Profits for the year to January 2016 are all but known give or take a few million pounds. Professional investors will be more concerned about what is likely to happen for the year to January 2017.
Next has been very helping in giving some very useful guidance. Its trading statements are packed full of comments that helps investors to make their own profit forecast. I am going to show you how I have used the information in the trading statement to make a very simple profit forecast for Next.
| Next plc simple profit forecast (£m) | 2016 | 2017F with 1% sales growth | 2017F with 6% sales growth |
|---|---|---|---|
| 2016 company Forecast | 817 | ||
| Less £7m for weaker trading | -7 | ||
| Effect of 53rd week in 2016 | -15 | ||
| Starting PBT for 2017 forecast | 795 | 802.95 | 842.7 |
| Tax at 20% | -160.59 | -168.54 | |
| Profit for shareholders | 642.36 | 674.16 | |
| Number of shares (million) | 152.9 | 152.9 | |
| EPS(p) | 420.1 | 440.9 | |
| PE at share price of £68.60 | 16.33 | 15.56 |
Key points in building the forecast:
- The company's central profit before tax (PBT) forecast for 2016 is £817m.
- This could be £7m higher or lower depending on how good or bad trading is in January.
- 2016 profits will be boosted by a 53rd week of trading which will add £15m to PBT (highlighted in yellow above).
- Erring on the side of caution and assuming a weaker January trading period and taking away the £15m boost from the 53rd week gives a 52 week profit for 2016 of £795m. This is the starting number for our 2017 forecast.
- Next has given a wide range of expected sales growth of between 1% and 6% and says that profits will grow in line with sales growth.
- This gives a range of PBT forecasts of between £803m and £842.7m.
- Assuming a tax rate of 20% on PBT gives a range of EPS estimates of between 420.1p and 440.9p for the 52 weeks to January 2017.
If we compare this forecast with the trailing twelve month (TTM) EPS of 426p in SharePad then it seems that earnings growth at Next could be very modest indeed in 2017 and might even decline.
Next also says that it expects to have £370m or 242p per share of surplus cash in 2017 (after capital expenditure, interest, tax and ordinary dividends have been paid for). This could mean more special dividends.
If the ordinary dividend stays the same at around 159p, then total dividends could be 401p giving a forecast dividend yield on the shares of 5.8% based on a share price of 6860p.
Next sets an 8% hurdle rate for share buybacks and has said that it can meet that if it pays no more than £69.62 during the next year. Given the current share price this might signal a return to share buybacks. With stock markets looking a little rocky at the moment, shareholders might prefer a special dividend in their pockets instead.
To sum up
- Next looks to be a very good business with high ROCE and very good free cash generation.
- Its financial position is very strong.
- Its future profits are somewhat uncertain as management has given a wide range of possible sales growth for the coming year.
- Profit margins are holding up.
- Stock levels have been controlled well which means bigger discounts to shift unsold items in the January sales are less likely. This is good news for short-term profits.
- 2016 profits have been boosted by a 53rd week of trading which added £15m.
- Profits growth for the year to January 2017 could be quite low. Profits could fall if trading gets weaker. This might stop Next's share price from going up too much.
- Next is likely to have a lot of surplus cash flow in the coming year. More special dividends are possible and could give the shares a high dividend yield.
If you have found this article of interest, please feel free to share it with your friends and colleagues:
We welcome suggestions for future articles - please email me at analysis@sharescope.co.uk. You can also follow me on Twitter @PhilJOakley. If you'd like to know when a new article or chapter for the Step-by-Step Guide is published, send us your email address using the form at the top of the page. You don't need to be a subscriber.
This article is for educational purposes only. It is not a recommendation to buy or sell shares or other investments. Do your own research before buying or selling any investment or seek professional financial advice.

