Oil companies - survival of the fittest
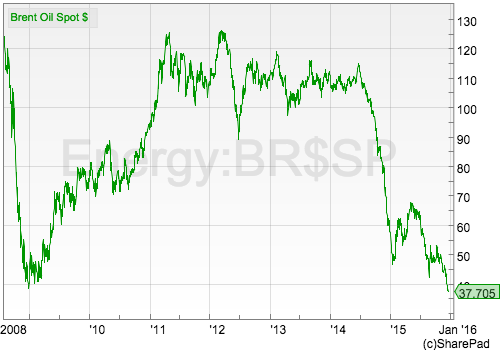
Investors in oil companies have had a year to forget. The oil price has plunged and is now at levels last seen during the financial crisis in 2008. Trying to predict where it will be in a year's time is anyone's guess.
Commodity prices are notoriously volatile and this makes the shares of oil and mining companies a very risky proposition. When prices are going up, then profits go up very quickly. Unfortunately, the reverse is also true as investors this year have learned to their cost. Share prices and dividends tend to follow the same trends.
Oil and mining companies have what is known as high operational gearing. This means that the percentage change in trading profits (EBIT) is often higher - sometimes much higher - than the percentage change in sales. 2015 has been a stark example of this process working out in a very bad way.
If falling prices weren't bad enough, the pain suffered by shareholders in some oil companies has been made even worse by them having lots of debt or financial gearing. This has magnified the falls in trading profits even further. Premier Oil (LSE:PMO) is a good example of this.
Let's take a look at what has been going on.
| Premier Oil plc (£m) | 2013 | 2014 | 2015 |
|---|---|---|---|
| Period Ending | 31/12/2013 | 31/12/2014 | 30/06/2015 |
| Result Type | Q4 | Q4 | TTM |
| Turnover | 910.249 | 1046.863 | 894.208 |
| Norm EBIT | 346.089 | 373.347 | 212.068 |
| Norm Post-tax | 274.531 | 396.411 | 167.655 |
| % changes | |||
| Turnover | 15.01% | -14.58% | |
| EBIT | 7.88% | -43.20% | |
| Post-tax | 44.40% | -57.71% | |
Premier has been investing in new oil fields that have yet to sell a barrel of oil and generate any profits or cash flow. The new fields have added a lot of fixed costs (costs that tend to be the same regardless of the level of turnover) to the business which has made it very vulnerable to a downturn in oil prices.
These fixed costs have to be paid before there is any profit. The more fixed costs a business has, the more sensitive its profits are to a change in turnover - it is more operationally geared. Once the fixed costs have been covered though, each additional £1 of sales tends to contribute a bigger amount of profit. This is great if sales are rising, not so good if they are falling as they are now.
Now throw in a hefty interest bill from borrowing lots of money and the profits to shareholders is geared even further. On a trailing twelve month (TTM) basis, Premier's turnover has fallen by just under 15%. EBIT and post tax profits have fallen by 43.2% and 57.7% respectively - ouch! The company's share price has fallen by 74% this year.
Operational gearing when combined with financial gearing can be a lethal mix for investors. It can make you a lot of money when things are going well and wipe you out when things are very bad.
This is why you should study a company's financial history and pay particular attention to the relationship between changes in turnover and profits during good times and bad. It might stop you from making a big mistake. SharePad has financial data on companies going back more than twenty years which is a big help when looking at an issue as important as this.
Plunging share prices may well be stimulating the interest of bargain hunters. However, before you think about whether an oil company's shares might be tempting you first need to work out whether a company can stay in business.
I'm not going to get into a detailed analysis of the oil and gas sector here. What I am going to do is to show you how you can use a few bits of data in SharePad to quickly get a grasp of whether a company stands a good chance of surviving the oil price rout or whether drastic measures are needed to keep it in business.
Want to learn how to analyse shares like a professional? Download our FREE guide.
Sign-up to our mailing list to receive a PDF of our Step-by-Step Guide to Investing.
Share this article with your friends and colleagues:
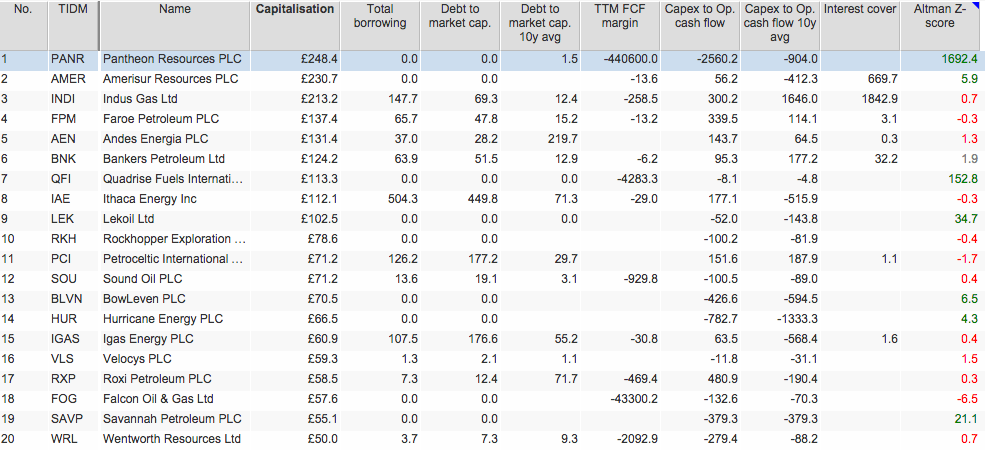
FTSE All-Share Oil and Gas companies
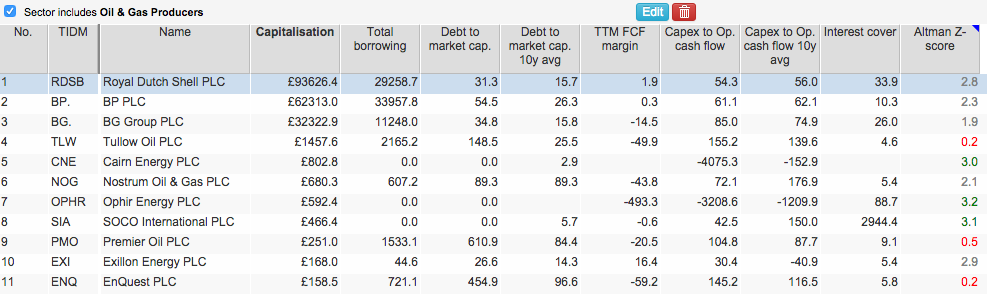
It's very easy to filter a sector of the stock market in SharePad. Once you have done this, you can start analysing it quickly. In the table above, I've asked SharePad to give me a list of the oil and gas producers in the FTSE-All Share index. Once I've done this, I can then get a similar list for other indices such as AIM or US shares.
I've added some ratios to the list to check out the financial health of the companies. This is not a full list of ratios I would use but ones that can give you a fast answer as to whether you should spend any more time researching a share or not.
Total borrowing to market capitalisation (debt to market cap)
With the exception of financial and utility companies which are naturally financed with lots of debt, I tend to see debt levels that are more than 50% of the company's market capitalisation as something to be wary of. I want to sleep well and own businesses where the equity is worth a lot more than the debt.
Once the ratio gets above 100% then the chances are that you are dealing with a share that is experiencing some - probably a lot - of financial distress. For companies such as Tullow Oil, Premier Oil and Enquest the signs look very worrying indeed. Nostrum Oil probably needs watching too.
At the opposite end of the scale, Cairn Energy, Ophir Energy and SOCO International are debt free. That doesn't mean they are safe. They still have to make enough money and produce enough cash flow to pay other bills such as suppliers and tax.
With SharePad you can calculate average ratios over periods up to ten years and compare them with what's going on more recently. Oil companies are trading at levels of debt to market cap that are much higher than their ten year averages.
Free cash flow margin
This ratio looks at the percentage of turnover that is turned into free cash flow. The higher this number, the better and safer a company tends to be.
When times get tough, companies often stop investing money in order to generate free cash flow and pay down debts. This doesn't seem to be happening with many oil companies at the moment. Based on the most recent financial results, only Exillon Energy looks to be generating acceptable free cash flow with a free cash flow margin of 16%.
Big negative numbers on this measure from the likes of Tullow, Nostrum, Ophir, Premier and Enquest are telling you that debt levels are going up or cash balances are going down which is not a good sign if oil prices stay at current levels. Trying to raise new money from investors or lenders in a distressed industry can be very difficult and expensive (they will demand higher interest rates to compensate them for the risks they are taking on). This is a big risk for existing shareholders in some oil companies.
The big oil companies such as BP and Shell are at around free cash flow breakeven levels at the moment. They have cut back their investment spending and don't look to be in any near term danger.
Capex to operating cash flow
I like this ratio and think it isn't used as much as it should be. It compares the amount of money that a company is investing (capex) to the amount of cash coming into the business (operating cash flow).
This ratio is often high when a company is investing heavily. This may not be a problem as long as the cash coming into the business is stable or growing and that the cash being spent will produce even more cash in the future. For oil companies this doesn't seem to be the case at the moment as spending levels aren't coming down quick enough - especially for those younger companies developing their oil and gas fields.
Tullow, Cairn, Ophir, Premier and Enquest are all spending more - in some case a lot more - than the cash that they have coming in. This can't continue for too long before the finances could start coming under considerable stress.
If you look at the ten year averages on this measure, you can see that most of the sector has been spending heavily for some time now.
Altman Z-score
For many years this has been used as predictor of possible bankruptcy (to read more about the Z-score click here). A score below 1.8 is seen as something to worry about.
SharePad colour codes its Z-scores - green is for safe and red is for danger - to help you spot potential trouble ahead. Tullow, Premier and Enquest score particularly badly on this measure.
Interest cover
I've left the most important ratio until last. The ability to pay interest on debts is a key measure of risk for shareholders. Interest has to be paid before shareholders get paid a penny. So the lower interest cover goes, the bigger the risk of dividend cuts or an even worse fate awaits shareholders.
The interest cover ratio tends to be based on a company's last reported EBIT and interest bill. This might tell you that interest payments are being comfortably paid out of profits. But for oil companies where profits are currently falling fast, you might want to consider trying to get a more up to date estimate of how stretched a company's finances might be.
What I am about to suggest is not perfect as debt levels are changing as are exchange rates (oil companies report their profits in US dollars). However, for a private investor who doesn't spend all day analysing shares I think it could be useful and will be fairly close to the results given by a professional analyst's forecast.
SharePad tells you last year's profits, TTM profits and, where available, forecast profits. Interest cover is calculated in SharePad for the last reported financial year and on a TTM basis. To get an idea of what might happen to interest cover, I've calculated a forecast interest cover based on forecast EBIT and the TTM cash interest paid.
Have a look at this table to see how you might go about doing this.
| Name | EBIT | TTM EBIT | fc EBIT | TTM Int paid (CF) | Int cover | TTM Int cover | f/c int cover |
|---|---|---|---|---|---|---|---|
| Royal Dutch Shell PLC | 21056.1 | 3684.2 | 3429.9 | -1060.5 | 33.9 | 5.9 | 3.2 |
| BP PLC | 11107.3 | -644.2 | 4769.2 | 10.3 | |||
| BG Group PLC | 4356 | 3331 | 1680.3 | -408.3 | 26 | 19.9 | 4.1 |
| Tullow Oil PLC | 638.1 | 678.1 | 192.2 | -129.2 | 4.6 | 4.9 | 1.5 |
| Ophir Energy PLC | 401.6 | -5.3 | -86.1 | -8 | 88.7 | -10.8 | |
| Premier Oil PLC | 373.3 | 212.1 | 71.8 | -66.3 | 9.1 | 5.2 | 1.1 |
| Nostrum Oil & Gas PLC | 215.9 | 91.1 | 0 | -47.9 | 5.4 | 2.3 | 0 |
| EnQuest PLC | 195.8 | 171.9 | 0 | -35.8 | 5.8 | 5.1 | 0 |
| SOCO International PLC | 188.4 | 104.2 | 18.8 | -0.1 | 2944.4 | 1628 | 188 |
| Exillon Energy PLC | 40.9 | 40.9 | -3.1 | 5.4 | 5.4 | 0 |
BP cash interest paid is not disclosed as the company includes it in its operating cash flow.
You can get all this data in SharePad and export it to a spreadsheet to do the calculation. You then divide the forecast EBIT by the TTM cash interest paid. I've used cash interest as interest charges in the income statement are more likely to contain non-cash interest expenses that can complicate things.
EBIT Forecasts are not available for every company but it looks as if Tullow and Premier Oil are in big trouble based on expected profits and their latest interest costs. They will be hoping for oil prices to rise sharply in 2016. If they don't then they will probably have to take some drastic actions to reduce their debts.
They could sell assets but are more likely to ask shareholders for fresh money in the form of distressed rights issues (where existing shareholders are given the right to buy new shares in proportion to the amount of shares they already earn). This could wreak further havoc with share prices that have already been hammered.
Other things to consider
Take some time to look at when a company has to pay back its debts. You will find this information in its annual report. Companies that have lots of debt that has to be paid back soon may have to pay much higher interest rates than they are currently paying (when they refinance) which will push profits for shareholders even lower in the short-run.
The other thing that is worth doing is to look at what is going on in the bond market. As well as having shares listed on the stock exchange, companies often have bonds as well.
In my opinion, the bond market is where many smart investors ply their trade. They are often a lot quicker to spot things than the equity (stock) market as there tends to be less emotion involved.
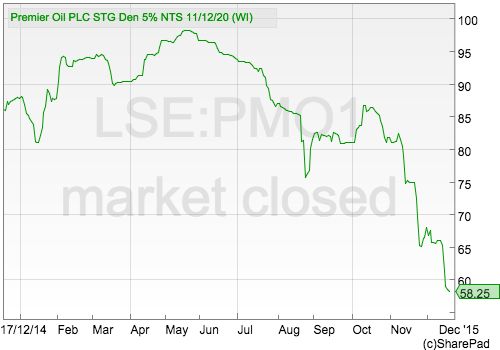
Bond prices tend to move for two main reasons - changes in interest rates and views on how safe a company's finances are.
Bonds tend to be issued and paid back at prices of £100. If bond investors start to get worried that a company might be in financial difficulties then the price will fall a long way below £100. This is because investors start to fret that they might not get all their money back.
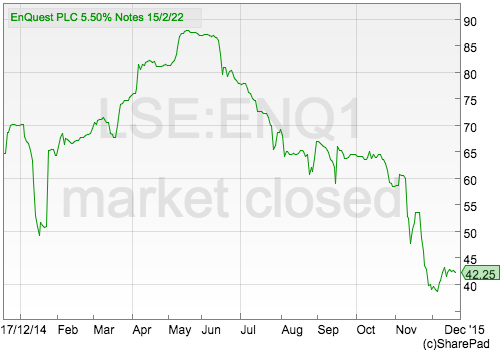
SharePad has lots of information on company bonds. As you can see, the bond prices of issues by Premier Oil and Enquest are trading at very distressed levels. If bond investors are worried about getting their money back then shareholders - who get paid after bond investors - should be really worried.
AIM oil and gas explorers
I've done a similar analysis for oil and gas companies on the Alternative Investment Market (AIM) but I'll leave that for you to look at in your own time.

If you have found this article of interest, please feel free to share it with your friends and colleagues:
We welcome suggestions for future articles - please email me at analysis@sharescope.co.uk. You can also follow me on Twitter @PhilJOakley. If you'd like to know when a new article or chapter for the Step-by-Step Guide is published, send us your email address using the form at the top of the page. You don't need to be a subscriber.
This article is for educational purposes only. It is not a recommendation to buy or sell shares or other investments. Do your own research before buying or selling any investment or seek professional financial advice.

