Can investors rely on Altman Z-Scores?
The world of finance is always trying to conjure up some kind of special number, a shortcut that can be relied upon to produce superior results whilst saving us lots of work and number-crunching at the same time.
If only life was that simple.
Over the last few months I've written about some of these special numbers such as the Beneish M-Score, Piotroski F-Score and Joel Greenblatt's Magic Formula. A lot of the logic behind them is very reasonable and they can reveal some valuable insights but they are not foolproof.
In this article, I am going to tell you about another number that has become very popular with investors as a way of checking out company finances. It too has some decent attributes but taking its results as gospel might be a mistake.
Want to learn how to analyse shares like a professional? Download our FREE guide.
Sign-up to our mailing list to receive a PDF of our Step-by-Step Guide to Investing.
Share this article with your friends and colleagues:
More debt tends to mean more risk
If you place a high value on a good night's sleep then it makes sense to keep your risks low when you are investing. One of the biggest risks you can take is to buy the shares of companies with dodgy finances.
Remember that shareholders are always last in the queue to get paid their share of a company's profits or assets. The more liabilities that are in front of you the more risky your shares tend to be.
Avoiding financial basket-cases can save you from the pain of losing your money if the company goes bust or stop you buying into a disappointing investment in the first place.
So how can you avoid companies with weak finances?
Introducing the Altman Z-Score
Back in the late 1960's, Edward Altman, a professor of finance at New York University set about finding a way to predict which companies were heading for bankruptcy. Altman studied lots of non-financial companies and crunched 22 different financial ratios with numbers taken from their accounts. What he came up with was a formula that has proven to be a reasonably good predictor of future financial distress. It's called the Altman Z-Score.
It looks a little complicated at first glance, but a Z-Score can be easily calculated in a spreadsheet or with a calculator and a bit of paper. If you have a copy of SharePad or ShareScope then there's no need to bother with this as the calculation is done for you. However, as with all financial ratios and calculations, understanding how they are worked out and what they mean is a very useful process for investors.
This is how you calculate it:
Z = 1.2A + 1.4B + 3.3C + 0.6D + 1.0E
Altman found the five financial ratios (labelled A to E) held the key to predicting trouble ahead. Let's have a look at them in turn and see why they are useful.
A: Working capital/Total Assets
Working capital is the difference between a company's current assets (things that can be turned into cash within one year) and current liabilities (bills or debts that have to be paid within a year). It is a measure of a company's liquidity. Altman saw that a low or negative level of working capital relative to the size of the firm (its total assets) was a sign of weak finances.
B: Retained profits/Total Assets
Retained profits are a company's cumulative total profits which have not been paid out to shareholders since it was created. Small retained profits are found in weak or young companies which are more likely to fail. Companies with a high retained profits to total assets ratio tend to have financed their business with profits rather than relying on lots of debt - a good sign according to Altman.
C: Trading profits/Total Assets
This shows how productive a company is. Good, strong companies have big profits in relation to their assets. Weak ones do not. Altman found that this was a particularly good predictor of bankruptcy and was even better than looking at a company's cash flow.
D: Market capitalisation/Total Liabilities
This measure shows how far a company's assets (measured here by its market capitalisation) can decline in value before they are less than its liabilities - which could mean that it is insolvent.
E: Sales/Total Assets
This shows the ability of the firm's assets to generate sales - the lifeblood of any company.
Note: The Z-Score is not calculated for banks or any other financial companies (insurers, asset managers, brokers and real estate managers).
What do the Z-Score numbers mean?
According to Altman, strong companies should have a Z-Score of 3 or more. A company with a Z-Score of less than 1.8 is seen as having problems and could be heading for bankruptcy. If you come across a company with a Z-Score of less than 3 then it probably makes sense to have a good hard look at its finances to see if there is anything to worry about.
In summary, the rough guide for interpreting a Z- score is:
Above 2.99
The company is considered safe based on the five financial ratios.
1.8 to 2.99
Are grey areas which suggest caution. There is a good chance of the company going bankrupt within the next 2 years.
Below 1.80
The score indicates a high probability of distress or even bankruptcy within the next two years.
Altman later adapted the Z-Score for use with non-manufacturing companies. It is almost the same as the original one but with the last ratio (Sales/Total Assets) removed as non-manufacturers don't tend to have large asset bases. SharePad gives you the option of calculating a Z-Score for non-manufacturers using this modified formula. A constant is applied to make the results comparable with the original Altman formula.
Although ShareScope and SharePad work out Z-Scores for you I am going to show you how the number is calculated to help you understand it better.
The box shows two examples: a strong company (British American Tobacco) and a weak company (McBride).
| (£m) | McBride | BAT |
|---|---|---|
| Current assets (X) | 245.4 | 9,132 |
| Current liabilities (Y) | 229.4 | 8,769 |
| Working capital (X-Y) | 16 | 363 |
| Total assets | 429.7 | 26,167 |
| Retained profit | -88.3 | 1,578 |
| EBIT | -13.9 | 5,265 |
| Market cap. | 187.7 | 64,789 |
| Total liabilities | 361.1 | 20,353 |
| Sales | 744.2 | 13,971 |
| A x 1.2 | 0.04 | 0.02 |
| B x 1.4 | -0.29 | 0.08 |
| C x 3.3 | -0.11 | 0.66 |
| D x 0.6 | 0.31 | 1.91 |
| E x 1.0 | 1.73 | 0.53 |
| Z-Score | 1.69 | 3.21 |
SharePad and ShareScope give you a detailed breakdown of how the Z-Score number is calculated as shown below. This helps you understand what is behind a good or bad score.
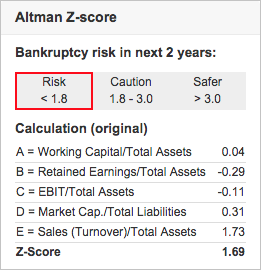
This is the Z-Score for McBride. Its weak Z-Score is explained by its poor profitability. A company needs profits to pay its bills.
The fact that it doesn't have any retained profits (it has made a cumulative loss over its life) is a clear warning sign. The return on assets (EBIT/Total Assets) is also negative because the company made a trading loss in 2014.
Bear in mind that the Z-Score number is based on just one year's financial performance. It is a good idea to look at how the Z-Score has trended over time. You can find this easily in SharePad's financial ratio page.
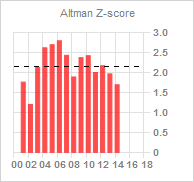
As you can see, McBride has had consistently weak finances over a long period of time according to the Z-Score. Its Z-Score has always been below 3; often below 2. On this basis, it seems as if this company's poor finances are not just a one-off event.
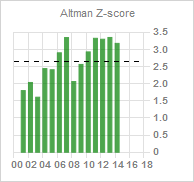
British American Tobacco looks to be in a much better state.
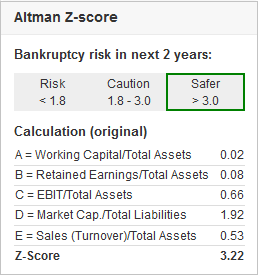
High profitability is a strong point for BAT as is a high valuation compared with its total liabilities. Its historic Z-Score record is better than McBride's but hasn't always been good.
The Z-Score in the real world
Altman's initial study back in the late 1960's predicted 72% of future bankruptcies. Running his study over 31 years to 1999, this increased to between 80-90%. Unsurprisingly, there is also evidence to suggest that companies with higher Z-Scores see their shares perform better than those with lower ones more often than not.
But the Z-Score arguably has some drawbacks too. One thing I suggest is to focus closely on how the Z-Score is arrived at. I would agree that placing the highest emphasis on financial returns (EBIT/Total assets) is fair but there are other parts of the Z-Score that are not so clear cut.
For example, negative working capital - where current liabilities are more than current assets - is not necessarily a bad thing. If a supermarket buys food from a supplier and sells it in three days but doesn't have to pay for it for thirty days, it may have current liabilities more than its current assets. But it also has the cash generated from the sale and 27 days (at least) before it has to pay its supplier. Far from a sign of a company going bust, this is a valuable source of interest-free cash for some companies which reduces the amount they might have to borrow from a bank.
The Z-Score also penalises young companies that haven't been around long enough to build up lots of retained profits. Whilst young companies tend to have a higher bankruptcy rate they can also be the source of great profits for an investor.
Another criticism is that the Z-Score does not work very well for companies such as utilities which typically have low returns on assets and lots of liabilities. In the case of utilities such as National Grid and SSE, Altman's formula suggests that they could get into financial difficulties but ignores the fact that they have very stable profits and are unlikely to go bust.
Other things to look for
The Z-Score can do a good job in identifying companies that could get into financial difficulties but it pays to look at other measures too. Things like the ability of trading profits to pay the interest on borrowings (interest cover) and how variable profits have been over a long period - say 10 years - can tell you a great deal. Also look out for hidden liabilities such as rental payments on buildings. Don't - as the Z-Score does - ignore a company's cash flow either. Comparing a company's leftover or free cash flow as a percentage of debt outstanding will give you an idea of how long it would take to pay off its borrowings.
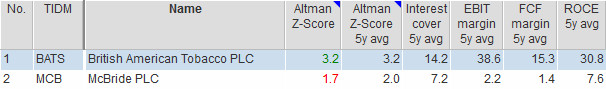
Here I've used SharePad to look at how good BAT and McBride have been performing on other key measures over the last five years. You could use these in addition to looking at the results from a Z-Score. BAT is much better than McBride on all measures.
BAT has very high profit (EBIT) margins which means that profits can fall a long way before causing financial problems. It has also earned very high returns on capital employed (ROCE) for a reasonable length of time and has been able to cover its interest bills more than 14 times with its trading profits. Its ability to turn sales into free cash flow is also very impressive.
In stark contrast, McBride looks weak on many of these measures and confirms the message given by the Z-Score.
If you have found this article of interest, please feel free to share it with your friends and colleagues:
We welcome suggestions for future articles - please email me at analysis@sharescope.co.uk. You can also follow me on Twitter @PhilJOakley. If you'd like to know when a new article or chapter for the Step-by-Step Guide is published, send us your email address using the form at the top of the page. You don't need to be a subscriber.
This article is for educational purposes only. It is not a recommendation to buy or sell shares or other investments. Do your own research before buying or selling any investment or seek professional financial advice.

