Stock Watch: Can Tesco recover?
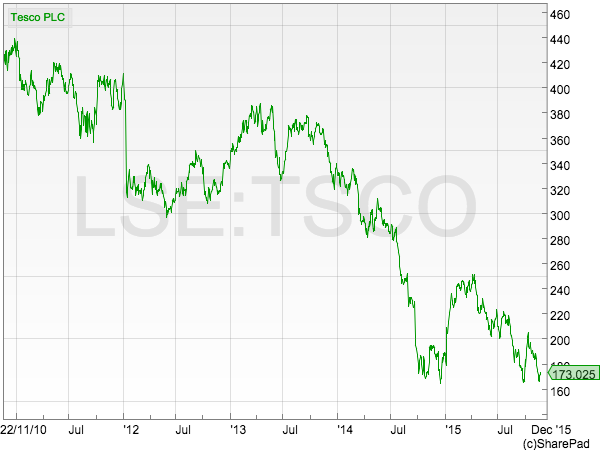
Tesco's fall from grace has been dramatic and swift. Its profits have collapsed and its dividend has been scrapped. Its shares have lost more than half their value during the last two years.
If you are an investor that owns or is thinking of buying some Tesco shares what you really want to know is can Tesco get back on track. In this article, I am going to show you some of things that you might want to be looking at so you can work this out for yourself.
Want to learn how to analyse shares like a professional? Download our FREE guide.
Sign-up to our mailing list to receive a PDF of our Step-by-Step Guide to Investing.
Share this article with your friends and colleagues:
A recap of Tesco's problems
Tesco is in a mess. It has spent far too much money opening up lots of new supermarkets in the UK and across other parts of the world. Unfortunately, these supermarkets have not made enough money to make them good investments. Quite the reverse in fact.
Tesco is also under intense competitive pressure from its rivals. This has left it with lots of problems to fix.
For a long time, the company's spending binge looked to be paying off as profits continued to rise for much of the last decade. That said, the warning signs that all was not well were there to see for anyone who took the time to crunch a few numbers.
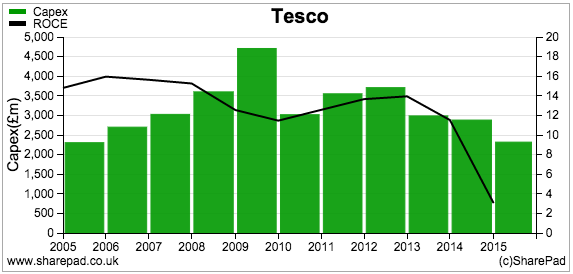
The huge amounts of money spent on its supermarkets steadily made less money as return on capital (ROCE) fell gradually before falling off a cliff.
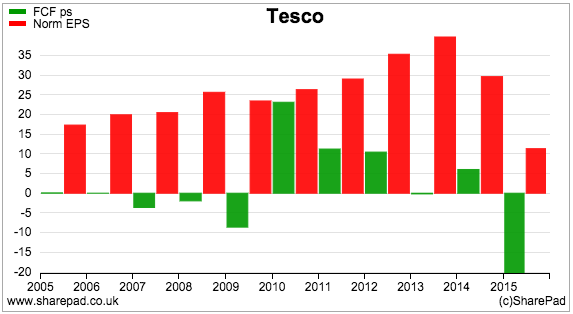
Then there was the question of how much money Tesco was really making. This only really became an issue when the company was forced to admit that it had overstated its profits in 2014. However, the company's spending spree meant that it hadn't fully converted its profits into free cash flow for years (see chart below). It had become virtually impossible for any outside investor to work out what its true profits were (this is arguably true for most supermarkets).
Tesco's poor cash flow performance combined with an increasing pension fund shortfall has seen its debt levels increase..
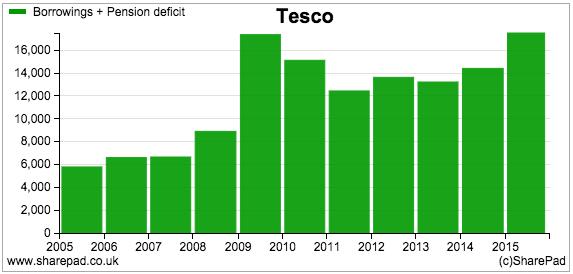
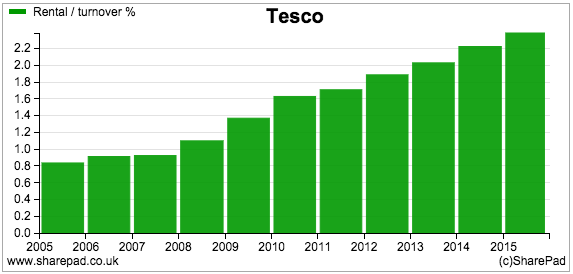
This trend has been made worse by Tesco selling lots of its supermarkets and renting them back from property companies in order to raise money to invest in more supermarkets (much of which has been wasted). What this also did was to create a huge pile of hidden debt (over £10bn according to my estimates) which has left Tesco with a growing rent cost (see below). Not only that, it has tied it into a lot of large out of town supermarkets which customers have deserted in droves. This has increased Tesco's fixed costs and made the company's profits even more sensitive to a fall in sales - known as operational gearing.
To fix Tesco and make it a good company again it has to do the following:
- Halt the fall in sales and profits and start growing them again.
- Turn more of its profits into free cash flow.
- Pay down its debts.
Let's see how it is getting on.
Growing sales
Any sustainable recovery in Tesco's UK business probably has to be sales-led rather than driven by cost-cutting. Tesco needs to win back its former customers who are now shopping elsewhere.
Here the news is not good. Tesco is continuing to see its UK sales fall and, with it, its market share of the UK grocery market. Kantar WorldPanel provides a lot of very useful information about the UK grocery market for free on its website (click here). It does not paint a pretty picture for Tesco and its shareholders.
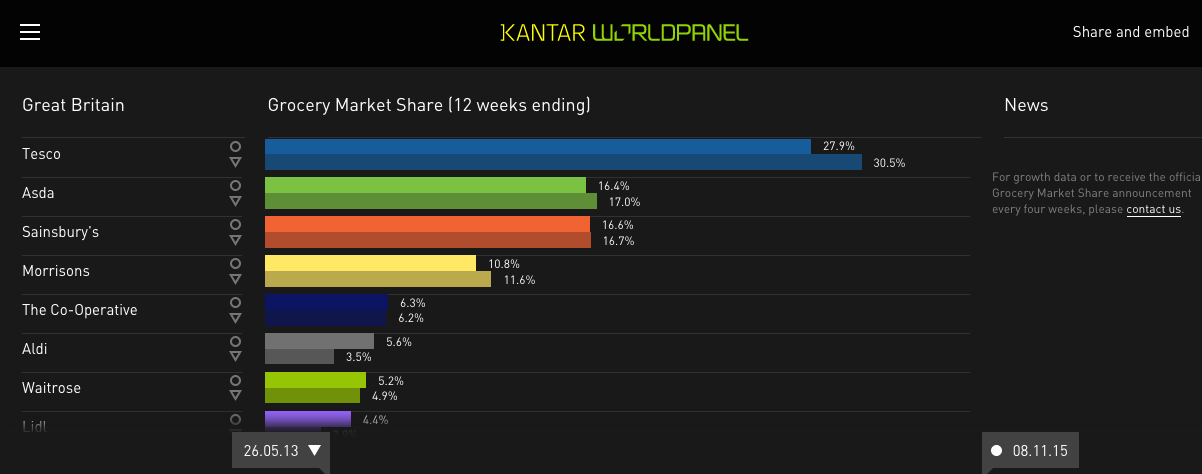
Source: Kantar WorldPanel
Two and a half years ago Tesco had over 30% of the UK grocery market. It has since lost 2.6% of that, mostly to the discount chains of Aldi and Lidl. If I was looking at Tesco as a potential investment, I would be spending a lot of time looking at these two businesses.
Although Aldi and Lidl are privately owned German companies it is possible to find out a lot about them as the accounts for their UK businesses can be found online at Companies House for free (click here to go to the Companies House website). When I was a professional analyst I used to spend a lot of time looking at the privately owned competitors or the group companies of quoted companies from this source. If you have the time to do this you can really improve your knowledge and research of a company.
The rise of Aldi
I've had a look at the financial performance of Aldi in the UK between 2009 and 2014. The key takeaways are shown in the tables below.
| Aldi Stores (£m) | 2009 | 2010 | 2011 | 2012 | 2013 | 2014 |
|---|---|---|---|---|---|---|
| Sales | 2055.7 | 2144.1 | 2768 | 3890.9 | 5275.3 | 6893.3 |
| EBIT | -5.9 | 27.7 | 108.3 | 177.6 | 274.8 | 260.3 |
| EBIT margin | -0.30% | 1.30% | 3.90% | 4.60% | 5.20% | 3.80% |
Capital Employed | 1347 | 1640 | 1517 | 1426.4 | 1595.4 | 1744 |
| Rental expense | 63.9 | 52.8 | 48.4 | 54 | 54.6 | 54.6 |
| Rents x7 | 447.3 | 369.6 | 338.8 | 378 | 382.2 | 382.2 |
| Lease-Adjusted Capital Employed | 1794.3 | 2009.6 | 1855.8 | 1804.4 | 1977.6 | 2126.2 |
| Lease-adjusted EBIT @ 6% | 20.9 | 49.9 | 128.6 | 200.3 | 297.7 | 283.3 |
| Lease-adjusted ROCE | 1.20% | 2.50% | 6.90% | 11.10% | 15.10% | 13.30% |
As you can see, Aldi's growth has been stunning. Sales have grown from just over £2bn to just under £7bn in five years. What's even more impressive is that Aldi has been able to do this with an increase in investment (lease-adjusted capital employed) of just £332m. Unlike lots of retailers that grow, it would seem from its accounts that Aldi is not doing this by renting lots of new stores (but I don't know this for certain).
Having said this, Aldi's profits, profit margins and ROCE all fell in 2014 which suggests that it hasn't been able to escape totally unscathed from the supermarket price wars. Its lease-adjusted ROCE of 13.3% is comfortably more than Tesco, Sainsbury's and Morrisons.
The success of Aldi's business model is based on its lean structure and focused approach to retailing (read more limited product ranges and smaller stores compared with the big 4 supermarkets). The effectiveness of this strategy is shown in its impressive cash flow performance.
| Aldi Stores (£m) | 2009 | 2010 | 2011 | 2012 | 2013 | 2014 | Cumulative |
|---|---|---|---|---|---|---|---|
| Operating cash flow | 40.6 | 60.8 | 297.3 | 399.8 | 517.9 | 509.1 | 1825.5 |
| Tax paid | -13.6 | -1.2 | -4.8 | -30.1 | -55.5 | -60.7 | -165.9 |
| Capex | -221.4 | -127.8 | -116.8 | -165.5 | -274.3 | -438.1 | -1343.9 |
| Free cash flow for Firm (FCFF) | -194.3 | -68.2 | 175.7 | 204.2 | 188.1 | 10.3 | 315.8 |
| Interest received | 1.8 | 1.5 | 1.9 | 2.9 | 2 | 1.5 | 11.6 |
| Interest paid | -10.1 | -20.1 | -25 | -17.5 | -16.6 | -14.5 | -103.8 |
| Free cash flow for Equity | -202.7 | -86.8 | 152.7 | 189.6 | 173.4 | -2.7 | 223.6 |
| Depreciation & amortisation | 64.8 | 69.8 | 75.4 | 78.9 | 85.7 | 110.3 | 484.9 |
| Capex to depreciation | 3.4 | 1.8 | 1.5 | 2.1 | 3.2 | 4 | 2.8 |
| Capex to Sales | 10.80% | 6.00% | 4.20% | 4.30% | 5.20% | 6.40% | |
| FCF as % of operating cash flow | -498.70% | -142.80% | 51.40% | 47.40% | 33.50% | -0.50% | 12.35% |
| Net funds | -16.9 | -300.4 | -115.6 | 192.2 | 238.2 | 221 |
Despite very high rates of investment, Aldi has been able to generate a cumulative free cash flow of £223m since 2009 and has cash in the bank. It seems that Aldi can finance its growth from its own cash flow and doesn't have to borrow money. It is therefore no surprise that Aldi feels confident that it can still expand massively in the UK over the next few years. This should worry the big supermarkets and could be very bad news for Tesco.
Let's look at Tesco on the same basis over the same time period. You can easily do this by creating a custom results table in SharePad and exporting it to a spreadsheet to do a few more calculations.
| Tesco Plc (£m) | 2010 | 2011 | 2012 | 2013 | 2014 | 2015 | Cumulative |
|---|---|---|---|---|---|---|---|
| Net cash operations | 5435 | 4881 | 4939 | 3294 | 3681 | 1097 | 23327 |
| Dividends received | 35 | 62 | 40 | 51 | 62 | 88 | 338 |
| Capex | 3018 | 3551 | 3708 | 2987 | 2881 | 2318 | 18463 |
| Free cash flow to the firm | 2452 | 1392 | 1271 | 358 | 862 | -1133 | 5202 |
| Interest received (CF) | 81 | 128 | 103 | 85 | 121 | 104 | 622 |
| interest paid | -690 | -614 | -531 | -457 | -496 | -613 | -3401 |
| Free cash flow to Equity | 1841 | 904 | 840 | -14 | 487 | -1642 | 2416 |
| Depreciation & amortisation | 1384 | 1420 | 1445 | 2254 | 1532 | 1552 | 9587 |
| Capex to depreciation | 2.2 | 2.5 | 2.6 | 1.3 | 1.9 | 1.5 | 1.9 |
| Capex to sales | 5.30% | 5.90% | 5.80% | 4.70% | 4.50% | 3.70% | |
| FCF as % of operating cash flow | 33.90% | 18.50% | 17.00% | -0.40% | 13.20% | -149.70% | 10.40% |
| Net borrowing | 10454 | 8647 | 9444 | 8322 | 8707 | 10494 |
Tesco has also been able to finance its investment from cash flow over the same period but its free cash flow has turned sharply negative recently. Despite having a big one-off boost to free cash flow in 2010 it has turned less of its operating cash flow into free cash flow than Aldi - 10.4% versus 12.4% over the same time period.
Aldi's performance is even more impressive given its average capex to depreciation rate was higher at 2.8 times compared with Tesco's 1.9 times. It has invested more but still generated more cash. Unlike Tesco it is also not burdened with a pension shortfall and lots of hidden debts.
Can Tesco start generating free cash flow again?
Not yet it would seem.
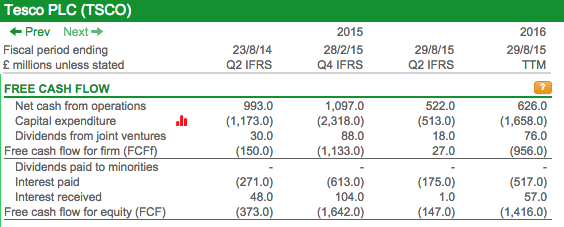
Whilst the free cash outflow was lower during the first six months of the current financial year at £147m, Tesco has still seen a free cash outflow of £1.4bn on a trailing twelve month (TTM) basis.
What's particularly worrying is that Tesco's net cash from operations almost halved during the first six months. The free cash flow performance improved due to the slashing of investment (capex) on which I'll say more shortly.
Have a look at the couple of charts below. When Tesco was growing, it was able to squeeze cash out of its suppliers by taking longer to pay them on an increasing value of products. This was shown in the change of creditors line in its cash flow statement.
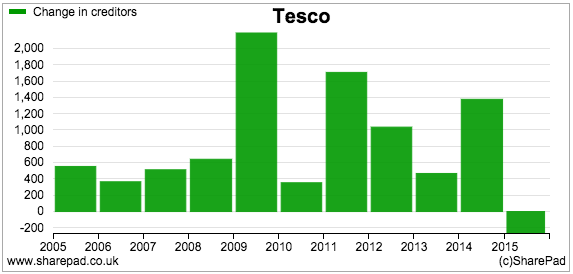
This made up a meaningful chunk of Tesco's operating cash flow for many years as shown in the chart below. However, this is no longer the case.
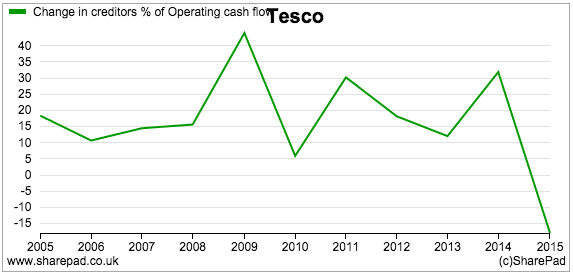
Is this the start of a trend? Can a retailer with shrinking sales generate cash flow from its suppliers? If not then Tesco's is going to have a tough job on its hands trying to generate meaningful free cash flow and pay down debt.
Slashing Investment
There's no doubt that Tesco spent too much money in the past. Now it is slashing its investment spending or capex as it is known.
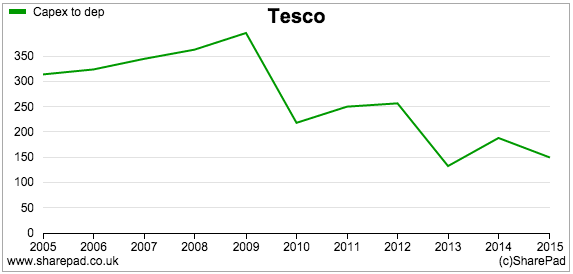
Capex was just over £500m in the first six months of this year compared with over £1.1bn for the same period in 2014. Tesco says that full year capex for 2015/16 will be around £1bn.
This might seem a good thing to do. But could Tesco go from a position of spending too much on its stores to spending too little?
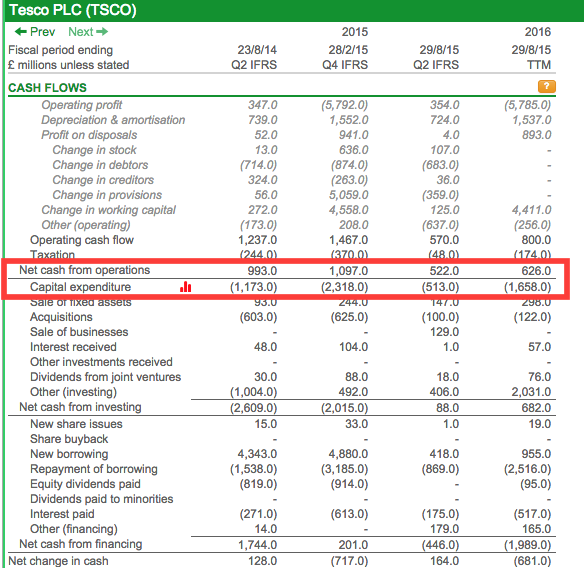
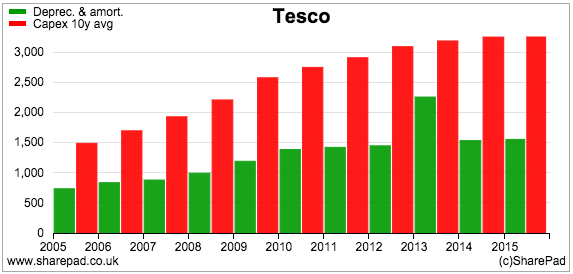
This £1bn needs to be compared with a TTM depreciation and amortisation expense of £1.5bn. I've written a lot about the topic of maintenance or stay in business capex in recent weeks and have argued that for most companies this is likely to be more than the depreciation expense in the accounts.
The chart below compares Tesco's depreciation expense with its ten year average capex spend over the last ten years. For most companies - but not all - this ten year average could be seen as a reasonable proxy for what they need to spend most years to keep its assets in good shape and maintain their ability to produce the same amount of sales. This is not straightforward with Tesco due to its spending splurge but, if anything, there could be grounds for arguing that Tesco's stay in business capex is higher - maybe a lot higher - than its depreciation charge.
So what is spending less than depreciation on new assets going to do for the look of Tesco's stores and its ability to woo more customers?
One of the most cited criticisms of Tesco's UK supermarkets is that they are a bit scruffy and could do with a bit of money spent on them. This doesn't look like it is on the cards.
So where does this all leave Tesco in its quest to generate free cash flow?
Let's say that capex can be slashed to £1bn and kept there (I think this is unlikely). Given its interest bill and money coming in from joint ventures, growth in free cash flow just to get to a breakeven position is going to have to come from trading cash flow. It might not be able to squeeze its suppliers so this growth is probably going to have to come from extra operating profits.
| Tesco path to breakeven FCF | TTM/Adjusted (£m) |
|---|---|
| Net cash from operations | 626 |
| Dividends from JV's | 76 |
| Interest received | 57 |
| Interest paid | -517 |
| Capex | -1000 |
| Free cash flow | -758 |
| Extra operating profit needed | 758 |
The profit increase needed to generate a meaningful free cash inflow so that Tesco can start paying a dividend again is even bigger.
Paying down debt
Tesco has sold its Korean supermarkets and this has allowed it to reduce its debt pile slightly. More sales of businesses - possibly its European supermarkets - are likely and this would help to reduce debt.
It will be harder and more expensive to reduce the hidden debts that come from long-term rental agreements on lots of UK supermarkets and the pension deficit. Some analysts fear that Tesco might have to ask shareholders for more money - via a rights issue - which would put further downwards pressure on its share price.
Tesco is hoping that it can avoid this by becoming more profitable and selling assets.
What level of sustainable profits is baked into the share price?
You can spend a lot of time trying to work out how much money Tesco might be able to make in the future. Alternatively, you can try and work out what the current share price is implying. You can do this using the earnings power value (EPV) tool in SharePad.
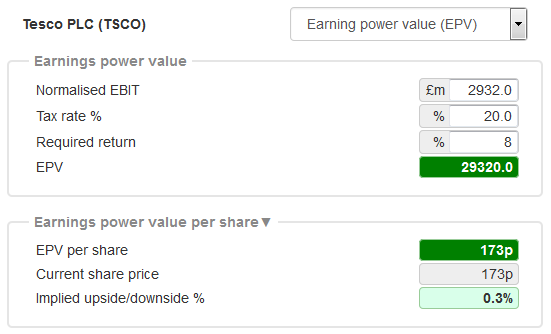
EPV gives you the value of a company based on it making a certain level of profit (EBIT) at a given tax rate and discount rate (the investor's required return needed to own the shares). To read more about this valuation method click here.
You can also use it to invert share prices to get a level of sustainable profits implied by the current share price. Simply choose a long-term tax rate and discount rate and then keep putting profit numbers into the tool until you get the current share price. Using a discount rate of 8% and a long-term tax rate of 20%, SharePad is telling me that Tesco needs to have sustainable EBIT of nearly £3bn to justify its current share price.
With a trailing 12 month normalised EBIT of £800m, Tesco's road to recovery and a higher share price looks tough.
If you have found this article of interest, please feel free to share it with your friends and colleagues:
We welcome suggestions for future articles - please email me at analysis@sharescope.co.uk. You can also follow me on Twitter @PhilJOakley. If you'd like to know when a new article or chapter for the Step-by-Step Guide is published, send us your email address using the form at the top of the page. You don't need to be a subscriber.
This article is for educational purposes only. It is not a recommendation to buy or sell shares or other investments. Do your own research before buying or selling any investment or seek professional financial advice.

