The value of your investments #2: Earnings Power Value (EPV)
In part one, I showed you how you could value bonds and shares using forecasts of their future cash flows or profits. The problem that most of us face is that we cannot accurately predict how much money a company will make in the future no matter how clever we think we are.
Want to learn how to analyse shares like a professional? Download our FREE guide.
Sign-up to our mailing list to receive a PDF of our Step-by-Step Guide to Investing.
Share this article with your friends and colleagues:
Don't bother forecasting future profits - You don't need to
The private investor always has two valuable pieces of information about a company. These are freely available. They are:
- Its current share price
- Its latest profits and cash flow
By using this information along with a bit of simple maths, an investor can work out what a company's current share price is implying about its future prospects. I am going to show you how a company's current value can be broken down into two separate bits: How much it is worth based on its current profits and how much is based on them growing in the future.
What's really good about this approach is that you are not wasting time crystal ball gazing trying to guess what future profits will be. Instead you are working out what the share price is telling you about future profits and then asking yourself whether those assumptions are reasonable. If they are you might consider buying some shares. If they are not then you can move on quickly and look at another share.
By using this approach an investor can not only reduce the risks of paying too much for a share but can also potentially pick out undervalued ones. Companies that might be undervalued are ones where the share price is saying that profits may never grow again or actually fall. If that's unlikely and profits might stay the same or even grow a little bit then you may have unearthed a potential bargain.
Introducing Earnings Power Value (EPV)
EPV has its roots in the investment philosophies of legendary value investors Benjamin Graham and David Dodd. They calculated the earnings power of a company by looking at the profits of a company over a long period of time and then estimating what the average profits would be taking into account all likely business conditions.
The estimate of earnings power would then be capitalised by an appropriate factor (or multiplier such as a PE ratio) to give a prudent valuation for a company's shares. Their reasoning was that this would give them an all-important margin of safety as they wouldn't have to assume anything about the future only that it had a good chance of being similar to what had happened in the past.
You can also work out a company's EPV based on its current level of profits. You can easily get these from ShareScope or SharePad or a company's annual report. If you can buy a company for a lot less than its EPV then you may have enough of a buffer or "margin of safety" to make a handsome profit. You can also use the same calculation to work out if a share may have become too expensive.
The best way to explain how you go about doing this is to look at an example.
Bargains are often found when the market is crashing and people are very gloomy about the future. March 2009 marked the nadir of the financial crisis and saw share prices of many good quality companies at a very low ebb. I've used Next as an example of this.
You can see the calculation of its EPV in the table below. Don't worry too much about this right now, I'll explain everything shortly.
| Next plc (£m) | Mar-09 | Aug-15 |
|---|---|---|
| Most recent trading profit (EBIT) | 484.6 | 735.7 |
| Tax rate | 29.50% | 20.40% |
| Tax on EBIT | -143 | -150.1 |
| Post-tax EBIT (A) | 341.6 | 585.6 |
| Required return or interest rate (B) | 8% | 8% |
| Implied EPV = A/B | 4270 | 7320 |
| Less net debt | -642.7 | -530.4 |
| Less pension fund deficit | -69.1 | 0* |
| Equity value | 3627.3 | 6789.6 |
| Shares (m) | 197.1 | 152.9 |
| EPV per share | 1840p | 4416p |
| Share price | 1120p | 7930p |
| EPV as % of share price | 164% | 56% |
* I ignore pension surpluses - they do not represent available funds.
When the EPV represents less than 100% of the share price (is below the share price) then it suggests the shares may be overvalued unless profits are going to increase in the future.
It may be easier to think of the Earnings Power Value per share as a conservative target price to work out whether you should buy or sell a share.
As you can see, back in March 2009 the stock market took a very grim view of Next's prospects. The shares were priced at 1120p whilst EPV analysis would have suggested the company was worth 1840p. It suggests that the market thought that profits would fall to a much lower sustainable level.
The ensuing six or so years has shown that the stock market was too pessimistic. The company, in retrospect, was undervalued. The company's earnings power value has more than doubled and the price increased more than six-fold.
But now Next's stock valuation is much more generous. EPV analysis suggests a valuation of 4440p whilst shares trade at 7930p.
Does this mean that Next shares are overvalued? Not necessarily. But this 44% premium suggests an assumption of greater future profits growth.
This makes its shares more risky than they were back in 2009. That's not to say that they still can't be a good investment. It's just that you are having to pay up for future growth today whereas back in 2009 that wasn't the case. In Graham and Dodd language there is a much lower margin of safety in buying Next shares today.
How to calculate a company's earnings power value
In brief the basics of the calculation are:
- Take the company's most recent annual underlying (ignoring one-off gains and losses) operating profits or EBIT. For cyclical businesses such as manufacturers or housebuilders, use an estimate of average profits over an economic cycle (I'll show you how to do this later).
- Tax this figure at the company's tax rate to be conservative. You'll find this figure in ShareScope and SharePad.
- You now have an estimate of owner earnings for its investors. Divide this figure by your required return (the rate of interest) to get EPV. This is the value of the whole business if those earnings stay the same forever.
- Take away any debt, pension deficits, minority interest and preferred equity offset against any cash balances to obtain the value of equity.
- Divide the equity by the number of shares to give a value per share.
- Compare your value with the current share price.
Now for a little bit more explanation.
Why we use EBIT rather than post tax profits or earnings per share (EPS)
The value of equity is the value of the business after all liabilities have been taken away. It is the residual value of the business - what's left over.
The reason for using EBIT as a starting point is because it represents the profits made by all the assets of the business and the money that is available to pay lenders and shareholders. EBIT, unlike post tax profit, is not affected by how a company is financed or taxed.
By taxing EBIT and dividing it by an interest rate we can get a value for the whole business which is not influenced by how it is financed. It is a very clean estimate of value. The equity value is then calculated by taking away net debt and debt-like liabilities such as pension fund shortfalls (deficits) to find out how much money is left over.
In my opinion, starting with a value of the whole business (known as enterprise value or EV) and taking away liabilities to get an equity value is the best way to value shares. Lots of people start with post tax profits and EPS and start multiplying that by another number to get an equity value. I am not going to get into this now but I think this is the wrong approach and can lead to more mistakes. (To see how debt affects profits and PE ratios click here).
How much does it cost to stay in business?
The whole point of the EPV calculation is to work out a level of sustainable profits or cash flow that can be paid to investors. EBIT is calculated after depreciation has been taken away. Depreciation is seen by some people as an estimate of how much a company needs to spend to maintain the value of its existing fixed assets. In the real world though this might not be true. A company might need to spend a lot more than this.
If a company's EBIT is based on an unrealistic depreciation expense then our estimate of EPV is not going to be as prudent as it could or should be. So the estimate of Next's EPV in the table above is only going to make sense if its depreciation forecast is accurate.
A few weeks ago I looked at how investors could go about estimating maintenance or stay in business capex (click here to read more). It's a very difficult item to estimate for an outside investor and there are no right answers. My gut feeling is that it will probably be more than depreciation.
I've been experimenting with different approaches to this problem in recent weeks and have found that using the five year or ten year average total capex figure might be an option. (SharePad can give you this figure in a matter of seconds). The reasoning behind this is that the average figure might smooth out the ups and downs of spending on new assets and could give an estimate of how much needs to be spent every year going forward.
But every company is different and this approach might be unkind to those who have spent a lot of money recently to expand and grow but will now need to spend less to maintain those assets.
Next's latest depreciation and amortisation expense is £112.4m. Its ten year average capex is £128.4m - a £16m difference. You could reduce Next's EBIT by £16m to get a more prudent estimate of sustainable profits. Or you could take the view that its depreciation expense is about right as it roughly equals the average amount of money it has spent on new assets during the last five years.
In SharePad you can do this kind of calculation and comparison as shown in the table below.
Comparing depreciation to average capex spending
| TTM Dep & am | 10y avg Capex | TTM Dep & am % of 10y avg Capex | TTM Dep & am % of 5y avg Capex | |
|---|---|---|---|---|
| Next | 112.4 | 128.4 | 87.50% | 98.90% |
| Marks & Spencer Group | 522.8 | 647.9 | 80.70% | 78.10% |
| Kingfisher | 262 | 378.8 | 69.20% | 79.20% |
| WH Smith | 36 | 34.1 | 106% | 98.40% |
| JD Sports Fashion | 45.2 | 37 | 122% | 87.50% |
| Home Retail Group | 136 | 158.7 | 85.70% | 95.60% |
| Debenhams | 102.5 | 113.1 | 89.10% | 87.80% |
| TTM | 12 month's trailing data (uses latest quarterly or interim results to derive a more up-to-date figure) | Dep & Am | Depreciation & amortisation |
|---|---|
The choice of interest rate
As I showed in part one, valuations are very sensitive to the choice of interest rate. Low interest rates will produce higher EPVs and vice versa.
There is plenty of academic research on what interest rate you should use when valuing a business. Most of it has been shown to be deeply flawed. All you need to know is that the higher the interest rate you use the more conservative your estimate of value will be. Here are some rough and ready guidelines of the interest rates you might want to use when valuing different companies.
- Large and less risky companies (FTSE 350) - 7% to 9%
- Smaller and more risky (lots of debt or volatile profits) - 10 to 12%
- Very small and very risky - 15% or more
Earnings power value over time
A company's earnings power changes over time as its profits and interest rates change. You can look at how its EPV has changed historically as well. I've calculated Next's EPV going back to 2004 at a constant interest rate of 8% so that I can see how the value of the business has changed due to changes in its profitability rather than changes in interest rates.
Remember, when the EPV represents less than 100% of the share price (is below the share price) then it suggests the shares may be overvalued unless future sustainable profits will be higher than they are today.
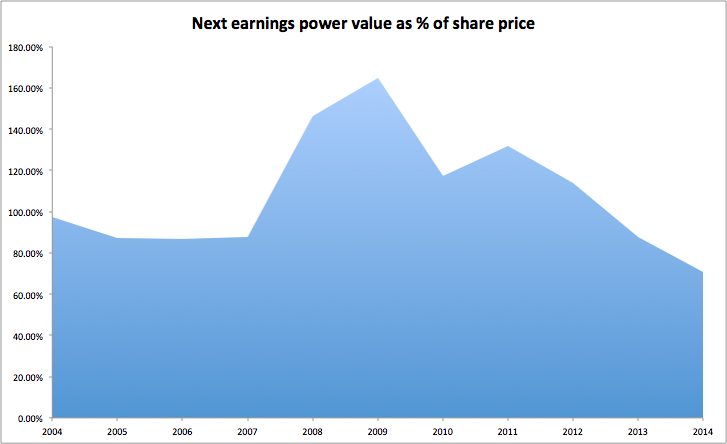
This chart is telling us that the stock market has often taken quite a dim view of Next's future prospects. Its EPV based on its current profits has often explained a large chunk or more of its current share price. What we can see now is that a bigger part of Next's share price is related to future profits than at any time during the last ten years.
As I said earlier, this does not mean that Next's shares are overvalued. But what you can see from this exercise is that sentiment towards the shares is higher than it has been for some time which suggests that the shares might not be as attractively valued as they have been in the past.
I used this tool when I was a professional analyst all the time. Back in 2000, at the time of the technology, media and telecom (TMT) shares bubble, I pointed out to the telecoms analyst at the firm I was working for that I thought Vodafone's shares were massively overvalued. Too much of its share price was based on expectations of much higher future profits.
Of course, I had no idea how Vodafone's future would turn out but my simple EPV calculation said that the shares were worth about 25p - or just over 5% of its share price - based on the profits made in 2000. The shares were changing hands for over 400p. The EPV was useful because it told me that Vodafone would need astronomic levels of profits growth to justify its share price which it ultimately could not.
The earnings power value of a cyclical business
One of the potential problems you can run in to when using the EPV value is that the current profits might not be a good indication of what a company might earn over the ups and downs of an economic cycle - they might be too high or too low. The shares of housebuilding companies are a good example of this as profits have swayed from boom to bust along with the housing market.
That doesn't mean that EPV still can't be useful. You can still try and weigh up the value of the shares by trying to estimate what its average profits might be over an economic cycle. Here's an EPV calculation for housebuilder Persimmon using its current profits and one based on using its average EBIT margin over the last ten years of 11.8%. Based on trailing twelve month sales of £2708.3m, that would give an average EBIT of £319.6m.
| Persimmon plc (£m) | Current profits | Average profits |
|---|---|---|
| Most recent trading profit (EBIT) | 531.9 | 319.6 |
| Tax rate | 20% | 20.00% |
| Tax on EBIT | -106.4 | -63.9 |
| Post-tax EBIT (A) | 425.5 | 255.7 |
| Required return or interest rate (B) | 8% | 8% |
| Implied EPV = A/B | 5318.8 | 3196.3 |
| Net cash | 378.4 | 378.4 |
| Less pension fund deficit | -0.5 | -0.5 |
| Equity value | 5696.8 | 3574 |
| Shares (m) | 306.5 | 306.5 |
| EPV per share | 1859p | 1166p |
| Share price | 2057p | 2057p |
| EPV as % of share price | 90.40% | 56.70% |
Based on its current profits, the EPV explains 90% of the current share price. The market is implying that Persimmon's sustainable profits are higher than they are currently - despite being at or near record levels. On average profits, the EPV explains just over half the current share price.
Are Persimmon shares overvalued? I'll leave you to work that out for yourself.
If you have found this article of interest, please feel free to share it with your friends and colleagues:

