Is National Grid the ultimate safe share?
Want to learn how to analyse shares like a professional? Download our FREE guide.
Sign-up to our mailing list to receive a PDF of our Step-by-Step Guide to Investing.
Background
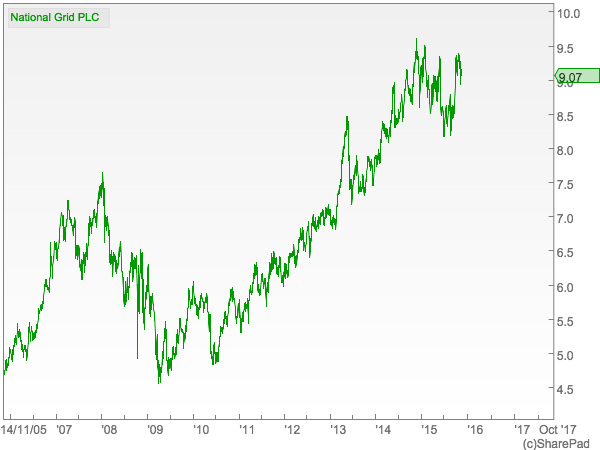
National Grid shares are very popular with investors. During the last five years the share price has almost doubled whilst the company has been paying out some very chunky dividends. It seems there's a lot to be happy about.
In a world where savings accounts and government bonds pay miniscule rates of interest it's not difficult to see why more investors have been snapping up National Grid shares with a dividend yield of around 5%. On top of this, it would seem that National Grid is a very safe business to invest in.
The company owns and looks after gas and electricity grids in the UK and USA. Because gas and electricity are an essential part of our daily lives, the business of looking after these grids is regulated. In return for keeping them in good condition and connecting more gas and electricity to households and businesses, National Grid is allowed to charge its customers a fair price. This means that it has enough money to spend on the grids and still have enough money left over to pay the interest on any money it has borrowed, the taxman and a dividend to its shareholders.
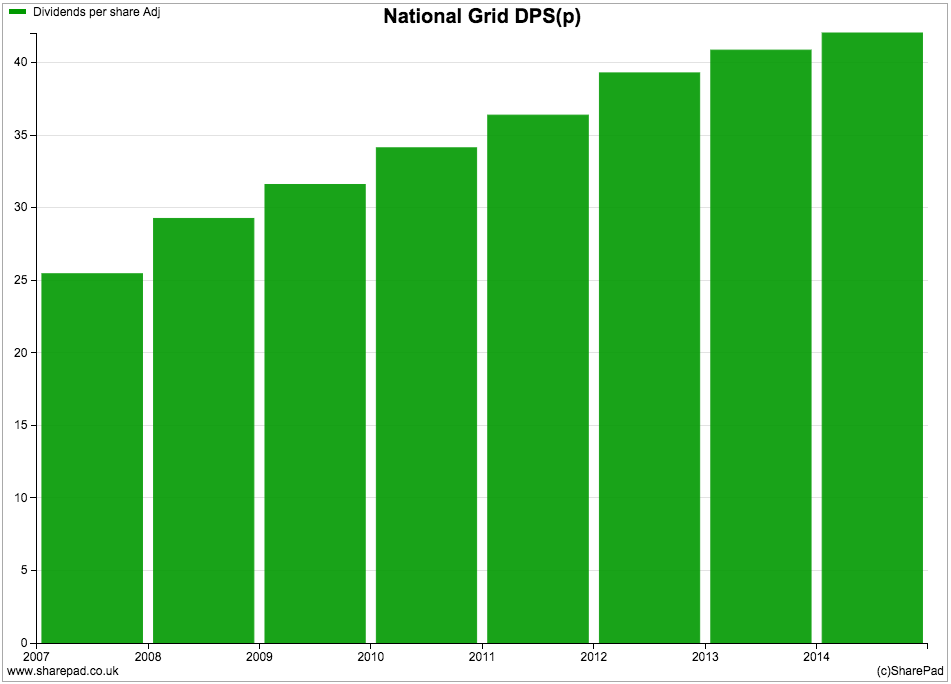
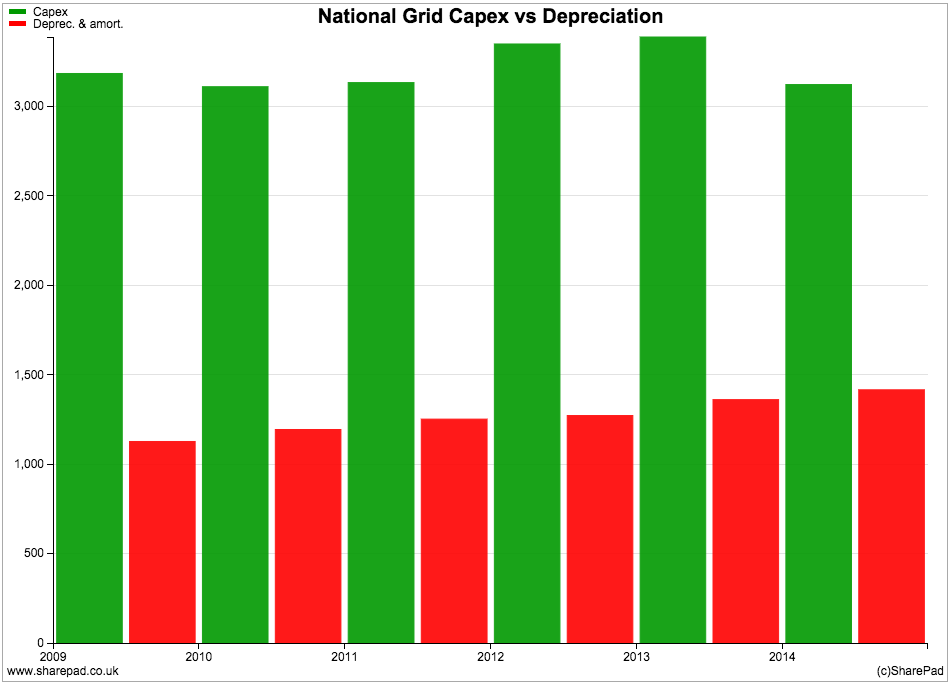
Unlike a power station or a gas field, National Grid's profits are not very dependent on the market price of electricity or gas (which has been falling). National Grid makes money by spending money on new wires, pylons and pipelines. The amount of money it has been spending on these things has been rising in recent years as worn out assets have been replaced and new sources of electricity (wind farms and solar panels) and gas have been connected to its grids. By paying for these assets with cheap loans, National Grid has been able to make more money and pay bigger dividends to its shareholders (see chart below).
The company is confident it can keep on growing its dividends by at least the rate of inflation (measured by the Retail Price Index) for at least the next five years. This all sounds very promising. However, when you own any share it's always a good idea to look under the bonnet from time to time to see if everything is as good as it seems.
If you are a shareholder in National Grid - or thinking of becoming one - this means checking if there is enough money to pay and grow dividends and whether the share price is cheap, expensive or fairly valued.
Let's have a look.
The company has been spending and borrowing a lot of money
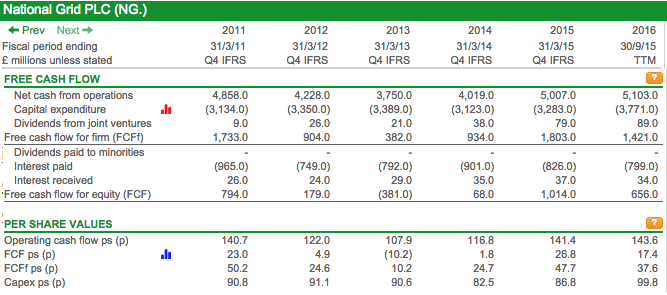
For the last seven years, National Grid has been spending more than £3bn per year on new assets (capex). During the last year it has spent nearly £3.8bn. This has seen the size of its assets on its balance sheet grow significantly.
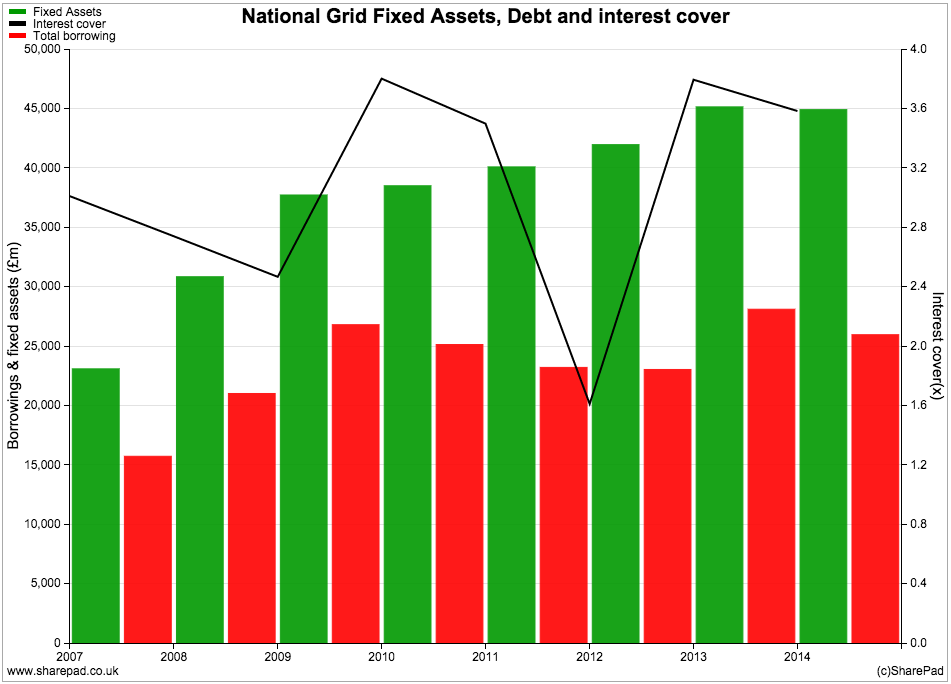
It has also borrowed more money to pay for these assets but has been able to do so at low interest rates. The good news is that it doesn't appear to have borrowed too much as its trading profits can cover the interest on its borrowings more than three times. This is quite comfortable for a business such as National Grid and is nothing to worry about.
A large amount of electricity and gas assets has allowed National Grid to make more money which has led to more cash coming into the business (trading or operating cash flow), especially during the last year.
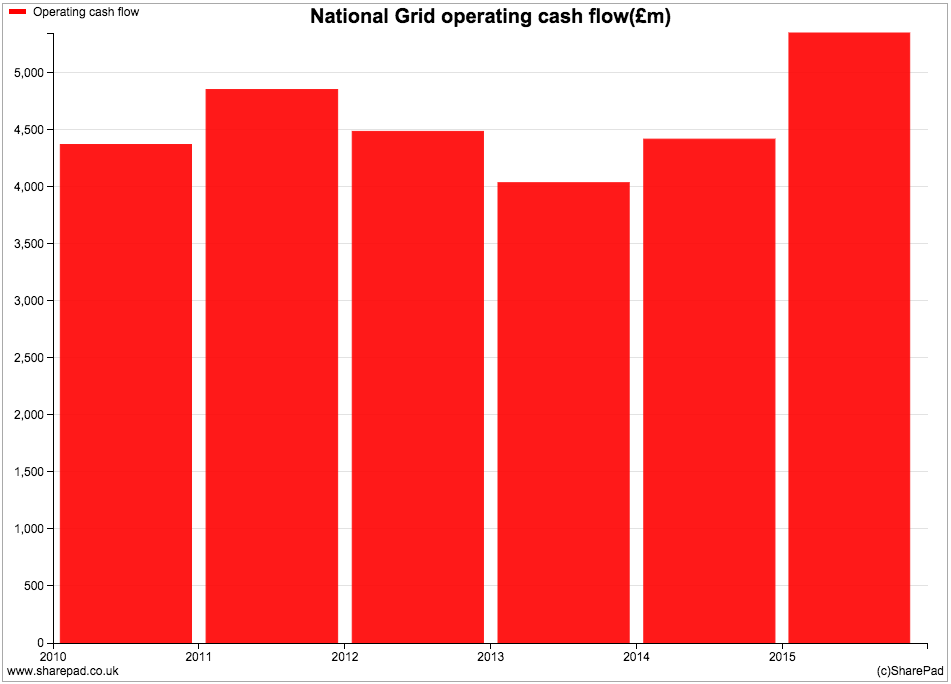
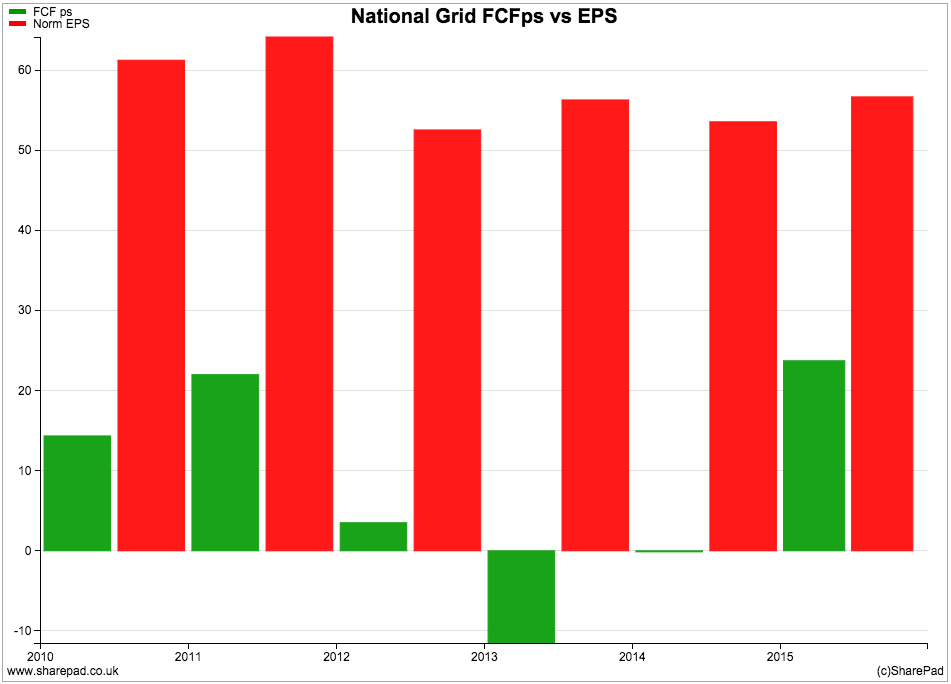
Unfortunately, National Grid has to spend lots of money to make money. A lot of the cash coming in has been spent on new assets and has been considerably more than the annual depreciation charge (in this case, not a very good estimate of how much money needs to be spent to maintain assets). This has meant that free cash flow per share has been a lot less than earnings per share (EPS) in recent times.
Is National Grid's poor free cash flow a bad sign for shareholders?
I've been writing a lot about the importance of free cash flow in recent weeks. If you are a stickler for companies that produce lots of free cash flow then you probably won't invest in utility shares like National Grid. I used to know professional fund managers who wouldn't for exactly this reason.
But utilities may be an exception to this rule.
Free cash flow will always be a little bit hard to come by when a company is spending a lot of money growing the size of a gas, electricity and water network. It doesn't necessarily mean that a company is overstating its profits and having to resort to borrowing to pay its dividend.
Back in September this year I wrote an article about how to analyse water companies (click here to read this) and explained that a company's dividend policy was based on taking a five year view of its cash flows. Essentially a company will look at its spending plans and break down its investments into an amount needed to maintain its assets (maintenance capex) and an amount needed to grow them (growth capex).
The money left over after maintenance capex can be used to pay a dividend. The company will then borrow money to finance the growth capex, safe in the knowledge that it can recover the money from customer bills in the future. This means that the lack of free cash flow is often not a problem. When I looked at UK water companies, this is what I found to be happening. What about National Grid?
Is National Grid's dividend affordable?
Ideally, I'd like to do the same kind of analysis I did on the UK water companies with National Grid. By looking at its regulatory accounts I would be able to get a good idea how much it needs to spend to maintain its grids and how much cash is left over for dividends.
Unfortunately National Grid is a bit more complicated because it earns a large chunk of its money in America where the kind of extra information I need is not very easy to find. So I am going to try and answer this all important question a different way by:
- Looking at what's happening to National Grid's cash flow on a trailing twelve month basis (TTM).
- Looking at the relationship between water companies real maintenance capex with the depreciation in their accounts and applying this to National Grid.
First of all, I can see from the SharePad table below that National Grid's free cash flow improved significantly in the year to March 2015. It is also continuing to produce free cash flow in the trailing twelve months to September 2015. This is a good sign, especially as capex has increased by a further £500m t0 £3.77bn during the last year.
But how on earth am I going to work out National Grid's maintenance capex and how much money is left over for dividends? I know that depreciation is not going to be the right number by a long chalk. I am going to have to make an educated guess. To do this I am going to compare the maintenance capex that water companies (similar grid companies with lots of assets) spend (see my article here for the figures) with the depreciation in their accounts and use that relationship as a basis for estimating National Grid's maintenance capex. This is shown in the table below.
| Company | Maintenance Capex(£m) | Depreciation (£m) | Ratio |
|---|---|---|---|
| United Utilities | 591.5 | 344.9 | 1.71 |
| Severn Trent | 456,1 | 303.1 | 1.5 |
| South West Water | 164.4 | 106 | 1.55 |
| Total | 1212 | 754 | 1.61 |
National Grid's TTM depreciation expense is £1569m. If I multiply this number by 1.61 this gives me an estimate of £2526m for maintenance capex. I can now use this number to adjust National Grid's TTM free cash flow to see how much spare cash there is to pay dividends.
| National Grid Adjusted TTM Free cash flow | £m |
|---|---|
| TTM Free cash flow | 656 |
| Add back total capex | 3771 |
| Take away maintenance capex | -2526 |
| Adjusted free cash flow | 1901 |
| Shares in Issue(m) | 3743.6 |
| Adjusted free cash flow per share(p) | 50.8p |
| 2016 forecast dividend per share(p) | 43.7p |
| Cash cost of 2016 dividend | 1636 |
| Surplus cash left after paying dividend | 265 |
If I am roughly right with my estimate of maintenance capex, then National Grid's dividend is affordable. The company has also said that it wants to grow its dividend by at least the rate of inflation until 2021. If inflation averages 2% between 2016 and 2021 then it will have to pay a dividend of 48.2p per share in 2021. This compares with estimated free cash flow per share of 50.8p now.
National Grid's current stated dividend policy looks believable too
But is the share price too frothy?
City analysts seem to think so.
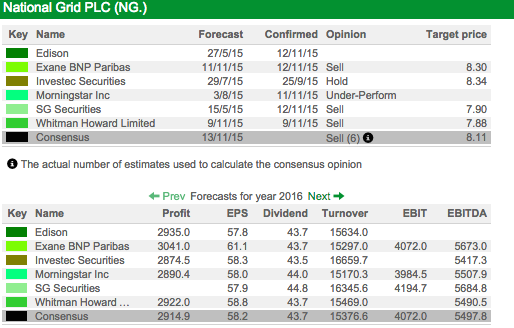
The SharePad broker tab is telling us that out of 6 analysts surveyed most of them are advising fund managers to sell National Grid shares. They think the shares should be nearer 800p than their current 905p at the time of writing.
You can have a go at working out a valuation of the shares yourself using the dividend valuation tool in SharePad.
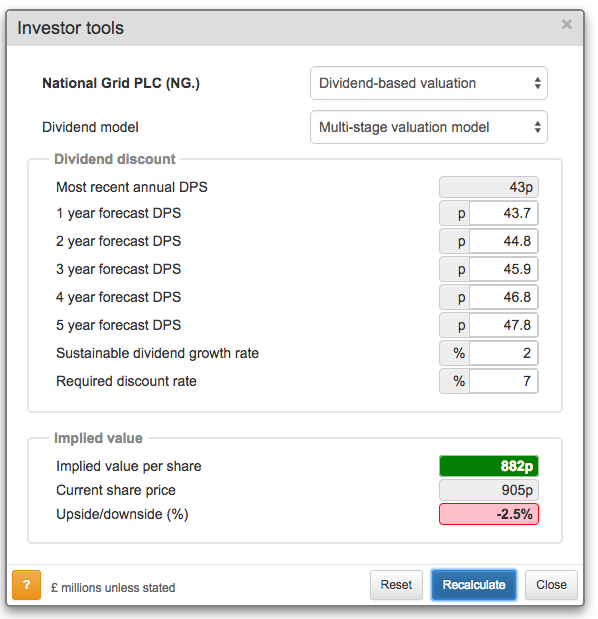
Here SharePad has taken the consensus dividend per share forecasts for the next three years. I have then added my own forecasts for the next two years by assuming dividend growth of 2% in years 4 and 5 and then assuming 2% growth forever. Assuming an investor wants a 7% return for holding the shares, these assumptions give a valuation of 882p per share - just below the current share price. This suggests the shares are currently fairly valued.
You can use this model to play around with assumptions of future dividends to see what a current share price is implying about the future. It can be a useful way to spot under or overvalued shares.
The super bullish case for National Grid shares
I used to work with a fund manager who argued that companies like National Grid were effectively as safe as bonds and should be valued like them with a lower discount rate. I'm not sure I totally agreed with him then or now. But if you believe that National Grid is a relatively safe business and can grow its dividends in line with inflation forever (because a large chunk of its profits and assets are linked to inflation) then he argued they were effectively index-linked bonds in disguise.
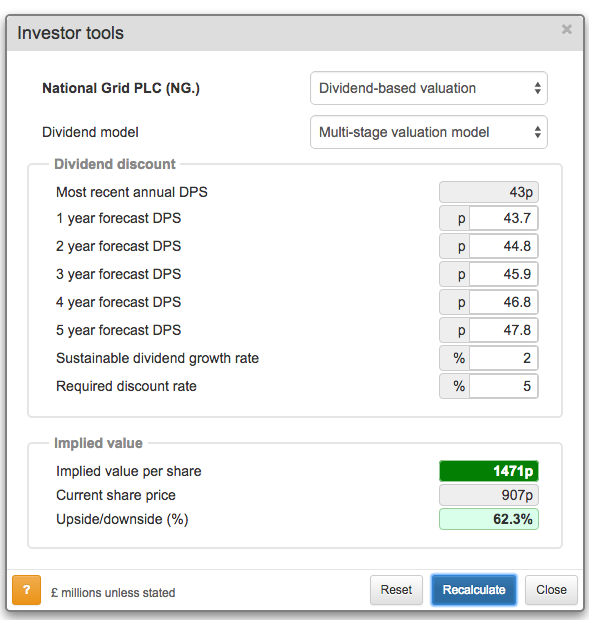
So keeping the same dividend forecasts but dropping the required return (the discount rate) from 7% to 5% gives an estimated value for National Grid shares of 1471p. The lower the discount rate the higher the valuation you will get. The stock market clearly doesn't agree with my former work colleague.
Phil Oakley

