Staying safe with AIM shares
Jim Slater once said that "elephants don't gallop". By this he meant that it is a lot easier for a small company to become a lot bigger than it is for a company that is already very big.
This is true and is why the shares of smaller companies have been good places to invest your money. They have also been good places to lose money as well. Small companies are more likely to fail than big ones. This is because they can be young businesses trying to establish themselves or corporate dinosaurs that are slowly dying.
Unfortunately, smaller companies are also more likely to be involved in dodgy accounting scandals as they tend to be less heavily scrutinised by professional investors. Sadly, this seems to happen all too often on London's Alternative Investment Market (AIM).
The reputation of AIM took a further blow last week with the suspension of shares in Globo plc (LSE:GBO), a software company. The final straw it seems was the publication of a very damning research report by a small New York hedge fund which argued that Globo's profits were essentially a work of fiction - something that some commentators on the internet have been saying for some time.
It would appear that the company's days are numbered as the administrators have been called in. Whether there is any money left over for shareholders after they have done their job remains to be seen.
Many Globo shareholders will understandably feel angry and cheated by what has happened. But they will also be asking themselves: how could I have avoided it?
In this article, I am going to have a closer look at Globo's finances and show you some of the analysis that you can do with other shares so that you can avoid the next AIM disaster.
Want to learn how to analyse shares like a professional? Download our FREE guide.
Sign-up to our mailing list to receive a PDF of our Step-by-Step Guide to Investing.
Share this article with your friends and colleagues:
Forget about profits it's all about cash flow
It's very easy to be wise after the event. That said, by taking time to study a company's finances it is possible to spot danger signs before things turn nasty. This was definitely the case with Globo as I will show.
Whilst Globo, and AIM shares in general, require a lot of careful analysis before buying them this is also true for any share that you are looking at. Crunching the numbers is important because it can keep you away from bad shares. To make money from the stock market you first have to not lose any.
One of the main reasons why investors get into trouble and buy the wrong shares is because they are too focused on company profits. This might seem like a strange thing to say because many investors are taught to look at profits and common valuations of those profits such as the price to earnings (PE) ratio.
It's very easy to understand why investors are tempted when they come across what seems to be a very profitable company like Globo trading on a very low multiple of profits (a low PE ratio).
I built the results table below in ShareScope to analyse Globo's profits for the last few years:
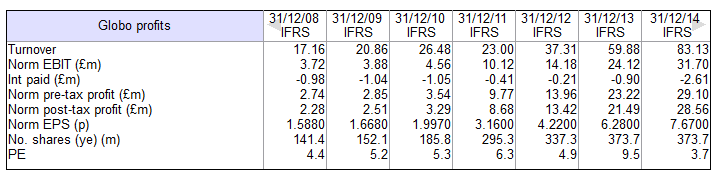
At first glance, there was a lot to like. Turnover, profits and earnings per share (EPS) had all been growing nicely. Best of all, the shares had been trading on less than four times earnings. Surely this was the kind of golden investment opportunity that we all dream about?
This was actually your first warning sign. Shares with growing profits rarely change hands for valuations as low as this. Usually, you would expect a company with these profit characteristics to have its shares changing hands at 15-20 times earnings or even more.
You needed to ask yourself why these shares hadn't been snapped up by other investors and pushed the share price higher? What had they seen that they didn't like about this company?
It's like when you come across a second hand car with very low mileage for its age. Often if it seems too good to be true it usually is. You need to do some more research. But when it comes to looking under the bonnet of companies, you won't find the answers looking at its profits. If you want to get closer to the truth you need to study its cash flow performance.
Some key cash flow measures and other important checks for Globo are shown in the customised ShareScope results table below:
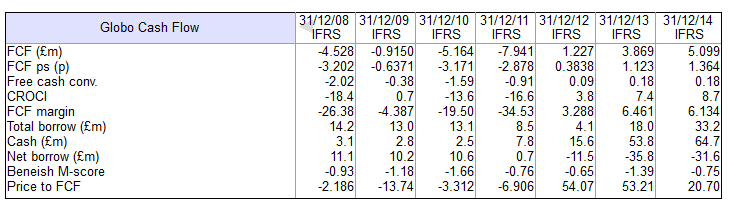
Let's have a closer look.
Profits have not been turning into cash
Very good companies turn most of their profits into cash. Sometimes there are good reasons for free cash flow (the amount of cash left over to pay shareholders) to be less than profits for a short while if a company is ramping up investment in new products or services. But sooner or later you want to see lots of cash pouring into the company's coffers.
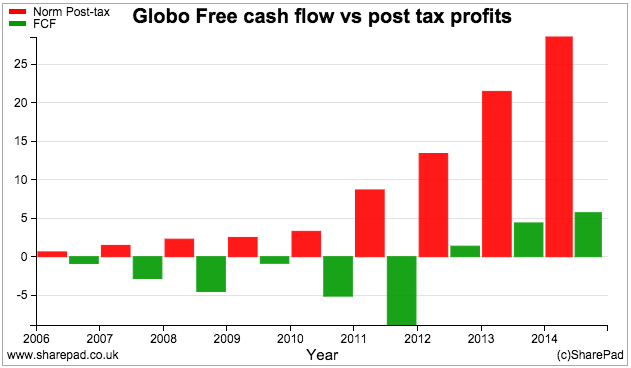
Globo's ability to generate free cash flow for its shareholders has been consistently poor. For many years cash was flowing out of the company rather than flowing in. As profits surged between 2012 and 2014, only 18% of them turned into cash (see chart below).

A failure to turn profits into cash for long periods of time is usually a sign that something isn't quite right with a company. For me, my interest in a company would probably end right here.
But why has free cash flow been so poor? A closer look at the company's cash flow statement might help to answer this question.
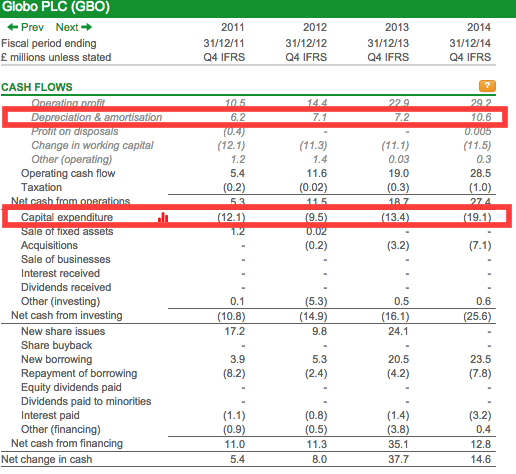
When I am looking at a company, I spend a lot of time trying to work out what its true cash profits are (for more on this click here). This means having a very close look at lines within the cash flow statement but with a particular emphasis on capital expenditure - the amount spent on new assets. I have highlighted this in the cash flow statement above from SharePad; in ShareScope you can add this line to a Results table like the ones I have shown earlier in this article.
One of the most common ways for a company to make itself look more profitable is to shift costs away from its income statement and onto its balance sheet - a process known as capitalisation of costs.
For example, a software company like Globo could decide to spread its software development costs over a number of years rather than charging them against income in one go. This would mean that only part of the cash spent on development would reduce annual profits whilst the full cost would hit the cash flow statement.
As you can see highlighted in Globo's cash flow statement above, capital expenditure has been going up and has been a lot more than the depreciation and amortisation expense in the income statement. There might be very good reasons for this but it could also be a sign of aggressive accounting and overstated profits. As an investor you want to see plenty of surplus cash flow eventually and Globo failed for many years to deliver it. Not a good sign.
Globo's cash performance was not as good as other AIM-listed software companies
When you are investing, you should always try and compare the company you are looking at with other similar ones. In both ShareScope and SharePad you can filter a list of shares to focus on a particular sector - so that you can compare them on different measures of financial performance.
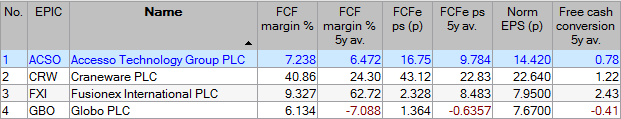
Below I take a look at Globo's cash performance and compare it with other software companies in the AIM 100 index.
Notes:
- In ShareScope Free cash conversion is not displayed as a percentage (this will be changed). The values in the table above equate to 78%, 122%, 243% and -41%.
- You will need ShareScope V7.2.0 or higher to see the FCFe, FCF margin and Free cash conversion data.
- SharePad users can use TTM values for FCFps and FCF margin.
Free cash flow margin looks at the proportion of a company's turnover that is converted into free cash flow. Very profitable software companies do not generally have to invest a lot of money in new assets so they should be able to turn a high proportion of turnover into free cash flow. Here Globo scores badly on this measure compared with Craneware and Fusionex International, especially when you extend the analysis out over five years.
The same is true of free cash flow conversion which compares free cash flow per share with EPS. The other three companies have been good at turning EPS into free cash flow per share (a high rate of free cash flow conversion) averaged over five years. Globo has not. This kind of analysis should be telling you that Globo isn't as impressive as other software companies which might be reason enough to ignore its shares. Or it is flagging up that something isn't quite right.
Globo's shares were expensive not cheap
Globo's free cash flow performance had been suggesting for some time that its profits might not be as high as it was telling people. This means that the shares weren't really cheap trading on a PE of under 4. They were in fact very expensive, trading on a price to free cash flow multiple of over 20. Buying expensive shares rarely pays off in the long run.
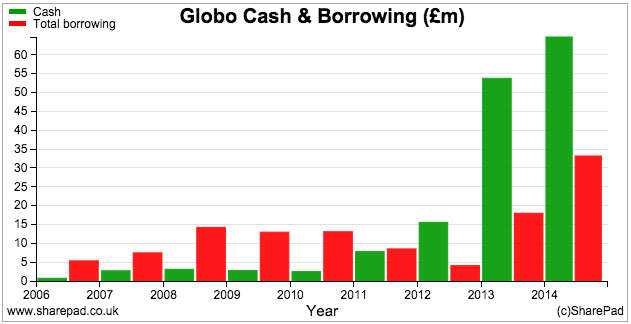
Total borrowing and cash balances rising at the same time
In the cash flow table above, you can see that Globo's cash balances and borrowings have been going up at the same time. At the end of 2014, it had more cash than borrowings giving net cash of £31.6m - something that in isolation would be seen as a sign of health.
Take a closer look at the cash flow statement and you can see that there have been some strange goings on.
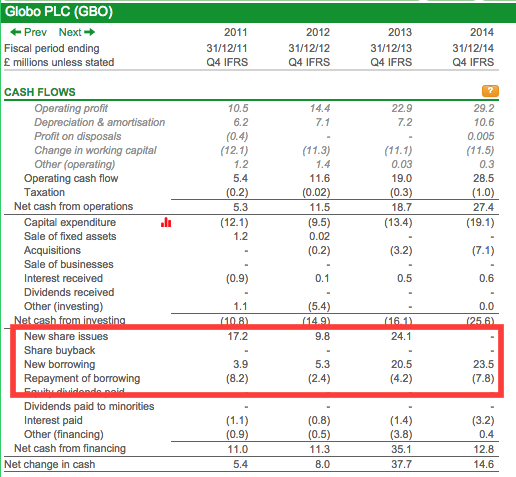
Why on earth has a supposedly very profitable company been borrowing more money? Even more intriguing is that it has also raised more than £50m of fresh cash in recent years by issuing new shares.
Yet Globo has a net cash balance so normally you wouldn't expect this. One thing worth remembering is that the cash balance is shown on one day at the end of the year. Companies usually try and show their balance sheet in the most favourable light. It is not uncommon for companies (tour operators like TUI and Thomas Cook spring to mind) to have net debt (more debt than cash) for most of the year but have their financial year end when cash balances are at their highest.
However, Globo hasn't been spending a lot of money buying new companies or repaying large amounts of maturing loans. Why does this company need to keep raising more cash? This doesn't look right. Perhaps there wasn't enough cash flowing into the company?
The Beneish M-Score has been screaming "profit manipulator" for years
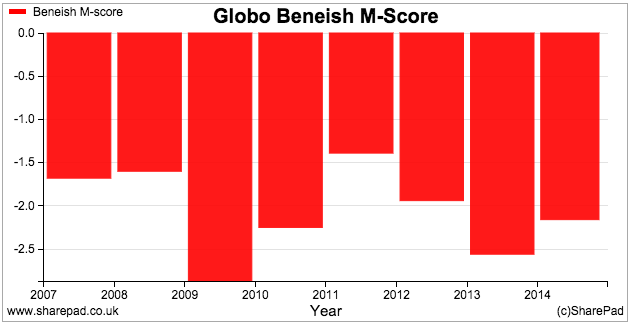
The M-score is a test to see whether a company might be manipulating profits and making itself look more profitable than it really is. To read more about this click here.
The rule with the M-score is that a figure above -2.22 (less negative than -2.22) is a sign of possible profit manipulation. Globo's M-Score has been suggesting that this has been the case for five of the last eight years (including three of the last four).
AIM's best cash converters
My own personal investing strategy is heavily based on a company's free cash flow performance. I don't trust earnings as much as cash flow. I want to buy the shares of cash generative companies as cheaply as I can.
I pay particular attention to the following measures to help focus my research:
- Free cash flow margin - how much turnover is turned into free cash flow. The higher this number the better. I also look at this measure averaged over five years. I want to see a consistent track record of turnover being turned into free cash flow.
- Cash return on capital invested (CROCI) - a company's free cash flow return on capital employed as a percentage. Higher is better. I want to see consistency over at least five years.
- Free cash flow conversion - high percentage of profits turned into free cash flow.
- Capex to depreciation - I want to get a feel of how much a company needs to spend to stay in business and whether it is spending too much or too little. Ideally, I want to invest in companies that don't have to plough lots of cash flow back into their businesses to maintain and grow future cash flows.
- Price to free cash flow - can I buy the shares for a reasonable multiple of free cash flow - the lower, the better.
- Does the company pay a dividend? This can often be a sign that there is good underlying cash generation. Over the long run you need free cash flow to pay dividends
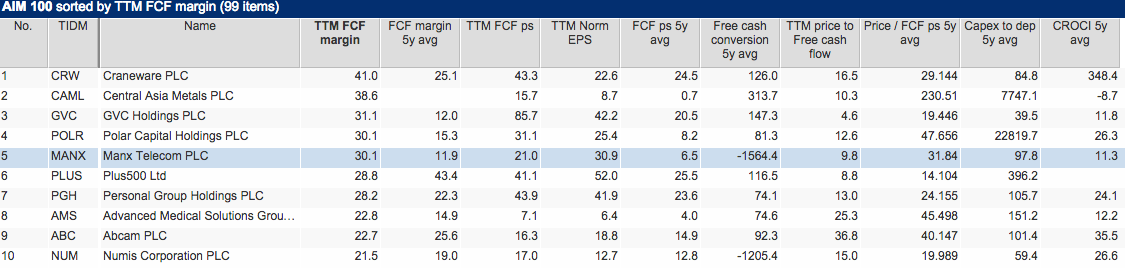
I've ranked the AIM 100 shares based on their current free cash flow margin. Here's how the top 10 stack up. The ones with the lowest Price to FCF are the cheapest.
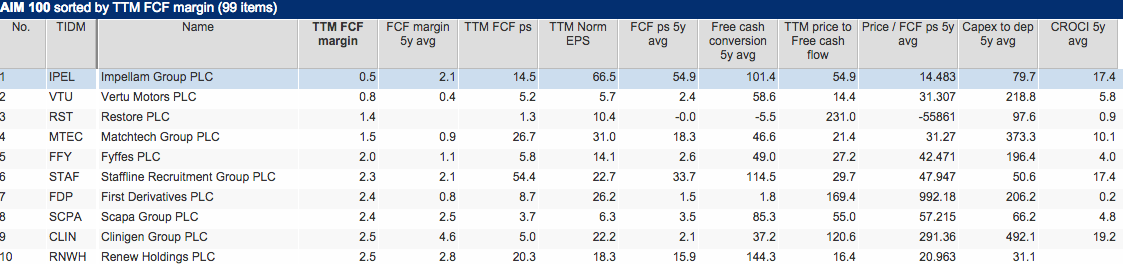
Here's a list of those companies that don't score as well based on their current free cash flow margins. This doesn't mean they are bad companies but if you own them it might be worth doing a bit of digging to find out what's going on.
I own shares with low free cash flow margins but they do have good track records of turning profits into cash.
To sum up
- Free cash flow is a much better measure of company performance than EPS.
- Good companies consistently turn most of their profits into free cash flow. Bad ones usually don't.
- Capex is the key number in free cash flow analysis. It's often where you will find evidence of dodgy profits.
- Study other parts of the cash flow statement such as the change in borrowings and new share issues to find out why a company might need to raise cash.
- The Beneish M-Score can be a good indicator of profit manipulation.
- These measures alone are not evidence of a bad company, but pointers as to how to focus your research. You might just want to move on to another share.
If you have found this article of interest, please feel free to share it with your friends and colleagues:
We welcome suggestions for future articles - please email me at analysis@sharescope.co.uk. You can also follow me on Twitter @PhilJOakley. If you'd like to know when a new article or chapter for the Step-by-Step Guide is published, send us your email address using the form at the top of the page. You don't need to be a subscriber.
This article is for educational purposes only. It is not a recommendation to buy or sell shares or other investments. Do your own research before buying or selling any investment or seek professional financial advice.

