Are a company's profits believable?
When you are weighing up a share of a company its profits are likely to pay a big part in the decision making process. It's important that you can trust the profit figures that are found in the company's financial statements. If they turn out not to be as good as they first appear then you stand a good chance of losing money from your investment rather than making some.
The good news is that accounting standards are a lot more rigorous than they used to be. This means that in most cases you can believe in the profits that companies report. That said, there is still scope for companies to bend the rules and deceive people.
The problem facing most investors is that they only tend to find out about a company's dodgy accounting when it is too late when there is a spectacular collapse in profits that reveals this. Forearmed is forewarned. Being able to spot companies that might be manipulating their profits can save you a lot of pain later on.
It can also be used as an investing strategy in itself by allowing you to bet on the price of a share falling when the ability to manipulate profits runs out and comes to an end. However, it can sometimes take a long time for a company to run out of road with this.
So how do you go about spotting companies where the profits might just be too good to be true?
Want to learn how to analyse shares like a professional? Download our FREE guide.
Sign-up to our mailing list to receive a PDF of our Step-by-Step Guide to Investing.
Share this article with your friends and colleagues:
Introducing the M-Score
The financial accounts of companies are packed full of numbers. These numbers can be played around with to paint a picture of a company's financial health. The most common way this is done is with financial ratios where one number is compared with another. You will find lots of useful ratios in SharePad and ShareScope.
The numbers in accounts have also provided a playground for academics who try to use them to develop formulas which spot trends that can help investors. The most commonly used formulas are Altman's Z-Score (used to spot companies with weak finances) and Piotroski's F-Score (used to spot companies with improving finances).
Back in the late 1990's Messod Beneish of Indiana University made a mathematical model to weed out companies who might be fiddling their profit figures. It was based on eight different financial ratios that could be used to look for signs of profit manipulation. All the information needed can be found in a company's annual report.
Beneish created an index for each of eight ratios and added them all together to come up with what he called the M-Score. It is based on similar principles to Altman's Z-Score. An M-Score greater than a certain number would be a sign of potential earnings manipulation and would need further investigation. But can you really use a formula to sport a company with dodgy accounting?
The technical stuff: How to calculate a company's M-Score
The M-Score places a heavy emphasis on accounting accruals (where income or revenue is matched against the costs of making it) which can be used to manipulate profits. In particular it is looking at revenues that have been earned but the cash has not been received. It also looks at expenses that have been incurred but not yet paid for.
The M-Score is made up of eight different indices based on the changes in the selected accounting ratios from one year to the next. These are described below.
This is quite in-depth, but very useful stuff. Don't get overly concerned about the calculations as SharePad/ShareScope does this all for you.
| DSRI | Days' sales in receivables index | This looks at the amount of sales made on credit but not received as cash. Companies can appear to be growing very quickly if they offer more generous credit terms. To calculate the index take accounts receivable/sales for the current year and divide it by the same calculation for the year before. A number greater than 1.0 might be easily explained or could indicate that revenues are being inflated. |
|---|---|---|
| GMI | Gross margin index | Gross profit is defined as sales less the cost of goods sold. Here take the gross profit margin (gross profit/sales) for the previous year and divide by the ratio for the current year. If gross margin has fallen the index will be greater than 1 and indicate poor prospects. This might make companies more likely to manipulate profits. |
| AQI | Asset Quality Index | This looks at the ratio of non current assets excluding property, plant and equipment as a proportion of total assets in the current year compared with the previous year. A number greater than 1 might indicate that a company has increased assets by putting costs on its balance sheet rather than expensing them against income which might be a sign of dodgy profits. |
| SGI | Sales growth index | Divide current sales by last year's sales. Companies with rapid sales growth are more likely to manipulate profits. |
| DEPI | Depreciation index | Look at the ratio of depreciation to gross fixed assets this year compared with last year. A number greater than 1 might suggest an increase in asset lives which would lower depreciation and boost profits. |
| SGAI | Sales, general and administrative expenses index | Looks at the change in the SG&A expense as a percentage of sales compared with last year. If the index is greater than 1 it might be seen as a sign of deteriorating prospects. |
| TATA | Total accruals to total assets index | Accruals are defined as working capital less cash (current assets less cash minus current liabilities). Higher accruals are associated with potential profit manipulation. |
| LVGI | Leverage index | Measures the ratio of total debt to assets compared with the previous year. An increase in leverage might make a company more prone to profit manipulation. |
Beneish then used all these indices with the following formula:
M = -4.84 + 0.92DSRI + 0.528GMI + 0.404AQI + 0.892SGI + 0.115DEPI - 0.172SGAI + 4.679TATA - 0.327LVGI.
According to Prof. Beneish, a score greater than -2.22 (a less negative number) may be a sign that a company's profits have been manipulated and requires further investigation.
The M-Score spots Enron before trouble strikes
Calculating the M-Score for Enron between 1999 and 2000 gives a figure of -0.55 indicating the potential for profit manipulation. This was proved right in 2001.
| Index | Factor | Value | Sum |
|---|---|---|---|
| Constant | -4.84 | ||
| DSRI | 0.92x | 1.365 | 1.256 |
| GMI | 0.528x | 2.144 | 1.132 |
| AQI | 0.404x | 0.771 | 0.311 |
| SGI | 0.892x | 2.513 | 2.242 |
| DEPI | 0.115x | 1.11 | 0.128 |
| SGAI | 0.172x | 0.378 | -0.065 |
| TATA | 4.679x | -0.058 | -0.271 |
| LVGI | 0.327 | 1.354 | -0.443 |
| M-Score | -0.55 | ||
There is a five variable version of the M-Score as well which focuses on the measures that were deemed to have more relevance in detecting profit manipulation.
M = -6.065 + 0.823*DSRI + 0.906*GMI + 0.593*AQI + 0.717*SGI + 0.107*DEPI
How useful is the M-Score?
Beneish revisited his M-Score in 2008 as a trading strategy. He ranked companies by their M-Scores between 1993 and 2003. Companies with the healthiest M-Scores were bought and the least attractive were shorted (they were sold with the hope of buying them back at a lower price to make a profit). The strategy produced annual returns of 14%. Using the five variable model M-Score produced returns of 14.8%.
The M-Score could be a useful trading strategy, but it's important to remember that it's very rare to find something that works all the time in investing. There are very few hard and fast rules when it comes to measures such as this. Like most ratios or formulas I think they are best used as a way of finding things to investigate and in this respect the M-Score could be a very useful part of your investing toolkit.
You can find a company's M-Score in seconds in SharePad and ShareScope. I've set up a quick filter for shares in the FTSE 350 below and asked SharePad to give me a list of companies with an M-Score of more than -2.22 which would put them into Beneish's danger zone.
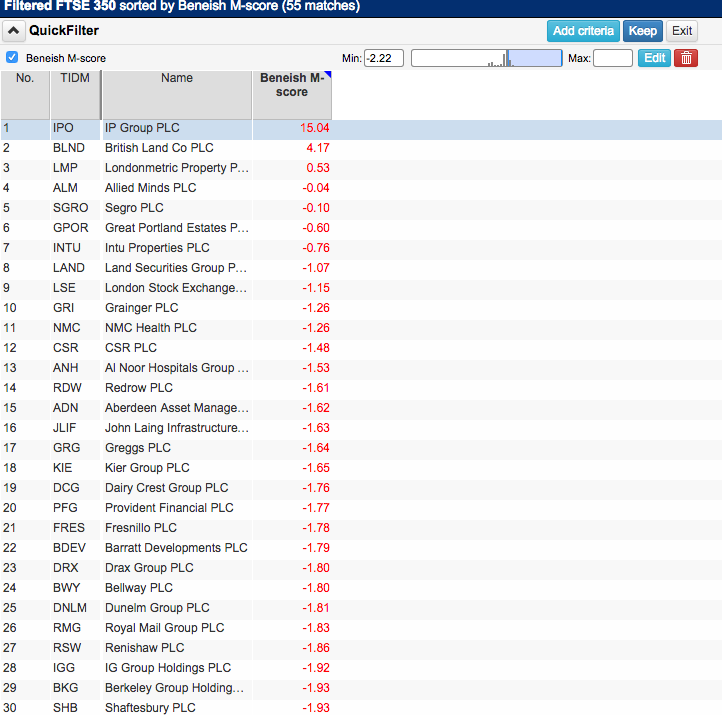
According to SharePad there are 55 companies which are more likely to be manipulating their profits. I've listed the top 30 here. This is a surprisingly big number. Surely this can't be true? These are big companies covered by lots of professional analysts who would have spotted that something wasn't quite right, surely?
I think it's unlikely that all these companies are manipulating their profits. Having said that, it doesn't mean that there aren't plenty of cases of aggressive accounting out there.
Based on my experience of being a professional analyst, I know that lots of my peers never really got into the nitty-gritty of checking whether the profits were believable or not. And even if they did find something wrong it probably wasn't in their best interests to say too much about it. Companies and professional analysts don't tend to like analysts who peddle bad news.
So, just because a company is reasonably big it doesn't mean there cannot be anything amiss with its profits. I came across many companies whose profits were signed off by their accountants but in reality did not seem to make much sense.
I think the M-Score can be a useful test to see if something is not quite right with a company's profits. You should see it as being similar to a blood test in a human where lots of diagnostic screens are run to check for problems. You then investigate further based on what the test tells you.
Interpreting an M-Score
It's important to look behind the numbers in the M-score rather than just the number itself. You need to know what is pushing a company into the danger zone. In ShareScope, moving your mouse cursor over the Beneish M-Score for a company will reveal a breakdown of how it was calculated (In SharePad, you'll need to click on the value).
Here are the figures for Greggs plc:
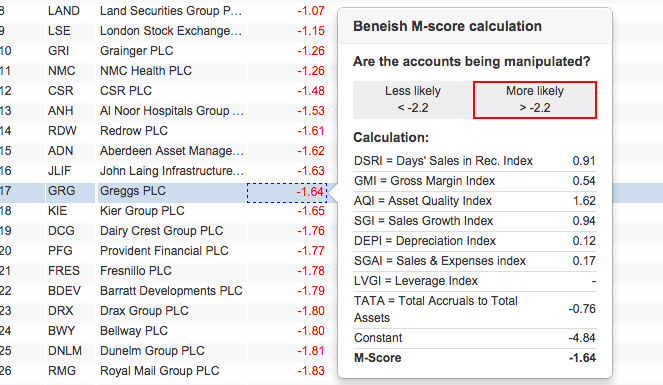
Remember, every M-Score starts off with a constant (minus 4.84). Any negative index score improves the M-score (such as TATA in the case of Greggs) whereas any positive index score makes it worse.
In Beneish's original study he gave the scores for each of the eight variables that might have indicated that a company was manipulating its profits. These scores are shown in the table below. If a company has a score above these on any particular index then perhaps you need to do some more digging to find out what is really going on.
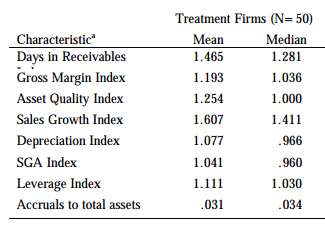
In the case of Greggs, it would seem that only the Asset quality index is suggesting a cause for concern. You need to go and find out if the company is capitalising costs (putting them on the balance sheet) instead of expensing them against profits. There are other checks you should carry out too.
Other things you can do
The M-Score may be telling you to look at a company's profits more closely. It should not be seen as a definite statement of profit manipulation. I think that there are other measures that you should look at that can shed more light on this issue. Here are three key measures that will give you a good feel for the integrity of a company's profits:
- The conversion of profits into cash
- The ratio of debtors to revenue/sales - this is part of the M-Score as well.
- The ratio of stock/inventories to revenue/sales.
Free cash flow
Beneish's M-Score doesn't include any cash flow analysis at all. I see this as a major drawback of the measure. One of the most simplest and powerful ways to check on the quality of a company's profits is to see how much of it turns into cash - cash that can paid out to shareholders or free cash flow. (For more on free cash flow click here)
You can easily check this out in SharePad by looking at the cash flow ratios section. By dragging the data across to the right hand side of the page you can see a chart of the measure you are interested in.
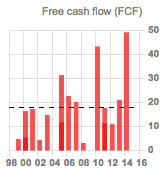
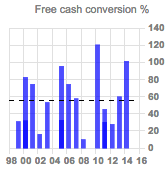
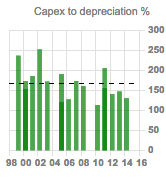
With Greggs plc, I've decided to focus on whether the company has a track record of generating surplus or free cash flow. I then compare free cash flow with post-tax profits (free cash conversion). Finally, I will look at how much cash is being spent on new assets (capex) and compare that with the depreciation expense in the income statement which is a proxy for how much needs to be spent to maintain a company's assets.
I can see that the company does tend to generate some free cash flow which is a good sign. That said, it does tend to move up and down a lot. There is no consistent trend. Free cash flow is more meaningful when compared with post-tax profits.
Here, you can see that the ratio of free cash flow to post tax profits. In 2014, all of Greggs' post tax profits were converted into free cash flow which is encouraging. The black dashed line shows you that the average rate of free cash flow conversion from post tax profits has been 60%. That's reasonable but not great.
This chart probably explains why free cash conversion has been less than 100%. Greggs consistently spends more on new assets than the depreciation cost in its income statement - an average of 150%. This might be because it has been expanding rapidly or it might be because the depreciation charge is not high enough and profits are overstated.
As always, remember that we are looking at what has happened in the past here and using it as some kind of guide as to what might happen in the future. This is not always wise, companies and their business strategies can and do change. Greggs could be scaling back its spending on new assets and could be about to become an impressive generator of cash. That's why you need to read the company's latest financial report to find out what's going on.
Two very important ratios - debtors and stocks
One of the best ways to spot a company where profits may be heading down is to look at the trend of trade debtors (money owed by customers) and stocks (finished goods and raw materials) to sales. If trade debtors or stocks are increasing at a faster rate than sales then you should find out why because it could be a sign of trouble ahead. This type of analysis is more applicable to manufacturers than a sandwich shop. You can do this easily in SharePad.
Increasing trade debtors relative to sales shows that a company is selling more on credit. This might be because trading conditions are tough or could be a sign of an overly aggressive selling strategy to boost short-term profits. If you see the ratio of trade debtors to sales increasing you need to investigate why. Get hold of a copy of the company's latest accounts and look at the note explaining debtors. Pay attention to the possibility that some of these debts will not be paid which will reduce future profits.
High stocks as a proportion of sales is also a warning sign. Companies build up their stock levels in anticipation of selling them in the future. But if they can't be sold fast enough, selling prices have to be cut or stock values have to be written off which means lower profits. The bigger the stockpile the more likely this is.
Companies can also allocate the costs of making goods - labour and general overheads - to the value of stocks on their balance sheets. This always raises the possibility that profits can be boosted by allocating costs to stock rather than expensing them through the income statement. This is another reason for you to be wary of rising stock levels.
Diageo - a case of too many stocks and debtors?
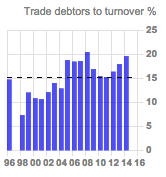
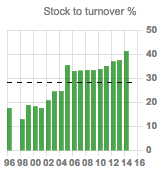
Diageo - the maker of some of the world's most famous alcoholic drinks - has been going through a tough time recently. It has been selling fewer products and profit forecasts have been coming down. Could you have spotted this by looking at the trends in trade debtors and stocks?
Back in 2010, trade debtors as a percentage of sales was 15%. Last year this had risen to 20%. You need to find out why. It might have been caused as a result of buying businesses or it could be that Diageo has been trying to do too much or "overtrading".
Stock levels have gone through the roof in recent years. In 2010 they were 33% of sales. In 2014, that figure had increased to over 41%. Recently, Diageo has been commenting on customers running down their stocks as a reason for sluggish new sales. Is Diageo producing too much or is there a reasonable explanation for this trend?
Conclusion
As you can see, you have all the data you need in SharePad (or ShareScope) to perform a thorough analysis of a company and make a considered investment decision. Yes, I have years of experience which help me to do this quickly but just as I learnt how so can you. My weekly articles and my Step-by-Step Guide are here to help you achieve this and please feel free to email me at analysis@sharescope.co.uk with any questions or suggestions for future articles.
If you have found this article of interest, please feel free to share it with your friends and colleagues:
We welcome suggestions for future articles - please email me at analysis@sharescope.co.uk. You can also follow me on Twitter @PhilJOakley. If you'd like to know when a new article or chapter for the Step-by-Step Guide is published, send us your email address using the form at the top of the page. You don't need to be a subscriber.
This article is for educational purposes only. It is not a recommendation to buy or sell shares or other investments. Do your own research before buying or selling any investment or seek professional financial advice.

