How to analyse low PE shares
Buying very cheap shares is a popular investing strategy. One way of identifying cheap shares is to look for those with very low share prices compared to their earnings per share (i.e. low PE ratios). Practised with a little care and attention, low PE investing can work well.
Unlike expensive shares - ones with high PE ratios - which are very dependent on rapid profits growth to justify their high valuations, no-one expects too much from cheap, low PE shares. With high PE shares though, if something goes wrong and profits don't grow as quickly as people expect, the share price can fall a long way and investors can be left nursing heavy losses.
Low PE shares attract investors because they think that the chances of losing lots of money are low. This is because the low share price signifies that investors think the company will struggle to grow. But the chances of making big money are good if profits recover. That's because new investors will buy the shares as profits rise and push the share price up. It's not uncommon for shares to multiply in value several times over if this happens. This happens due to a combination of higher profits and a higher PE ratio placed on those profits by the stock market.
A word of warning: the stock market is followed by a large number of very smart and well-informed people. Shares usually trade on a low PE ratio for very good reasons. The main reason is because they are associated with bad businesses. A low PE is quite often a very fair value for a bad business and means that its shares can look cheap but stay cheap.
The main rule with low PE investing is to try and find shares that have been treated too harshly by the stock market. Companies which can recover and grow again but which have failed so far - witnessed by their low PE - to convince the market.
If you run a simple filter in ShareScope or SharePad for low PE shares you will find lots of them. But how do you work out if the share is a dud or a potential five or ten bagger? In this article I am going to run the slide rule over Trinity Mirror (LSE:TNI) - a share with a low PE of just over 4 times - and show you some of the things that you might want to consider when you come across a low PE share.
Want to learn how to analyse shares like a professional? Download our FREE guide.
Sign-up to our mailing list to receive a PDF of our Step-by-Step Guide to Investing.
Share this article with your friends and colleagues:
Getting started
One of the first things I do when I start looking at a share with a low PE is to look at its price chart. Ideally I'll get ShareScope or SharePad to show me what's been going on with the share price for the last ten years. Here is Trinity Mirror's ten year share price chart.
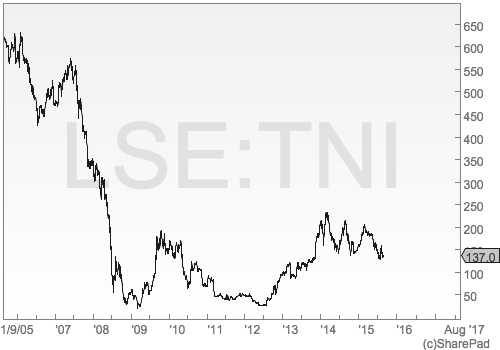
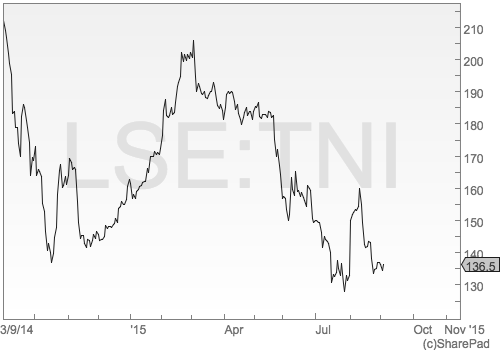
Immediately you can see that this company has suffered a very sharp fall in grace from the end of 2007 until early 2009. There's nothing too exceptional about this as many shares experienced the same fate due to the financial crisis. What is interesting is that the share price has struggled to recover and has seen a big fall and lots of volatility (meaning its share price has moved up and down a lot) during the last year (see below). This is clearly a company that investors are worrying about.
The next check is to see if the company has always traded on a low PE ratio. If it has then the current low PE might not be anything out of the ordinary. By looking at the historic PE ratio of a share we are getting another view of how the stock market has viewed the company's future prospects over time which is a more revealing than just looking at the share price chart alone.
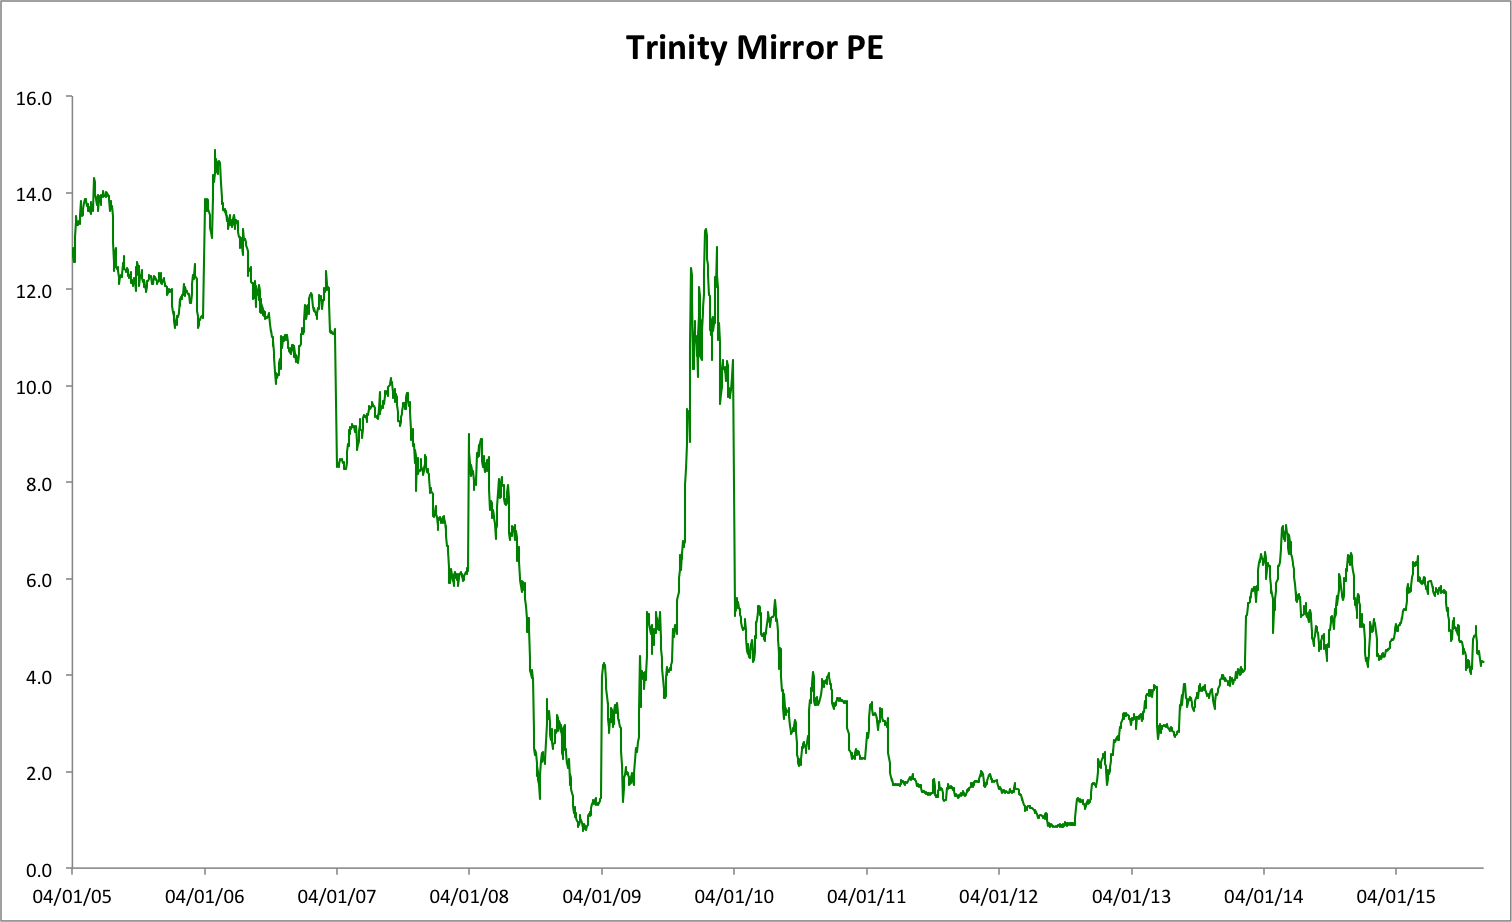
Ten years ago, the market was much more upbeat on the company and priced the share at between twelve and fourteen times its annual earnings per share (EPS). The PE plummeted to under two times in 2009 and then spiked presumably due to hopes of a recovery in profits. Since 2012, the shares have traded in a PE range of between two and six times.
Why the PE is so low
One of the great things about SharePad and ShareScope is the ability to go back and study a company's financial history. You can go back twenty years if you want to but I usually find ten years is plenty for most companies.
I then set up a results table in ShareScope (we will be adding this feature to SharePad shortly) so that I can concentrate on some key areas of financial data. When it comes to Trinity Mirror's history the reasons behind its fall in share price and PE ratio are staring you in the face.
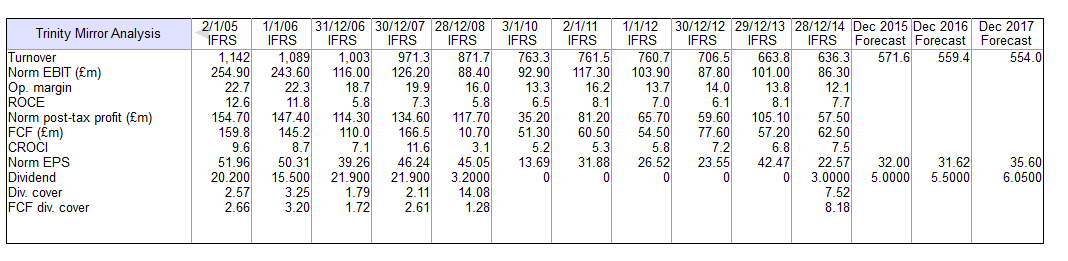
Turnover - the lifeblood of any business - and profits have collapsed. If City analysts' forecasts are correct then Trinity Mirror's turnover in 2015 will be half of what it was ten years ago. Profits will have fallen by even more.
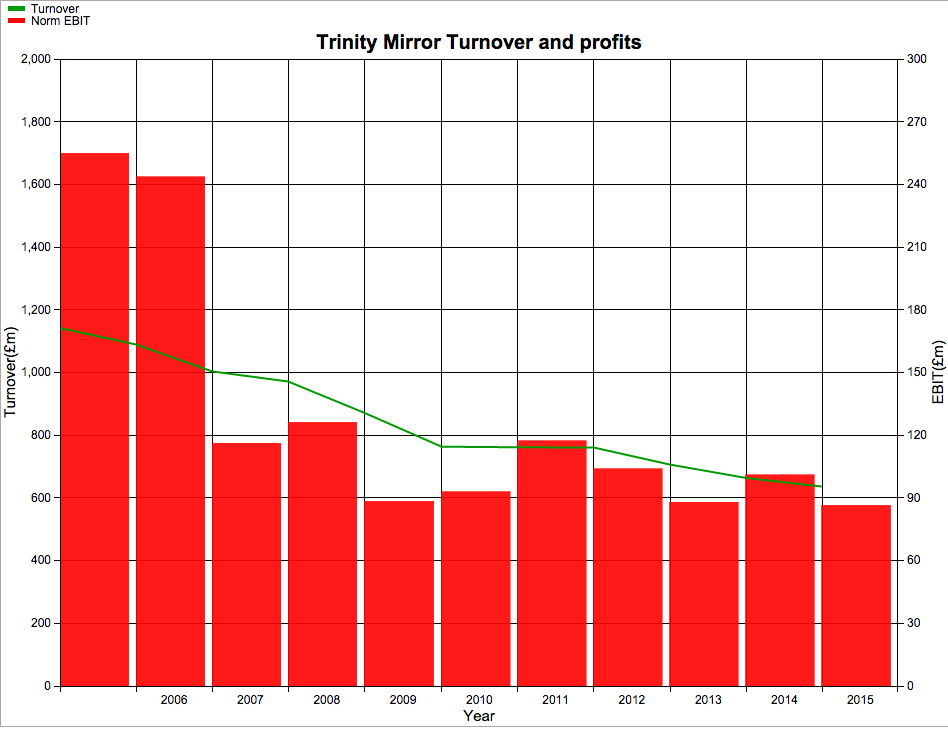
It seems that the newspaper industry is facing a battle to survive. As more of us take to the internet to read the news, less people are buying the Daily Mirror, The Sunday Mirror and the company's regional newspapers. Even though the cover prices have gone up a lot it has not been enough to preserve the levels of income coming into the business.
The real hammer blow has come from the loss of advertising revenue as more eyes are looking at computer screens rather than a newspaper. This trend is showing no signs of slowing down at the moment which has worrying implications for the future profits of the company.
As a result, Trinity Mirror's return on capital employed (ROCE), which was not that impressive anyway, is now in single digits which tells you a lot about the poor state of the business.

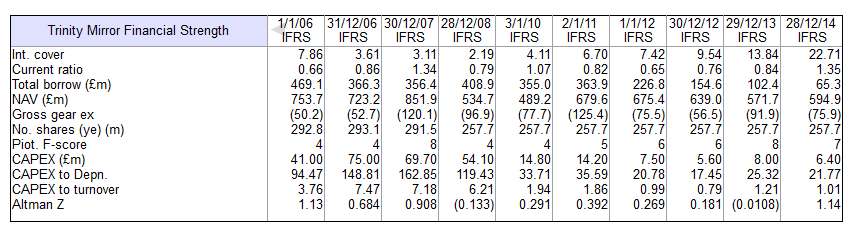
Other tell-tale signs of distress are the fact that the dividend was scrapped completely in 2010 and only reinstated last year.
The Altman Z-score is also telling us that this may be a company in trouble. A score below 1.8 is can be seen as a sign of financial problems ahead with Trinity Mirror firmly in the danger zone on this measure.
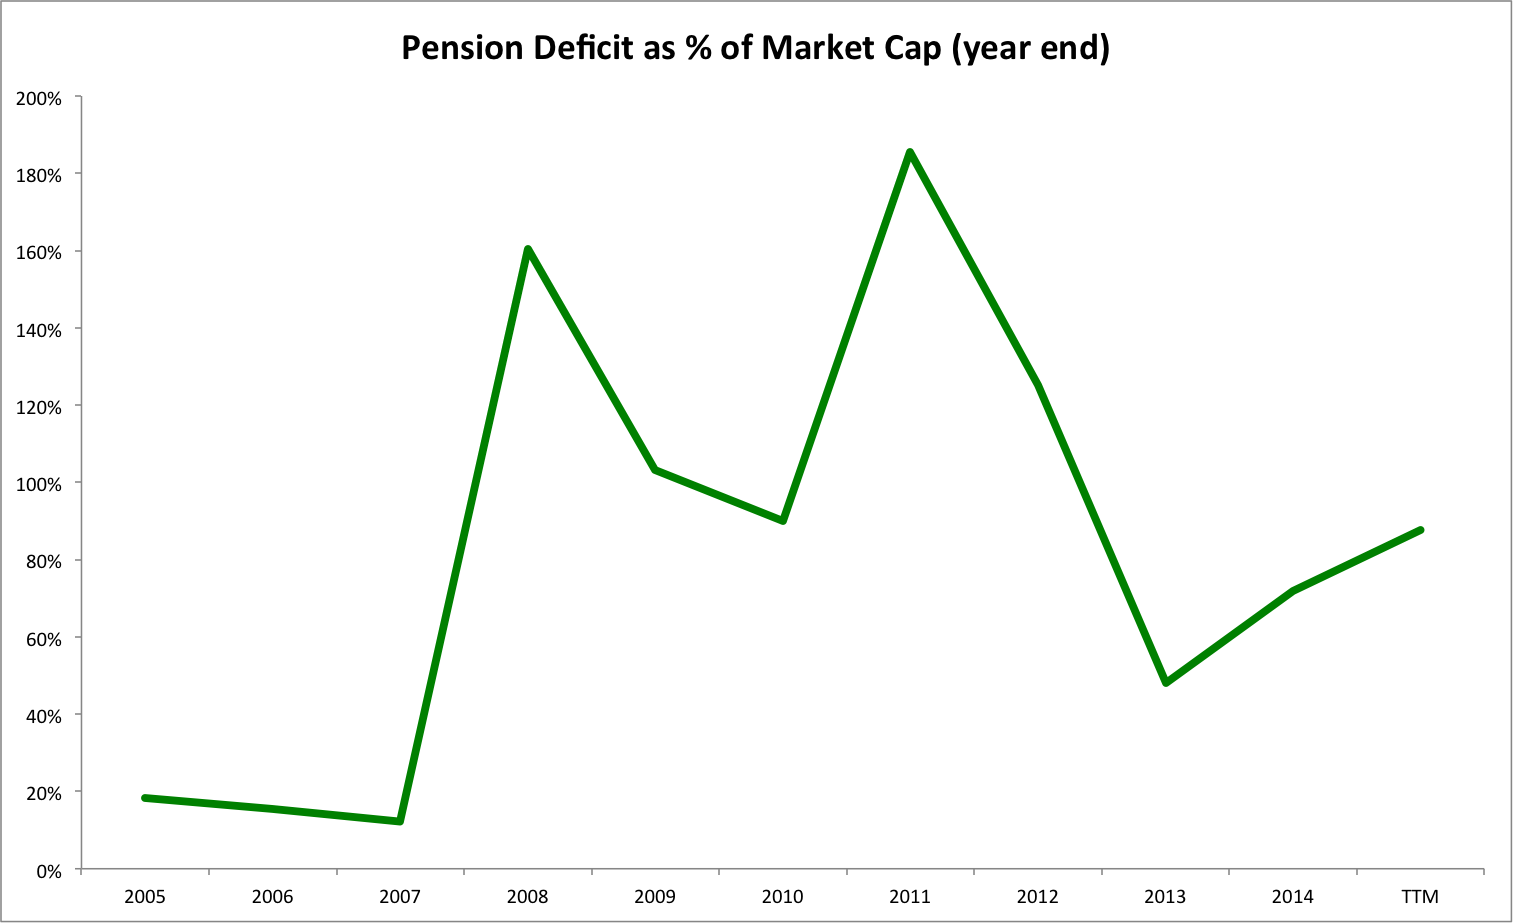
Last but not least, the company is burdened by the costs of a final salary pension scheme. The liabilities of the scheme (the future pension payments to its past and current workers) are £300m more than its assets. This deficit is almost as big as the company's market capitalisation (the value of all its shares on the stock exchange) and has at times been bigger. If company profits fall sharply in the future and/or the investment markets fall in value then this is the kind of liability that could swallow up the company and lead to lots of sleepless nights for shareholders.
Can the company recover?
This is the key question. Whilst the company is dealing with lots of challenges, there are a few things to cheer about.
Whilst the pension fund deficit is large and a big millstone around the company's neck, Trinity Mirror announced last month that it now has a net cash position (it has more cash than borrowings) for the first time ever. It has to repay all its outstanding loans in 2017 and looks like it should be able to do that. This is good news and reduces the risks to shareholders a little bit.
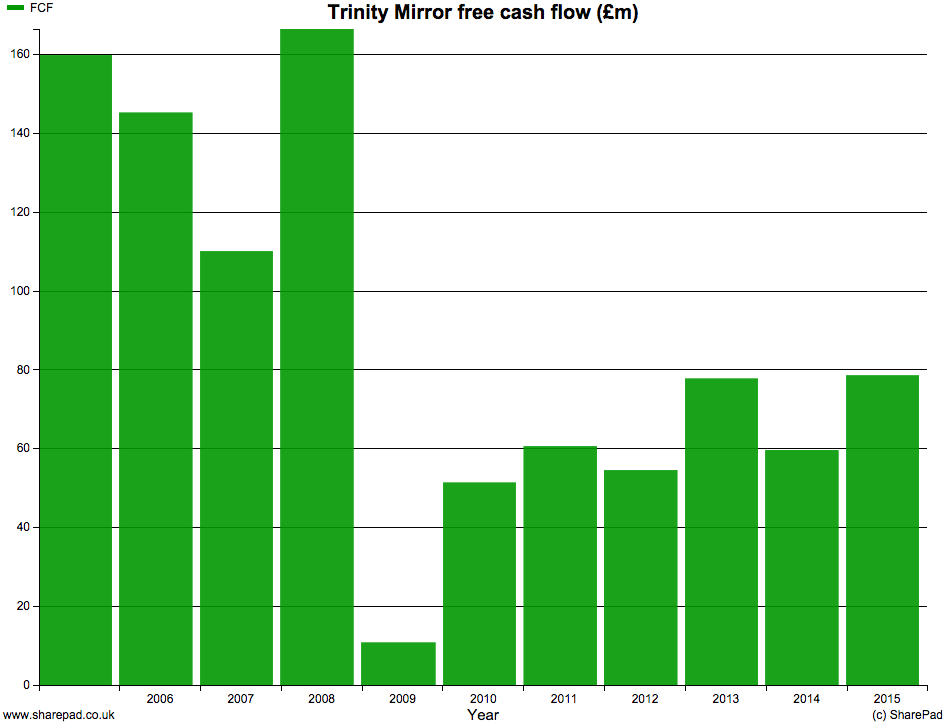
The other good news is that the company has always been good at generating free cash flow. At the moment that free cash flow should be sufficient to pay the large sums needed to plug the hole in its pension fund and a dividend to shareholders.
But how sustainable is the company's cash flow?
The company is slashing costs to keep pace with the sharp falls in turnover still being experienced by its newspaper publishing business (which still accounts for the lion's share of the company's turnover) and this is keeping profits relatively stable for now. How long it can keep cutting costs for is debateable. One thing for sure is that sooner or later a business runs out of costs to cut. To give potential investors the confidence that the business has a viable future it needs to start growing its turnover again.
Digital revenues (from the internet) are growing strongly but the problem is that they remain a very small part of the total business and the competition for online advertising remains fierce. It seems that Trinity Mirror has a tough job on its hands keeping hold of the profits it is already making. This perhaps explains more than anything else why the PE of its shares remains so low.
But is the stock market still too pessimistic?
A forecast PE ratio of just 4.3 times is a very low valuation. If I look at SharePad and Trinity Mirror's investor relations webpage it seems that City analysts are expecting EBIT and EPS to be fairly stable at around £100m and 32p respectively.
There are a number of ways to look at this situation. For example, if EPS can remain stable at 32p for the foreseeable future then someone paying 137p for a share would be getting their money back in just over 4 years which seems quite compelling.
EBIT yield (EBIT/Enterprise value) is my favourite valuation multiple for reasons that I have explained elsewhere. SharePad is telling me that this is currently 13.4% based on trailing twelve month profits to the end of June 2015 which doesn't look too bad.
If I want a very conservative measure of enterprise value I should treat the pension fund deficit of £308m as a form of debt and add it to the current enterprise value. This would give me an adjusted enterprise value of around £670m. With 2015 forecast EBIT of £100m this gives an EBIT yield of 14.9% which again on the face of things looks attractive.
That said, the big fear with this company is that EBIT of £100m and EPS of 32p are not sustainable for the long-term. If they were, then Trinity Mirror shares look to be a potential bargain. But what if sustainable profits were going to be a lot lower? How much would Trinity Mirror's shares be worth then?
Estimating Trinity Mirror's earnings power value
I've recently written about how you can work out the value of a company assuming a level of profits continue forever (click here). It's called earnings power value (EPV).
| Trinity Mirror EPV (£m) | Current | Half Current |
|---|---|---|
| EBIT | 100 | 50 |
| Tax rate | 20% | 20% |
| Tax on EBIT | -20 | -10 |
| Post tax EBIT(A) | 80 | 40 |
| Required Return(B) | 12% | 12% |
| EPV of whole business (A/B) | 666.7 | 333.3 |
Take away: | ||
| Net debt (assumed to be zero) | 0 | 0 |
| Pension fund deficit | -308 | -308 |
| Minority interest | 0 | 0 |
| Preferred equity | 0 | 0 |
| Equity Value | 358.7 | 25.3 |
| Share in issue(m) | 257.7 | 257.7 |
| Value per share(p) | 139 | 10 |
| Current price(p) | 137 | 137 |
| Difference | 1.60% | -92.80% |
Values per share at different interest rates | ||
| 8% | 257 | 75 |
| 10% | 191 | 36 |
I've calculated Trinity Mirror's EPV assuming it can earn £100m of EBIT forever. I think the nature of the newspaper business makes the shares quite risky so I want a 12% return to invest in this business. This gives me an estimated value per share of 139p which is very close to the current share price.
But what if sustainable profits are only £50m? As you can see, most of the value of the business is eaten up by the pension deficit leaving very little leftover for shareholders.
You can see that the EPV is very sensitive to the required return that you choose. If you only want an 8% return and think profits of £100m are sustainable forever then the shares could be worth 257p and might be tempting.
I'll leave you to come to your own conclusions on Trinity Mirror shares. Analysing a low PE share is no different from looking at any other share really. With the tools in ShareScope and SharePad and a little bit of time you can go a long way to working out for yourself whether or not you should buy them.
If you have found this article of interest, please feel free to share it with your friends and colleagues:
We welcome suggestions for future articles - please email me at analysis@sharescope.co.uk. You can also follow me on Twitter @PhilJOakley. If you'd like to know when a new article or chapter for the Step-by-Step Guide is published, send us your email address using the form at the top of the page. You don't need to be a subscriber.
This article is for educational purposes only. It is not a recommendation to buy or sell shares or other investments. Do your own research before buying or selling any investment or seek professional financial advice.

