Getting started with investment trusts
One of the most common pieces of investment advice is to not put all your eggs in one basket. You should spread your money around so that your savings pot is not too dependent on a few investments that could go wrong. For some investors who don't want to spend much time looking for individual shares or don't have a lot of spare cash this can make a lot of sense.
One of the easiest ways to do this is to put your money in an investment fund (for an overview on fund investing, click here). For years many financial advisers pushed their customers towards unit trusts (or open ended investment companies known as OEICS for short) because of the juicy commissions they could earn by selling them.
Many private investors who had put their money into unit trusts (I am going to call them funds from now on) were totally unaware that these commissions were coming out of their pockets. If they had put their money in investment trusts they would have paid a lot less and could have been a lot better off.
Now commissions on funds are not allowed and the fees on them have come down a lot. Some are now cheaper than investment trusts.
But that doesn't mean that investment trusts can't still be good investments. Some investment trusts have outperformed comparable funds over the medium- to long-term.
In this article, I am going to explain the key features of investment trusts and how you can use the tools available in SharePad to find the best ones.
Want to learn how to analyse shares like a professional? Download our FREE guide.
Sign-up to our mailing list to receive a PDF of our Step-by-Step Guide to Investing.
Share this article with your friends and colleagues:
What are investment trusts?
Investment trusts aren't actually trusts; they are companies with shares listed on the stock exchange whose main activity is to run and manage an investment fund. Unlike funds which are open ended (meaning they can issue new units in them), investment trusts are closed end funds. They have to raise new money by issuing new shares on the stock exchange.
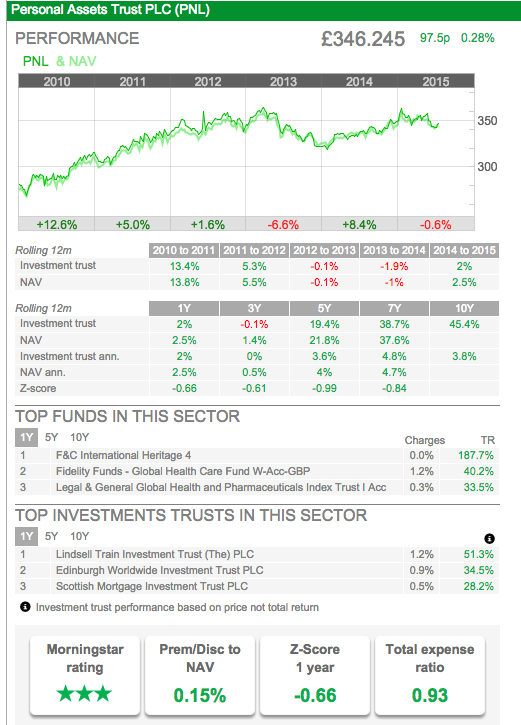
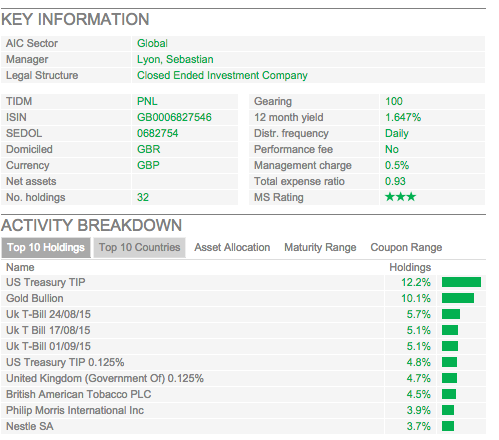
Let's have a look at an investment trust in SharePad and walk through the information tools available. I've chosen Personal Assets Trust (LSE:PNL) as an example.
Prices
The first thing to comment on is the price. In the case of a fund, the price you pay is always its net asset value (NAV). This is the value of the underlying investments held by in the fund. This isn't the case for investment trusts where the price is set by the demand and supply for them on the stock exchange - just like any other share. This means that the price of an investment trust can often be different - sometimes a lot different - from its NAV. I'll have more to say on this important issue in a short while.
Bear in mind though that the price you see in ShareScope or SharePad will not be the price that you can buy the shares for. The price you see is the mid-price which is the price between the selling (bid) and buying (offer) price. The bid-offer spreads can be quite wide and mean that your investment could be worth a few percentage points less as soon as you've bought it but this is the same for smaller cap company shares as well. You will also have to pay commissions to your broker. Buying investment trusts is therefore more expensive than buying a fund where you pay the NAV and usually no commission or upfront fee (if buying through a fund platform like Hargreaves Lansdown).
Performance of an investment trust
Whilst past performance is not necessarily an indicator of future performance you should look at how an investment trust has fared in the past, particularly if it has had the same manager.
SharePad gives you lots of performance data. You can see the performance of the investment trust itself and the performance of the underlying portfolio (the NAV). Both of these are important, but you should place more emphasis on what has happened to the NAV as this is more representative of the possible skill (or otherwise) of the portfolio manager - the person looking after a chunk of your savings.
On the financial summary page for funds and investment trusts in SharePad, you can compare the top performing investment trusts with comparable funds (where there are comparable sectors). This is a very useful feature because you can quickly compare how an investment trust has performed over one, five and ten years against its competition.
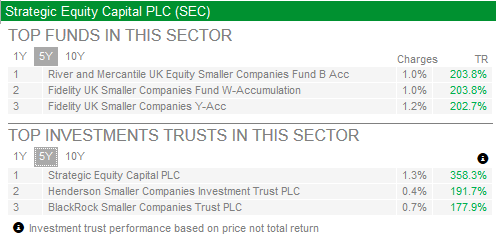
See the example below for Strategic Equity Capital (LSE:SEC) - an investment trust in the UK Smaller Companies sector. Over the period, the stellar performance has justified the slightly higher charges.
Personal Assets Trust, on the face of it, looks terrible compared to its competitors. Looking at the financial summary screenshot earlier in the article, you can see that its one year performance of 2% compares very poorly with the top trusts and funds in the Global sector. This is a good example of where it pays to look at the objectives of the trust because not all trusts in a sector have the same objectives. Whereas most trusts (and funds) in the sector are out-and-out growth vehicles, Personal Assets Trust has first and foremost a wealth preservation mandate and consequently has invested heavily in defensive assets.
Premiums and discounts to NAV
As I said earlier, the share price of an investment trust is often different to its NAV per share.
When the share price is above the NAV it is said to be trading at a premium. When it is below the NAV it is trading at a discount. Premiums and discounts are expressed as percentages of the NAV. So if a trust has a NAV of 100p and a share price of 110p it is trading at a 10% premium. If the share price was 90p it would be trading at a 10% discount.
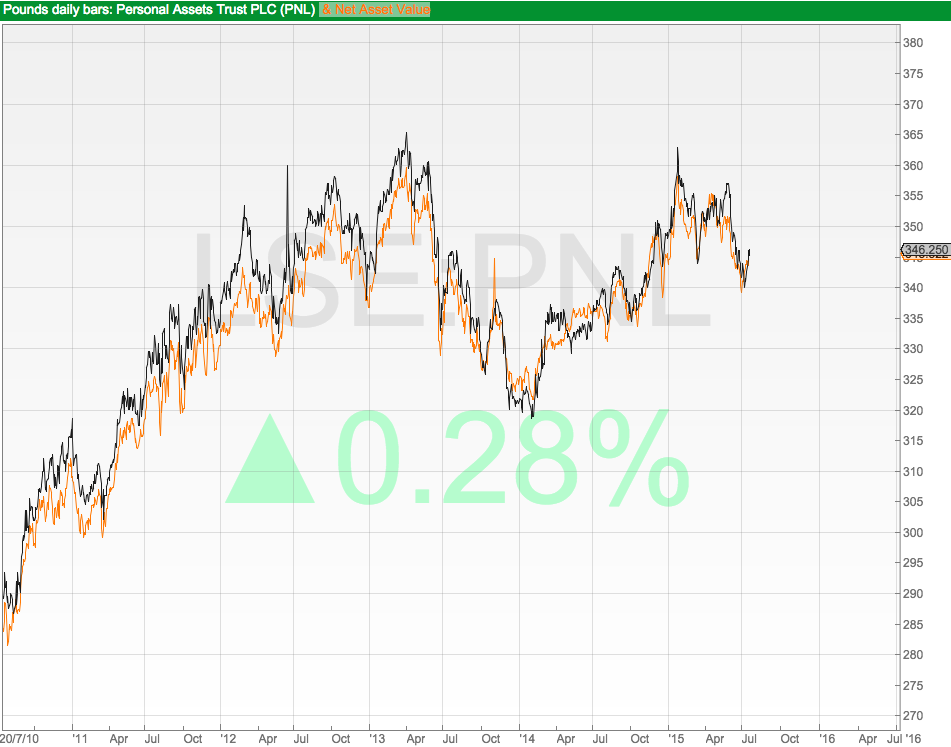
Above you can see a chart comparing the share price (the darker line) with the NAV (the orange or lighter line). As you can see, Personal Assets Trust has often traded at a premium to its NAV - sometimes quite a big one - but at the moment that premium is very small at just 0.15%.
Popular investment trusts in popular sectors can often trade at a premium as people rush in to buy and push up the share price. That might be good news if you already own some shares but I'm not sure that buying shares at a big premium is a good idea. After all, why buy something for more than it is worth? You are betting that the shares will remain popular but if they fall back to the NAV or to a discount you could lose money.
Investment trusts can also trade at a discount. This can be for a number of reasons such as bad past performance, high fees or the fact that the underlying assets are difficult to value. Discounts tend to get bigger at times of trouble in the markets.
How you can use premiums and discounts in your investing
Investors use investment trust premiums and discounts to determine whether a trust is under or overvalued. But it's not as simple as saying that a trust trading at a discount is undervalued and one trading at a premium is overvalued.
Some perfectly good investment trusts, seem to permanently trade at a discount or premium to their NAV.
In addition, investors study the size of an investment trust's discount or premium relative to its history. They'll use this information to decide when to buy in, top up, take profits or sell out - rather like the way you might use a PE value in equity investing.
MP John Baron, who writes a monthly column on his investment trust portfolios in the Investors Chronicle, is a proponent of this.
Ask yourself, is the discount bigger or smaller than its average over a number of years? One way you can work this out in SharePad is to look at the Z-score.
Investment trust Z-score
The Z-score (not to be confused with Altman's Z-score used to predict company bankruptcy risk) compares the current discount or premium with the average discount or premium over a specified time period. You calculate it by taking away the current discount from the average discount and divide the answer by the standard deviation of the discount (how much it has moved about).
So if an investment trust has a current discount of 3% and an average discount of 8% over the last five years and the standard deviation is 2 then the Z-score will be 2.5 ((-3+8)/2)) (remember a discount is a negative number and taking a negative away from a negative turns it into a plus).
Don't worry, SharePad will calculate this for you. You can choose whether you want the Z-score to be calculated over 1, 3, 5, 7 or 10 years. You can view a trust's 12 month Z score on the Financial summary tab but you can add one or more Z-score columns to a list. Select Add column then Funds & Bonds and you'll find Z-score in the Investment trust section.
The simple rule for Z scores is:
- Numbers larger than zero indicate that a trust is expensive compared to history
- Numbers less than zero suggest a trust is cheaper.
A trust that trades at a premium to its NAV can still have a negative Z-score. In this case it means that the premium is lower than the average premium over the period.
Personal Assets Trust has a 12 month Z-score of -0.66. This indicates that its current premium of 0.15% is slightly below the average premium for the last 12 months.
Here are a couple more examples. These are not recommendations.
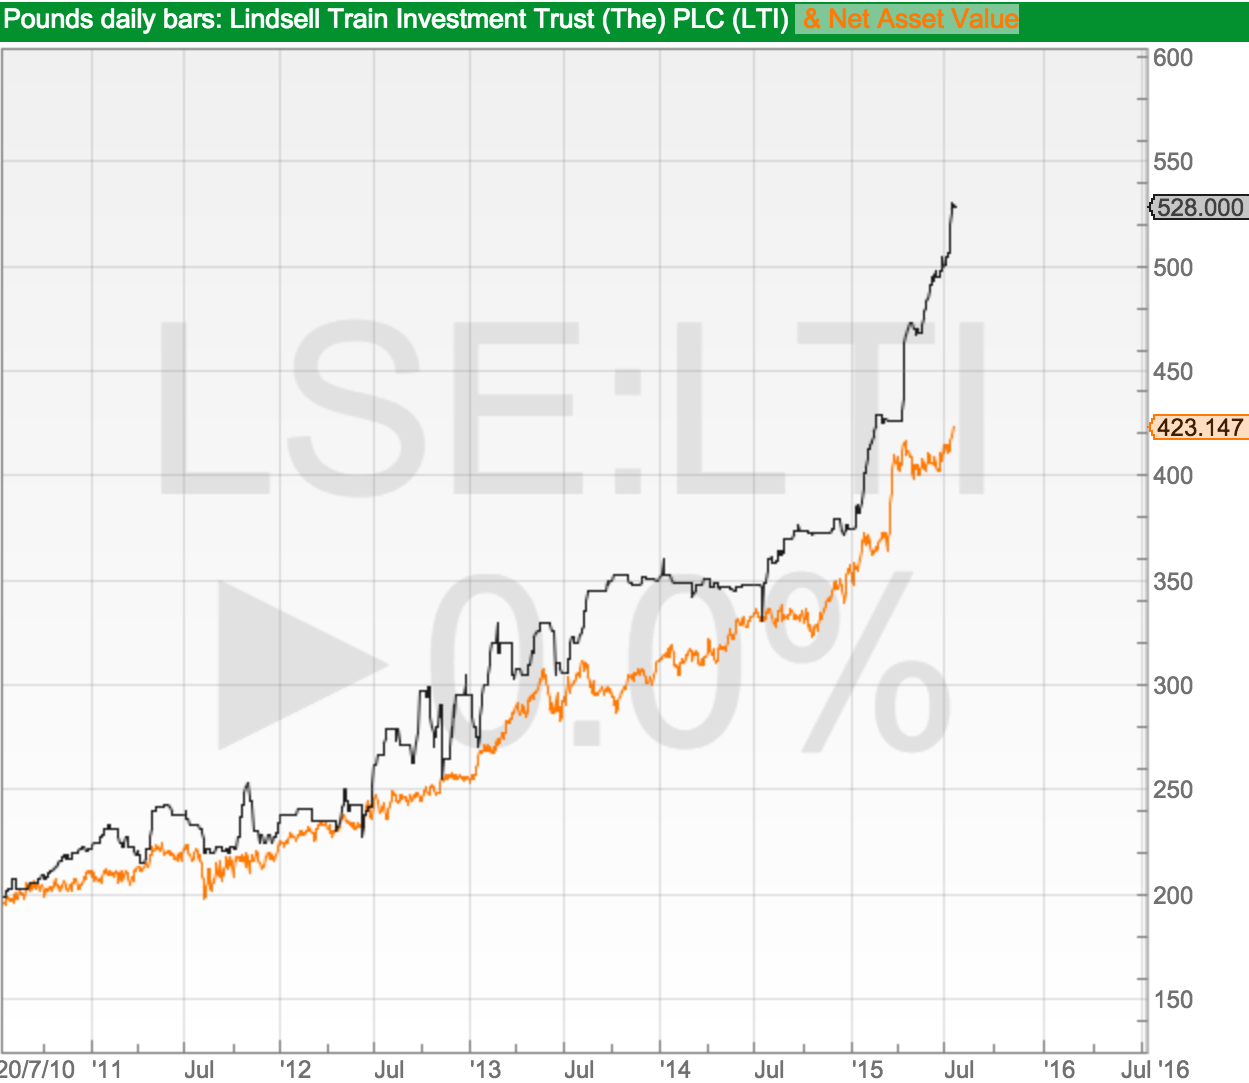
The Lindsell Train Investment Trust (LSE:LTI) has been a star performer. As you can see from the chart below it has consistently traded at a premium to its NAV. But recently that premium has widened significantly to around 25% - way above its historic range. Its Z-score is 2.50 - that's a standard deviation of 2.5 times above its average premium to NAV over the last 12 months. Some investors might see this as a sign to take some profits on their investment or sell their entire holding.
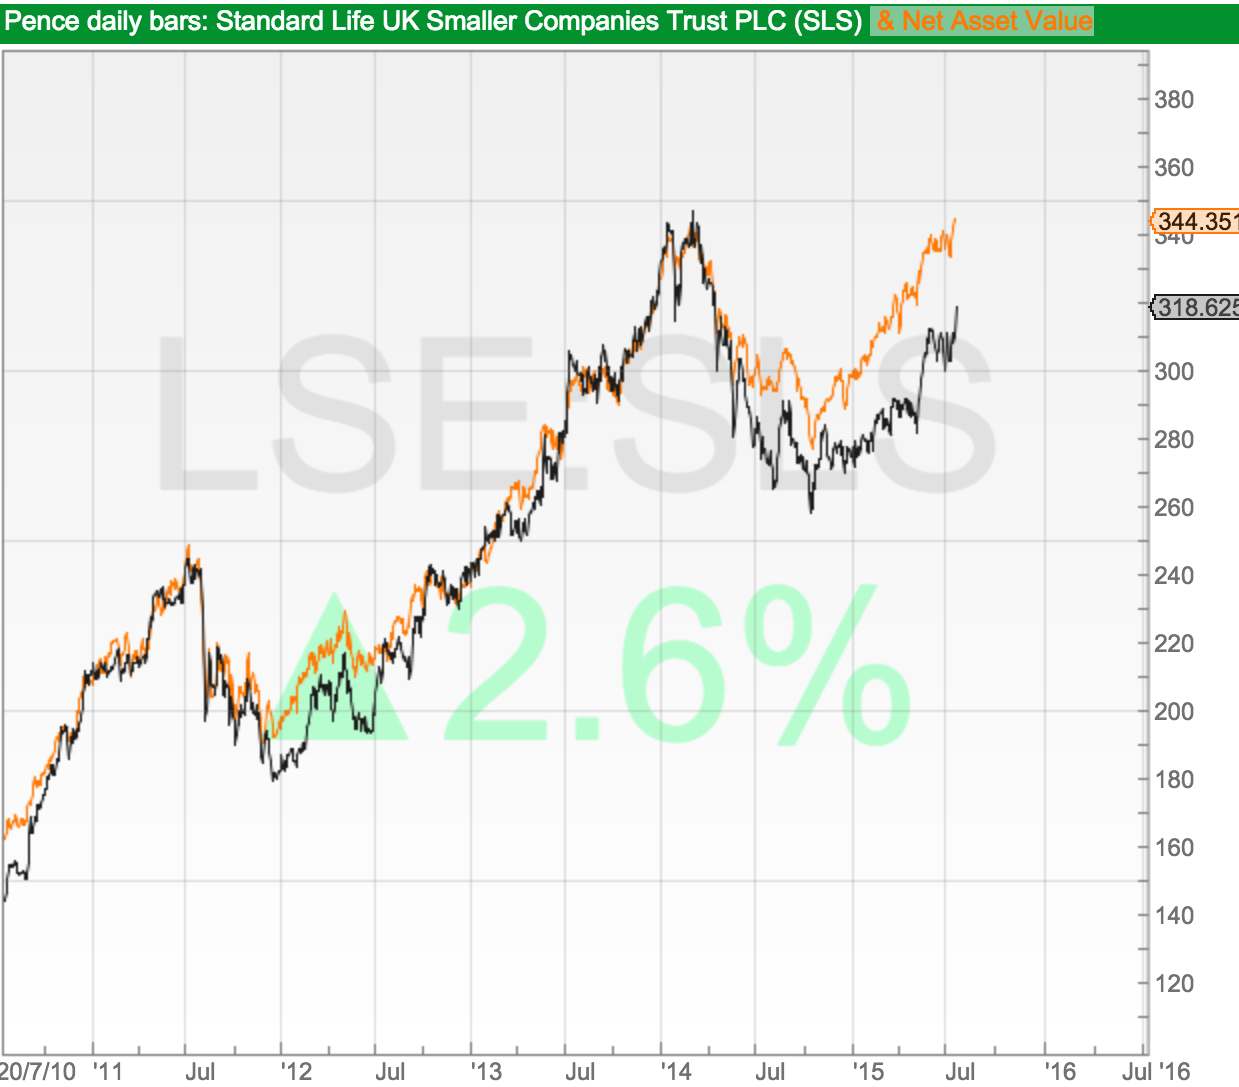
The same idea can be applied for shares trading at a discount. The Standard Life Smaller Companies Trust (LSE:SLS), which has been one of the best-performing investment trusts over 10 years, has tended to trade at a modest discount to its NAV or around par. However, the discount has been wider than normal for the last year and consequently the trust has a Z-score of -1.39. With the price rising, and the discount currently around 10%, you might take the view that the discount could narrow.
It is quite common for some investment trusts to have what is known as a discount control mechanism. This is where the trust says that it won't let the discount exceed a certain percentage. When the discount hits the limit then the investment trust typically buys its own shares on the stock exchange and cancels them. This increases the NAV per share (because the shares are being bought for less than NAV) and narrows the discount. Companies may also wish to stop a premium getting too big and may try to do this by issuing new shares.
Investment trusts - a trading strategy
Professional traders try to make money from investment trusts by betting on something known as mean reversion. This is saying that sooner or later the value of something will go back to its long term average value.
For trading investment trusts this might means buying those with large negative Z-scores - indicating that the discount is a lot deeper than average. The hope is that the discount will narrow back towards the average and the trader will make money.
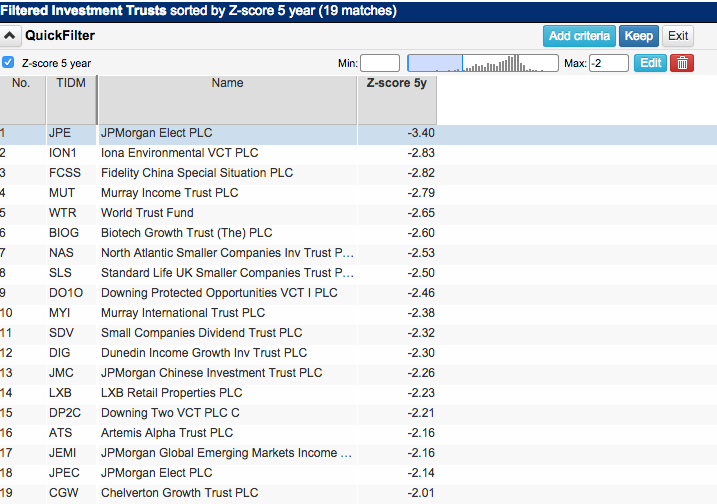
You can set up a filter in SharePad to look for investment trusts with negative Z-scores. Here I've looked for trusts with 5 year Z-scores with a maximum value of minus 2. That is, the discount is currently at least two standard deviations below the average over the last five years.
This doesn't mean that you should blindly trade these trusts. As always do your own research and find out what's been going on to explain the discount (or lower premium) before you part with your cash.
Below I've covered some of the other key items of information when assessing investment trusts.
Total expense ratio (TER)
Sometimes called ongoing charges, the TER is the annual expenses of running the investment trust portfolio as a percentage of the average value of the portfolio. Essentially, the lower this is the better it is for the investor as more money is going into their pockets rather than the manager's.
TERs are useful but do have some drawbacks. For example, they often don't include the costs of buying and selling shares (stamp duty, commissions, bid-offer spreads etc.) which can be a significant cost.
One thing to watch out for with investment trusts is an extra cost in the form of performance fees. These are deducted from the NAV if the trust beats a performance target. These fees can be quite big but some investment trusts have been getting rid of them in recent months.
Personal Asset Trust's TER is 0.93% which is a similar amount to many funds these days.
Gearing
Investment trusts - unlike funds - can borrow money. The portfolio manager might borrow money to exploit an attractive investment opportunity. This can work out well for shareholders if the manager's hunch is right but it also increases their risk. Gearing magnifies the returns of the underlying portfolio to shareholders. This is great if the portfolio is rising in value but not so good if it isn't.
Gearing for investment trusts is expressed slightly differently to gearing for companies. For an investment trusts, gearing is based on the amount of borrowings compared with the total asset value. So if the trust's assets are £100m and the manager borrows £10m the trust would be described as 110% geared. Investment trusts with no borrowings -like Personal Assets Trust - are 100% geared (shown as 100 in SharePad).
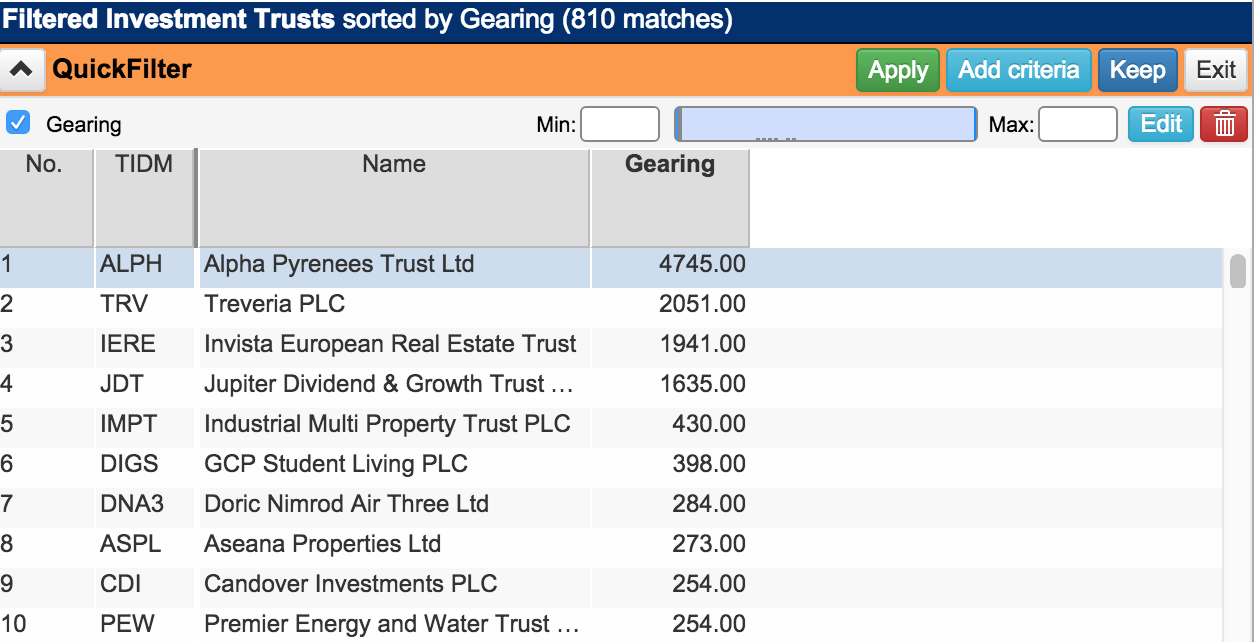
Here are the top ten geared investment trusts in the UK according to SharePad.
You can find gearing, TER and performance fees, as well as a host of other items, on the Financials tab for investment trusts:
Different types of investment trusts
Most investment trusts are based on one type of share - just like company shares. Your total return is the change in the price of the share plus any dividends received.
Some investment trusts split their shares into different types and are known as split capital trusts. Here's a brief description of some of types you might come across.
Income shares are entitled to all the trust's income until a wind up date plus a repayment of the initial issue price of the share. This makes them a lot like bonds in many respects although the income is variable rather than fixed.
Another type is a zero dividend preference share (known as zeros). These offer investors a known amount of capital growth as investors know the value of the shares at the trust wind up date.
Capital shares don't pay any dividends. They are entitled to all the money left over after all other classes of shares (such as zeros and income) have been paid out. If the portfolio is very successful then they can be a very lucrative investment. If the manager does badly then there may be no money left. This makes them a risky investment.
Summary
To recap, investment trusts can be an attractive alternative to funds or ETFs. It's all about the combination of performance, fees, valuation (discount/premium) and risk (gearing). If you are considering a fund promoted by your broker, call it up in SharePad and look at the top performing trusts and funds in the sector. Investment trusts may also offer access to themes or assets that you can't find within the fund or ETF universe. A useful exercise might be to display the Investment trust list in SharePad (or ShareScope), make sure the Investment trusts setting is applied and sort by the %chg 10y column. This will show the top-performing investment trusts across all sectors and may give you some investment ideas for further analysis using the tools outlined above.
If you have found this article of interest, please feel free to share it with your friends and colleagues:
We welcome suggestions for future articles - please email me at analysis@sharescope.co.uk. You can also follow me on Twitter @PhilJOakley. If you'd like to know when a new article or chapter for the Step-by-Step Guide is published, send us your email address using the form at the top of the page. You don't need to be a subscriber.
This article is for educational purposes only. It is not a recommendation to buy or sell shares or other investments. Do your own research before buying or selling any investment or seek professional financial advice.

