Should you rely on brokers' forecasts?
What's the right value for a share or a stock market in general? This is probably one of the most common questions asked by investors.
The truth is that there is no precise answer to this question. It depends on who you ask. What might seem cheap to one person may be expensive to another and vice versa.
However, if you ask a purist or academic the same question they might reply along the lines of: "it's the present value of a company's future cash flows or profits". This is true in theory but isn't much practical use to the likes of you and me.
The obvious problem with this theory is that no-one really knows with certainty what the future will bring. That's why so much effort goes into trying to predict future profits and cash flows. It's what the legions of professional investment analysts and strategists around the world spend most of their time on.
Lots of professional investors rely on the forecasts of these people to help them decide whether to buy or sell something. In recent years they have become more widely available to private investors too. But do these forecasts actually provide any value and should you really be basing your investment decisions on them?
Want to learn how to analyse shares like a professional? Download our FREE guide.
Sign-up to our mailing list to receive a PDF of our Step-by-Step Guide to Investing.
Share this article with your friends and colleagues:
Forecasts or guesses?
It seems there are good grounds for ignoring analysts' forecasts altogether. That's because investment professionals - and human beings in general - are not really that good at predicting the future.
I used to be a City analyst and spent a huge amount of my time with spreadsheet models of companies trying to work out how much money they might make in the future and what their shares might be worth if my forecasts were right. That's supposedly what fund managers wanted to know. I look back now and think most of this number-crunching was a huge waste of time and effort.
Forecasting next year's profits is not too hard. If you extrapolate the most recent growth trends from a company's latest results you won't be a million miles away. It's also true that some companies' profits - where demand for their products and services are relatively stable - are easier to forecast than others. However for many companies, predicting what profits will be in five, ten or twenty years time is another matter entirely. The chances are you will be nowhere near. Yet analysts will try all the same and then confidently state that a share is worth £20 or whatever based on all their guesswork coming true. The dot-com bubble showed this practice at its worst.
Yet evidence shows that even short-term forecasting can be very wide of the mark.
Back in 2013, the Wall Street Journal (WSJ) decided to look into just how good the predictions of experts had been in practice. Not good is the answer. Its study involved a very simple exercise. Predicted annual returns for the S&P 500 index were pinned to a dartboard and darts thrown at it. Over half the time the prediction of the darts would have done better than Wall Street experts. The same could be said for just assuming the average long term return of the index would be repeated in the future.
So why are the predictions of experts so bad?
One particular drawback is that forecasts almost always tend to have an upwards bias. Company profits and the value of stock markets are expected to go up because that is what has happened most of the time in the past.
There will be no assumptions of recessions or a sharp drop in profits a few years down the line. Nor will they assume the introduction of a new product that transforms the business or the arrival of a competitor that decimates profitability. The company insiders won't know this so what chance does an outside analyst with much less information have?
They are also not very good at predicting one-off events such as the financial crisis in 2008. This often means that during these times analyst forecasts are even worse than usual because events are changing so quickly. As I said earlier, many forecasts are just based on the extrapolation of the most recent trends. This can make them poor at predicting turning points when things start getting better or worse.
When you work in the financial markets it is usually better for your career prospects to be bullish about the future. Being a bearish pessimist can be a very lonely place. If you are too optimistic and get it wrong then no-one tends to complain too much. If this happens when you are a pessimist then you might end up losing your job. This can explain why forecasts and predictions are positive most of the time.
Use the numbers that you already have
As I'll explain in a minute, analysts' forecasts do have their uses. However, it's important to realise that a company's most recent profit numbers and financial history have immense value to the private investor. If you know how to use this information and have a copy of SharePad or ShareScope then you are well placed to gain an edge without relying on the predictions of others.
There are endless amounts of useful analysis that you can do with financial data. In SharePad you can go back over twenty years or more to see how a company performed and was valued by the stock market in the past. The future won't be exactly the same but for some businesses - such as house builders for example - it will probably be quite similar.
Here are a few things that you might want to consider:
One under-used strategy is to use what is known as trailing twelve months (TTM) data. You can easily work this out from interim (half year or quarterly) profits.
Say a company has just reported net (or post tax) profits of £50 million for the first six months of the year compared with £40 million a year ago. You know from looking in SharePad that it made £82 million for the whole of last year. This means it made £42 million (£82m less £40m) in the second half of last year and £92 million (£42m plus £50m) for the last twelve months. Divide this by the number of shares in issue (you can find this easily in SharePad) to get an up to date earnings per share (EPS) figure based on facts not guesswork.
Ask yourself, do the shares look good value on this figure? Do you think profits can keep on growing?
If you want to use analyst forecasts, compare this TTM EPS figure with the forecast. Is it realistic? For example, if the TTM EPS is 20p but analysts are forecasting 18p for next year could it be that the forecasts are too low and the shares are a buy? Or is the business really expected to have lower profits due to the loss of a contract or some other issue? We are just adding TTM data to ShareScope and SharePad so I'll have a lot more to say on this strategy in a few weeks' time.
Study the history of the company by going back through several years financial ratios in SharePad. Ask yourself questions such as are profit margins higher or lower than average? Are returns on capital (ROCE) high or low compared with history? This will give you some insight into whether profits may have peaked or still have further to rise.
Calculate a cyclically adjusted PE (CAPE) ratio or get this number from SharePad. This looks at the value of the company based on its average profits for the last eight to ten years adjusted for inflation. This gives an average EPS figure expressed in today's money which can be compared with the current EPS figure.
CAPE is based on the assumption that profits can and do go down as well as up. Trying to buy shares that look good value based on average profits over the ups and downs of an economic cycle can protect you from buying shares for too much based on current or forecast profits just before those profits take a dive.
Using analysts' forecasts in SharePad
SharePad and ShareScope both provide analyst forecasts for shares as shown below. Information on expected profits, target share prices and recommendations are included. This information does have its uses.
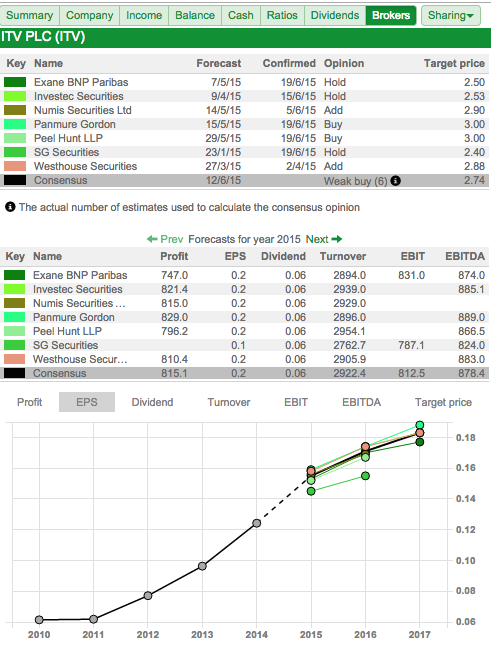
In my opinion, the main value in analysts' forecasts is in looking at what professional investors are expecting the company's profits to be in the future. These expectations are important as most of this information will probably be reflected in the company's share price. One of the most important skills an investor can develop is identifying companies where the profit expectations are wrong - either too high or too low.
If we look at the EPS forecasts for ITV in the chart above you can see that analysts are expecting profits for shareholders to keep on rising at a decent rate. If you want to see these forecasts in more detail you can go to the income statement in SharePad (or Details view in ShareScope).
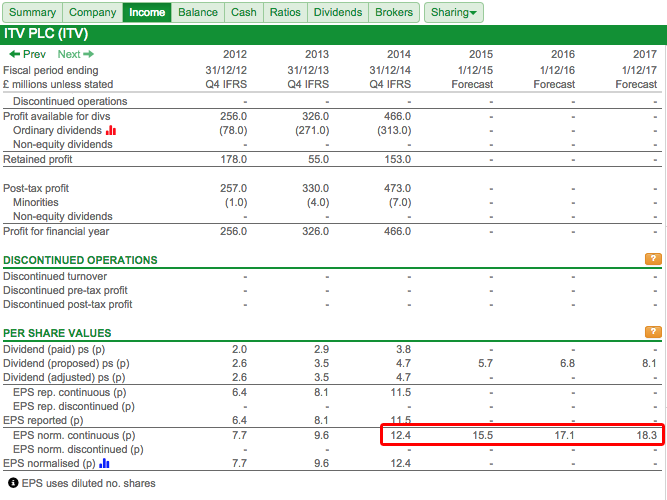
Here you can see that the normalised EPS (the profits per share that exclude one off gains and losses) is expected to increase by nearly 50% from the 12.4p made in 2014 to 18.3p in 2017. That's a big increase and you should try and find out why analysts think this will happen. For example, has the company made a big acquisition of a company that will add a lot of extra profits? Is ITV cutting lots of costs? Is the TV advertising market set for a boom period?
Here history may be very helpful. You can get SharePad to show you a chart of how EPS has turned out in the past.
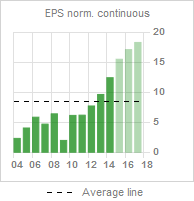
ITV's EPS fell very sharply in 2009 when a weak economy saw advertisers spending less money with them. A recession will undoubtedly happen again at some time in the future but analysts are predicting a very rosy outlook for profits. Will they just keep going up in a straight line?
SharePad also tells me that ITV shares are selling for over 17 times 2015 forecast EPS and a CAPE of 14 times. That might be fair if profits can keep going up but could be expensive if they don't and history repeats itself. So if you thought that a recession was on the horizon, and that the share price still reflected optimistic profit forecasts, then you might get concerned about the valuation of the shares.
Of course, short-term consensus EPS forecasts for a stock may be entirely reasonable.
EPS forecasts are used to calculate PEG ratios which is a valuation measure used by growth investors. PEGs are calculated by dividing the PE ratio for the share by the forecast EPS growth. Buying shares with low PEG ratios (in other words a low PE ratio relative to the expected growth rate in earnings) is a popular investing strategy and was used extensively by famous successful investors such as Peter Lynch and Jim Slater. Jim Slater's son, Mark, is one of the top-performing growth investors in the UK over the last few years. PEG investors are very interested in analysts' forecasts although some will try and forecast the expected growth rate themselves.
However, PEG investors will look at more than just PEG values so skill is required and you'll need to be ready to sell if forecasts and valuations change. To read more on PEG investing, click here.
Analyst recommendations can often be useful a contrary indicator. This means avoiding the shares that are very popular where there are lots of buyers and perhaps buying the ones which are unloved with lots of sellers. You can see these recommendations easily in SharePad.
If you have found this article of interest, please feel free to share it with your friends and colleagues:
We welcome suggestions for future articles - please email me at analysis@sharescope.co.uk. You can also follow me on Twitter @PhilJOakley. If you'd like to know when a new article or chapter for the Step-by-Step Guide is published, send us your email address using the form at the top of the page. You don't need to be a subscriber.
This article is for educational purposes only. It is not a recommendation to buy or sell shares or other investments. Do your own research before buying or selling any investment or seek professional financial advice.

