How to look for undervalued growth shares with ShareScope
One of the most interesting things about investing in shares is that there are lots of different strategies you can use to try and make money. Most successful investors tend to have a common trait in the way that they go about finding winning shares. They find a strategy that they are comfortable with and then stick with it through thick and thin.
In order to get comfortable with a particular method of investing you have to buy into the reasoning behind it and try to understand why it has worked in the past. Something will either sit well with you or it won't.
For example, the idea of buying cheap, beaten up shares will make perfect sense to some people - sometimes known as value investing. Others will focus their attention on companies that can grow their profits rapidly - known as growth investing.
Over the last couple of weeks, I've spent some time talking about some of the ways that you can look for cheap shares. This week, I'm going to switch my attention to a way of finding growth companies at a fair price and how you can use ShareScope to look for these yourself.
We are going to look at a very popular investment tool known as the PEG ratio.
Let's get started.
Want to learn how to analyse shares like a professional? Download our FREE guide.
Sign-up to our mailing list to receive a PDF of our Step-by-Step Guide to Investing.
Introducing the price earnings growth or PEG ratio
So what is a PEG ratio?
In its most simplest form it is the price to earnings ratio (PE) of a share divided by the expected growth rate in earnings per share (EPS).
PEG = PE /Expected growth in EPS
A share with a PE ratio of 15 and expected earnings growth of 20% has a PEG ratio of 0.75 (15 dividend by 20). Another share also with a PE of 15 and expected earnings growth of 5% has a PEG of 3 (15 divided by 5). As I'll explain later, the share with the lower PEG would usually be seen as the better one to buy.
PEG was developed because of the perceived limitations of just relying on PE ratios alone. By comparing the PE of a share with the expected growth rate in earnings it might just be possible to buy great, fast growing companies at a reasonable price and make a lot of money.
PEG came to prominence as a winning strategy when it was used by the successful US investor Peter Lynch during the 1970s and 1980s. Between 1977 and 1990, Lynch ran the Fidelity Magellan investment fund and trounced the stock market with returns that averaged 29% per year. In the UK, PEG was championed by investor Jim Slater in his book The Zulu Principle.
Why profit growth matters
Lynch and Slater reasoned that the way to make lots of money from owning shares was to buy companies that could deliver big growth in profits. It was akin to putting money in a savings account with a high rate of interest and watching it snowball over time. Yet they had to avoid paying too much for the shares in the first place - an all too common mistake.
Most of the time the stock market is pretty smart. Companies that are growing their profits rapidly tend to be valued at a high multiple of current profits - they have high PE ratios.
However, by comparing the PE ratio with the expected growth rate in earnings, shares that might look very expensive on PE ratios alone could actually turn out to be undervalued gems. To see why this might be so, consider the following fictional company below and see how earnings growth and PE ratios help to determine
| Bob's Bike Shop | 2014A | 2015F | 2016F | 2017F |
|---|---|---|---|---|
| Share price (p) | 1500 | 1875 | 2344 | 2930 |
| EPS (p) | 100 | 125 | 156 | 195 |
| EPS growth | 25% | 25% | 25% | |
| PE ratio | 15 | 15 | 15 | 15 |
| PEG | 0.6 | 0.6 | 0.6 |
| With higher PE | ||||
|---|---|---|---|---|
| Bob's Bike Shop | 2014A | 2015F | 2016F | 2017F |
| Share price (p) | 1500 | 3125 | 3906 | 3906 |
| EPS (p) | 100 | 125 | 156 | 195 |
| EPS growth | 25% | 25% | 25% | |
| PE ratio | 15 | 25 | 25 | 20 |
| PEG | 0.6 | 1 | 1 | |
A = announced F = forecast
Bob's Bike Shop has been growing rapidly during the last five years and is expected to keep on doing so in the years ahead. Its shares trade on a PE of 15 which is in line with the general stock market and so appears to be reasonably valued - neither too cheap or too expensive.
If the shares continue to command a PE of 15 over the next three years the share price will go up in line with earnings growth and an investor will almost double their money. That sounds good.
But the likes of Lynch and Slater argue that the high rates of earnings growth should command a higher PE ratio. A simple rule of thumb is that a company growing its profits or earnings at 25% could be expected to see its shares trade on a PE ratio as high as 25 (the same as its expected growth rate) . This would result in a ratio of PE to earnings growth (or PEG) of 1.
This would happen if the market reappraises the outlook for the company and bids the share price up. If this were to happen to the shares of Bob's Bike Shop above then its share price will be even higher in three years' time. This is because its EPS will have a higher PE multiple applied to it.
Jim Slater suggested buying shares with a PEG ratio of much less than 1. He tried to buy shares where the ratio of the PE to expected earnings growth - the PEG - was two thirds or less. In other words, a PEG ratio of 0.66 or less. This way he reasoned that he could buy before the rest of the market worked out what a good investment a company was. Something like Bob's Bike Shop for example.
Does PEG work in the real world?
This all sounds well enough in theory but does PEG really help investors to make a lot of money?
There aren't that many published studies that have looked at how good the PEG ratio is at picking winners. In his 1996 book, Beyond the Zulu Principle, Jim Slater posted some compelling evidence that buying shares with a PEG of 0.6 or less during 1995/96 beat the market handsomely. But that was nearly twenty years ago and over a very short time period.
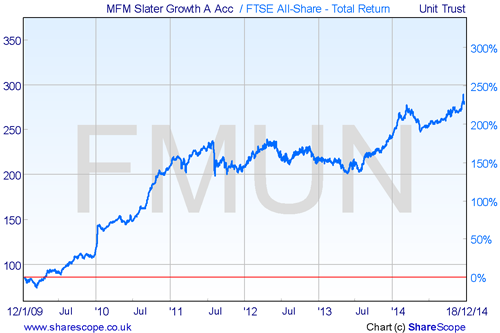
Mark Slater - Jim Slater's son - runs the MFM Slater Growth Fund and uses PEG as a central piece of his investment strategy. Whilst past performance is no guarantee of how well a fund will do in the future this fund has performed very well since the beginning of 2009 as shown in the chart.
(Note: This is not a recommendation to buy this fund. Please do your own research before investing in anything.)
How to calculate PEG ratios?
ShareScope calculates five different types of PEG ratio ranging from a simple version to more sophisticated ones. I'm going to look at three versions using ShareScope data on a leading FTSE 100 share and will use BT (LSE:BT.A) as an example.
Don't worry if these calculations start to look a bit complicated. You just have to understand the logic behind them. ShareScope will do all the number crunching for you.
| BT Share price (p) | 404 | |||||
|---|---|---|---|---|---|---|
| EPS (p) | PE | EPS % growth | Rolling EPS(p) | Rolling PE | Rolling EPS growth | |
| Historic | 25.4 | 15.9 | 28 | 14.4 | ||
| Year 1 | 28.8 | 14 | 13.39% | 29.9 | 13.5 | 6.78% |
| Year 2 | 30.3 | 13.3 | 5.21% | |||
| Historical PEG | 1.19 | |||||
| Projected PEG | 2.69 | |||||
| Rolling 1 PEG | 2.13 | |||||
Historic PEG
This is calculated using the historic PE ratio (share price/last annual normalised EPS) and dividing it by the expected growth rate in earnings for the next year. So BT has a PE of 15.9 and an expected one year growth rate in earnings per share of 13.4% giving an historic PEG ratio of 1.19. (15.9 divided by 13.4).
Projected PEG
Some people prefer to calculate a PEG ratio based on forecast (or projected) PE ratios and earnings growth rates. This is because past profits are known. The future is what really matters. Using projected values might therefore give the investor an edge.
You calculate a projected PEG by taking the forecast PE ratio (share price/forecast normalised EPS) and the forecast EPS growth rate in one year's time. The forecast EPS growth rate to use is the forecast two years out (30.3p) compared with the forecast for one year's time (28.8p). For BT this is 5.21%. With a projected PE of 14.0 this gives a projected PEG ratio of 2.7 (14.0/5.21).
Rolling 1 PEG
Slater argues that if you are comparing projected PEG ratios between two companies it is important that you are basing them on the same timeframe - one whole year ahead. For example, if it is March and a company's year end is December there is really only a 9 months' forecast potentially being used.
To get round this you can calculate what is known as a rolling PEG based on one year rolling EPS figures and growth rates.
ShareScope calculates this figure to the nearest day (based on 252 trading days in a year). I am being slightly lazy in order to make the calculation easier to understand. My figures will be therefore slightly different to the ones that you will find in ShareScope.
Taking the case of BT. It has a March year end and we are currently near the end of December. So to calculate a rolling EPS figure you take the historic EPS of 25.4p (March 2014) and multiply by 0.25 (three months) and the following year's forecast of 28.8p (March 2015) and multiply by 0.75 (nine months). This gives a rolling EPS forecast of 28.0p.
To get the rolling EPS growth rate you have to move the process forward one year. Take the 2015 forecast EPS of 28.8p and multiply by 0.25 and the March 2016 forecast EPS of 30.3p and multiply by 0.75 to get a figure of 29.9p.
The rolling EPS growth rate ((29.9/28.0)-1)) is 6.78%. The rolling 1 PE is 14.4 (404/28.0) and the PEG is 2.13 (14.4/6.78).
Given these three PEG figures it would seem unlikely that someone such as Jim Slater would be a buyer of BT shares at the current price. That's not to say that the shares might not look attractive on other measures.
Using PEG ratios with ShareScope
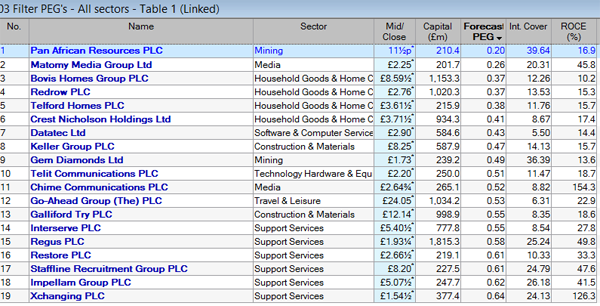
I've been into the data mining section of ShareScope and set up a screen for shares with a forecast PEG of less than 0.66 - to copy part of Slater's strategy. A list of shares is shown in the table:
To start screening for shares that fit certain criteria click on the data mining button.
If there is any feature of ShareScope's fundamental data that you would like us to explain in more detail then you can contact us at analysis@sharescope.co.uk.
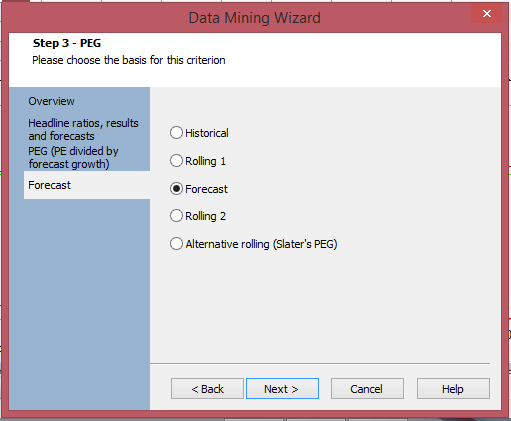
You'll find this icon  on the main toolbar. You can then start setting the values for your PEG using the data mining wizard.
I've searched for companies with a market value between £200m and £3bn.
I've also added a few additional criteria to weed out weak companies. I want to look at companies with reasonably strong finances with interest cover (how many times profits can pay the interest on the company's borrowings) of at least 5.
I also want to look at companies that can make a reasonable return on the money they invest. So I've set a criteria for return on capital employed (ROCE) of at least 10%.
You can set up your own filtering criteria with the wizard.
Things to consider
Like any investment strategy, it's not as simple as getting a list of shares that tick a few boxes and buying some of them. It would be nice if that was the case but there are a quite a few things with PEG that you need to take on board:
- PEGs should only be used with genuine growth companies. Look at the past five years and make sure that profits have been growing strongly. Avoid cyclical companies (e.g. house builders or engineers) whose profits move up and down in line with the economy.
- PEG may work better with smaller companies that are less extensively researched by City analysts.
- The lower the PE, the better. This gives you a better chance of making money from the market re-rating the company to a higher PE when profits keep growing. Avoid very high PEs. Share prices of high PE companies can fall sharply if profits disappoint.
- Slater thinks that PEG works best with PEs between 12 and 20 and earnings growth of between 15-25%.
- Pay very close attention to analysts' forecasts. This is a key part of the PEG strategy. ShareScope has a list of forecasts for you to look at. Check when the forecasts were last updated and then see when the last piece of significant news about the company was released. Out of date forecasts lower the value of any PEG ratio.
- How are the company's earnings growing? Make sure that it is by selling more goods and services (sales growth). This is genuine growth. EPS can grow through less sustainable means such as cost cutting, buying other companies or spending lots of money on new assets but getting low returns. Make sure that EPS growth in the past has been backed up by a stable or growing ROCE. Share buybacks often boost EPS but this can be a poor source of growth.
It is quite possible that you will not find many - or any - shares that meet a PEG criteria. This may be telling you that the stock market itself is getting quite expensive. This is not a problem. As a private investor you are not under pressure to buy shares all the time. You can wait until shares become cheaper and build a watchlist of shares in the meantime.
Phil Oakley

