Putting it all together: how to analyse a share
In this article, I use the data and tools in ShareScope to show you how I analyse shares but it also applies to ShareScope. Even if you are not a subscriber, you should find this article extremely useful as a guide to making informed investment decisions.
One of the main selling pitches of the fund management industry is that they can make more money for you than you can investing for yourself. They argue that they have lots of clever, hard-working people slaving away day after day trying to find the best investments so you don't have to. Give them your money and you will be a lot richer over the long haul.
Sadly, most people have realised that this isn't true.
More isn't necessarily better. You can have too much information.
The real skill in investing is focusing on the information that really matters. You don't need to spend hours talking to companies and analysts like many professional fund managers do. As with many things in life, the quality of what you do is much more important than the quantity.
You need to take the information that you have and use it in a structured and disciplined way to help you answer the important questions about an investment. Combine this with the ability to be single-minded, to think clearly and rationally and you are already well on the way to making good decisions.
The good news here is that with ShareScope you already have everything that you need. Ever since I started investing, I've learned that that the only tools an investor really needs to do well is an internet connection and a copy of the company's latest annual report. I still read annual reports but I've changed my view slightly. An internet connection and a copy of ShareScope gives me everything that I need to make an informed decision about an investment. I used to be a professional analyst in the City and I can tell you that someone using ShareScope can analyse a company just as well as the pros.
In this article, I'm going to show you how I used a lot of the tools in ShareScope to decide whether I would buy the shares of sports retailer JD Sports. I am also going to show you how you can also use the wealth of data in ShareScope to perform some optional useful advanced analysis that can increase your understanding of a company.
This is not a share tip but a way of showing you how you can use ShareScope to analyse a company and its shares. As always, do your own research before investing in anything.
Let's get started.
Want to learn how to analyse shares like a professional? Download our FREE guide.
Sign-up to our mailing list to receive a PDF of our Step-by-Step Guide to Investing.
Know what you are buying
Before you do anything else, you need to spend a reasonable amount of time learning about what you are potentially buying into. In these days of the internet and online broking accounts it's very easy to get sucked into thinking that you are trading numbers on a computer screen.
If you are a proper, long-term investor you will not be doing this. Instead, you will be looking at buying a small chunk of a real business. Understanding what makes this business tick is key. The more you understand about how it makes money now and in the future, the more you will concentrate on this and stop worrying about the daily ups and downs of share prices and the masses of unimportant market chatter.
You can come across an investment idea in many ways. For example, you may be a customer and like what the business sells. Or you might have found it by screening for it in ShareScope. Either way, you probably need to try and understand it better.
Let's take the example of JD Sports.
The first thing you can do is click on the 'Financials' button then the 'Company' tab in ShareScope. The activity breakdown will tell you where and from what businesses a company makes its money from. You can set this breakdown to tell you this in terms of sales or profit (using the 'Breakdown by' button at the bottom of the display.
Here we can see that JD Sports makes around 80% of its sales from its Sport retail division and gets the bulk of its sales from the UK.
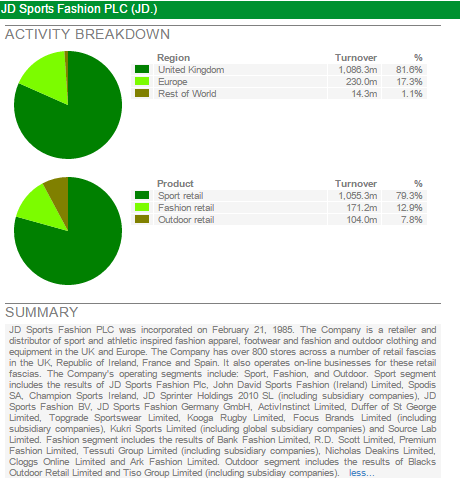
Below the activity breakdown is a brief summary of the company telling me a bit more about what it does. In this instance, I can learn about some of the products, brands it sells and what countries it sells them in. It owns over 800 stores, trades under lots of different retail formats (known as fascias) and has been expanding its business into Europe.
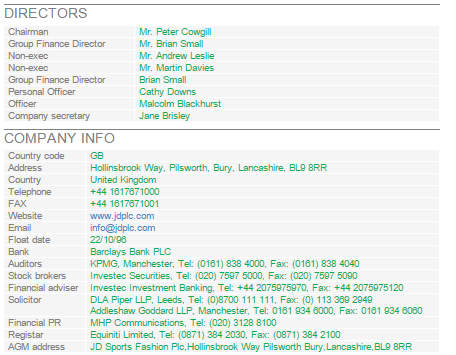
If I then scroll a bit further down, I can see more information on the directors and the company including a handy link to the company's website so that I can find out more about the company.
The other thing that I tend do when researching a company is look at who owns it as this can sometimes reveal some interesting facts. Click on the 'DD' button in ShareScope to do this.
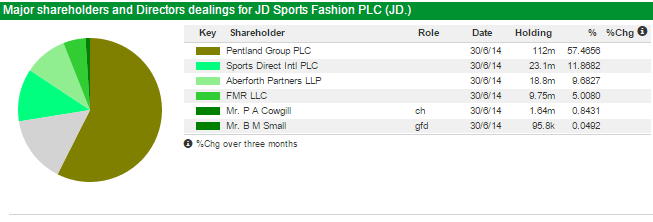
The first thing that leaps out is that fact that Pentland Group owns 57.5% of the business. Large, dominant shareholders can be a blessing and a curse to the private investor. Sometimes they can be too conservative and lock a company into a bad strategy or fail to react to competition. But they can also be a force for good. Either way, it can be helpful to try and find out a bit about them.
Who are Pentland Group? Well, a quick search on the internet tells me that it is a family owned, private company that owns a lot of well known sports clothing brands such as Berghaus, Ellesse, Hunter (famous for its posh wellington boots), Kickers, Mitre and Speedo. It used to own the Reebok shoe brand before selling it for a nice profit. It has owned its stake in JD Sports since 2005 and seems intent on remaining a long-term shareholder. This is reassuring, as the last thing you want as a private investor is big shareholders constantly selling down its stake and depressing the share price.
It is clear that Pentland Group sees JD Sports as key to selling more of its branded goods. This is also potentially good news for JD Sports and its shareholders as these brands help differentiate the company from the competition (more on this in just a minute). My opinion is that these stable of brands from Pentland Group may help to position JD Sports at the quality end of the sports fashion market away from the more commoditised end which is more about selling big brand trainers and replica football kits. This should allow it to earn higher profit margins than selling Nike trainers - of which it sells a lot.
You can also see that Sports Direct - a major competitor known for its aggressive selling tactics - owns nearly 12% of the company. What does this mean? Pentland's 57.5% all but blocks a takeover bid and any significant influence. However, given Sports Direct's owner Mike Ashley's eye for making money it might not be too unreasonable to think that he sees JD Sports as a decent investment.
What's also encouraging is that the chairman and group finance director own a reasonable stake in the company. In the words of Warren Buffett it seems that they 'eat their own cooking'.
Does the business have a future?
I am looking at this business from the perspective of owning it for a long time, not trading it for a few months. This means that you have to have a lot of confidence that it has what it takes to survive and prosper. To do this it has to be able to compete with similar businesses and stop them from destroying it. What we need to find out is whether a business has an economic moat that can keep competitors at bay. (For more about economic moats read my article here.)
JD Sports operates in a very competitive sector. An internet news search will tell you that high profile companies such as JJB Sports and Blacks Leisure (which JD bought in 2012) have gone bust. Many blame the aggressive pricing of Sports Direct which has also threatened to "finish off" JD Sports. The fact that JD Sports has survived and prospered suggests that it is doing something right and has some form of competitive edge. This is most likely to come from its focus on the quality end of the market and higher margin sports fashion goods.
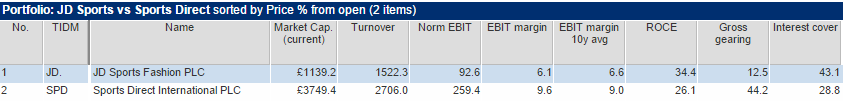
You can easily compare two or more companies in ShareScope by setting up a portfolio and adding columns of financial data. Here, I've compared JD Sports against the market leader, Sports Direct.
Sports Direct is a much bigger company in terms of turnover and profits but there are some good signs of competitive strength for JD Sports. Although its EBIT (profit) margins are lower, its return on capital employed (ROCE) is higher at a very impressive 34.4%. (Note though that ROCE can be flattered for a lot of high street retailers as they tend to rent rather than own a lot of their stores and these operating assets are not on their balance sheets). JD Sports also has a strong financial position with low debts and very high interest cover meaning that its profits can fall a long way before it gets into financial difficulties. I see this as a good sign.
Studying a company's financial history
However, to get a proper feel of whether you are looking at a good potential investment or not it pays to study a company's financial history. By analysing a company's financial statements - its income statement, balance sheet and cash flow statement - over several years (I'd suggest at least five years and preferably ten) you can build up a picture of a company in your mind. The numbers tell a very powerful story and help you understand where a company has come from, which in turn can help you to work out where it is going.
ShareScope comes into its own here. Whereas your broker or other services may only provide five years worth of data, ShareScope lets you look back over up to twenty years of financial data and does most of the important calculations for you. This saves hours of work compared with slaving away over annual reports with a calculator and a spreadsheet. What's also very handy is that you can easily export the financial data into a spreadsheet to do some more detailed number crunching of your own if you want to.
Profit analysis
Let's start by looking at the income statement. I've chosen a ten year time frame to get a clear picture of JD Sports' profit performance.
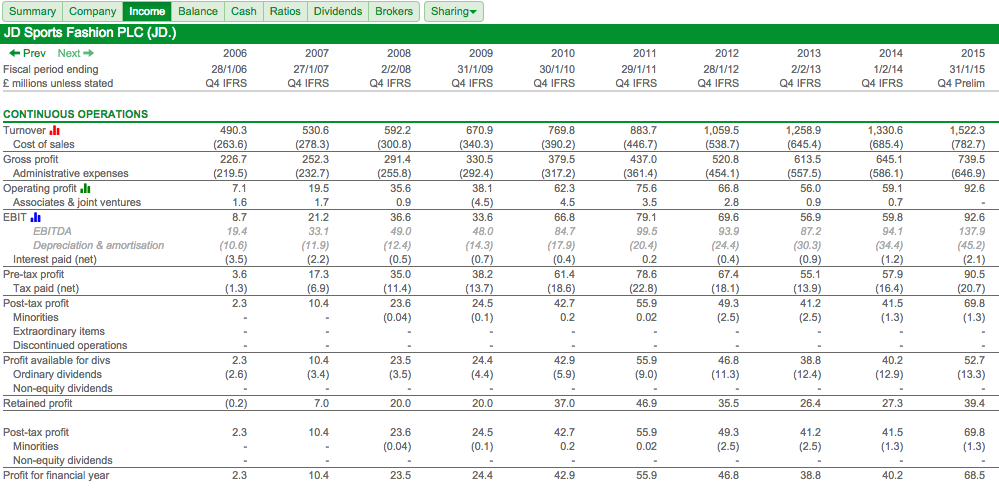
The first thing to do is look at trends. In terms of turnover, there has been a good record of growth. However, when it comes to retailers, one of the best measures of how good it is at selling stuff is known as like-for-like (LFL) sales. These are usually defined as sales from existing shops that have been open for at least a year. It's usually easier to grow just by opening more shops, which is why LFL sales is seen as a better quality benchmark of a retailers.
You can find out JD Sports' historical LFL sales performance by looking them up from the news function in ShareScope. Here I've found the LFL sales performance for the core sports retail business going back to 2006. (It took me less than ten minutes to do this.) On this evidence it would seem that JD Sports is a reasonably competent retailer and seem to be fairly good at selling more stuff from its shops in most years. 2015 was an exceptional year and it will be hard to keep growing at that rate though.
| Year | Change in LFL sales |
|---|---|
| 2006 | 0.30% |
| 2007 | 4.80% |
| 2008 | 11.30% |
| 2009 | 3.30% |
| 2010 | 2.30% |
| 2011 | 3.80% |
| 2012 | -1.20% |
| 2013 | 2.50% |
| 2014 | 6.70% |
| 2015 | 12% |
The most important profit number I look at is EBIT (earnings before interest and tax) as this tells me the profits that come from a company's day to day trading activities and is not influenced by interest payments like pre-tax profit or tax in the case of post-tax profit. I feel that EBIT gives me a much better feel of how good a business really is.
The other important issue here is to look at normalised EBIT numbers (ones that don't include the impact of one off exceptional items such as asset write-offs or redundancy and reorganisation costs) so that you can get a flavour of what's been happening to underlying trading profits. ShareScope gives you these numbers as well.
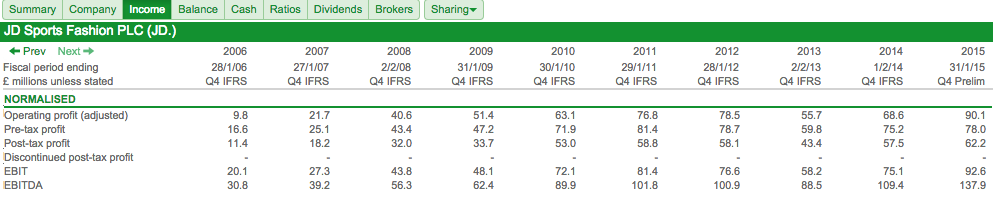
In general, EBIT has been growing. There was a big increase in 2010 and falls in 2012 and 2013 before a big jump in 2015. My inclination would be to go and find out what caused these significant profit changes as it may tell me a lot about the characteristics of the underlying business.
The good news is that I don't have to go trawling through annual reports on the internet, I should be able to find out what I need by using ShareScope's news function. This gives me all the important financial news (known as regulatory news service or RNS) on JD Sports going back to 2006. Below you can see the final results link from 2010 in ShareScope.
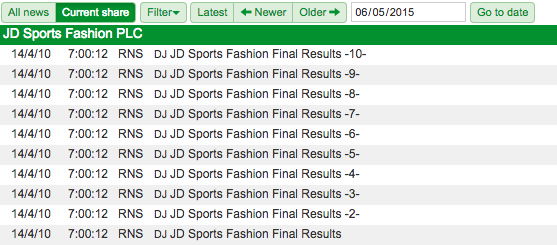
The jumps in profit in 2010 and 2015 were largely down to a good trading performance. The fall in 2012 was explained by high levels of promotional activity in its markets (read lots of products being sold at discounted prices) which put pressure on profit margins. The fall in 2013 was due to large losses at the Blacks outdoor clothing business that it bought in 2012.
The falls tell you something about the risks that JD Sports faces. Blacks is still losing money and this business - and the amount of investment that JD Sports puts into it - needs to be watched. The blip in 2012 is also a warning sign as it shows the sensitivity of profits to aggressive price competition. This could happen again.
The next step is to look at some ratios from the income statement in ShareScope and examine any trends.
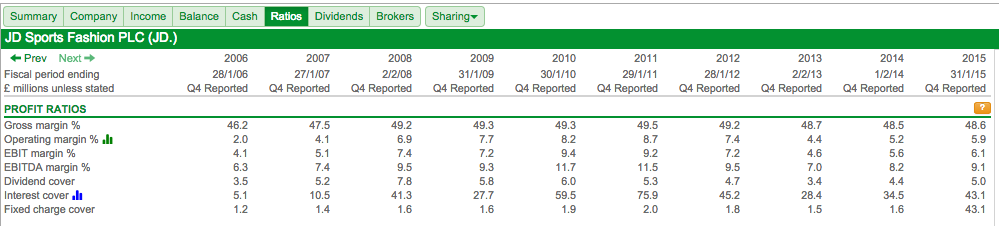
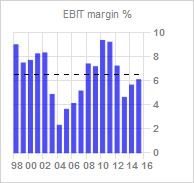
The most important ratio is the EBIT margin - what percentage of sales is turned into trading profits. This number is on an upwards trend since 2012 which is a good sign and may suggest that the trend can continue. But margins are still lower than the margins earned in the past or those earned by Sports Direct as we saw earlier.
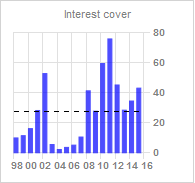
The two other key profit ratios are interest cover (how many times EBIT can pay the interest due on borrowings) and fixed charge cover (how many times the profits can cover the interest bill and rents payable on the company's shops). Interest cover at 43.1 is very healthy. I'll use the 2014 fixed charge cover (see below for why) which, at 1.6 times, is not too uncomfortable - but I wouldn't want to see it much lower.
The 2015 results are 'preliminaries' which means they are based on company announcements and so we don't yet have access to the notes to the accounts. Some peripheral values like fixed charge cover require these notes so are best ignored until the data has been updated using the published accounts. You know when this has happened because in the financial statement tabs in ShareScope, the column heading will change from 'Q4 Prelim" to "Q4 IFRS".
Balance Sheet analysis
A balance sheet is a snapshot at one moment in time - usually the end of a financial reporting period. It is the best piece of information that outside investors have about what a company owns and what it owes. JD Sports' balance sheet is shown below.
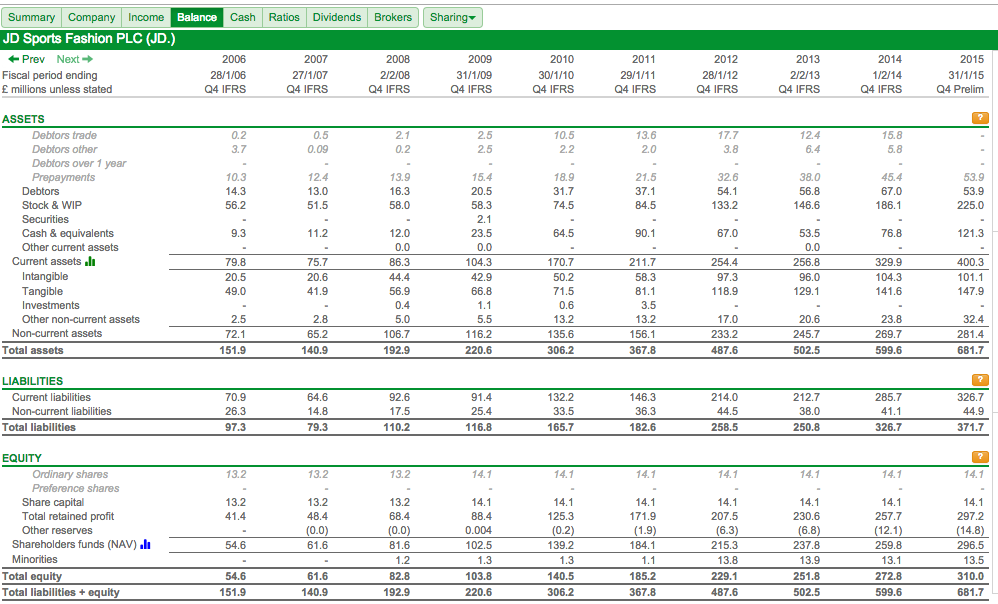
I find balance sheets quite fascinating and think they are often overlooked by investors. Most of the value comes from calculating certain ratios but there are some interesting observations on the face of the balance sheet itself.
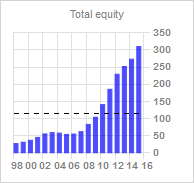
A reassuring sign is that total equity has grown every year for the last ten years. This is the sum of how much money has been invested by shareholders (share capital) and retained profits (profits that have not been paid out as dividends). I am encouraged to see that JD Sports share capital has increased from £13.2m to just £14.1m over the last ten years which is telling me that its growth has come from issuing hardly any fresh equity at all.
Now let's have a look at some important balance sheet ratios:
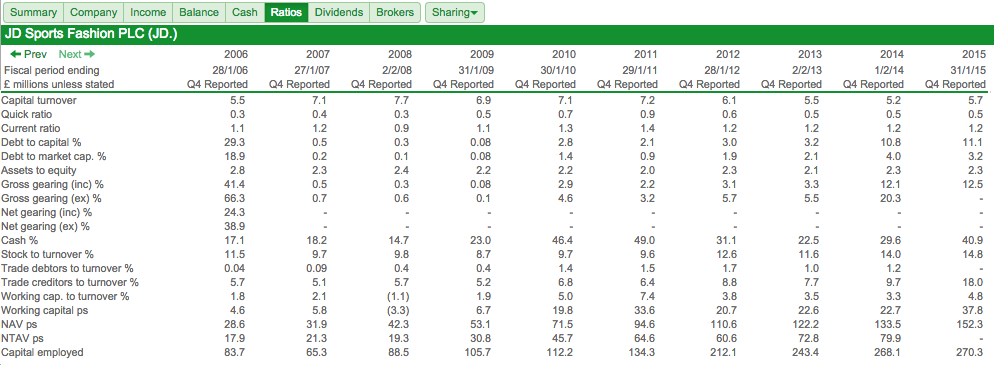
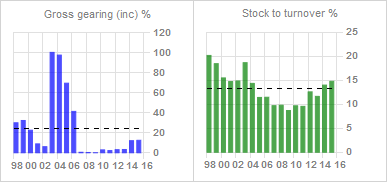
ShareScope calculates lots of different ratios from a balance sheet. Here, I am looking to see if the company has lots of debt. High debt in a retailer would worry me, especially if it has large rent bills to pay as well (seen by many analysts as a form of off-balance sheet debt). Gearing which measures debt against assets or equity is very low.
Two other things that have caught my eye is that the level of stock to turnover has been going up during the last few years from 9.6% in 2011 to 14.8% in 2015. Stocks consume cash flow and this increase needs watching. Looking into this further it may be that Blacks may have increased stocks to improve service levels. Should this be a cause for worry? You would rather see this ratio stable or falling that's for sure. One of the best ways to help answer this question is to compare it with a rival. Sports Direct's stock turnover ratio is even higher at over 20%. So maybe there's nothing to worry about?
The balance sheet allows you to calculate how much money has been invested by a company. This allows us to compare how much profit has been made compared with how much money has been spent to make it. This is shown in ratios such as return on capital employed (ROCE) and return on equity (ROE).
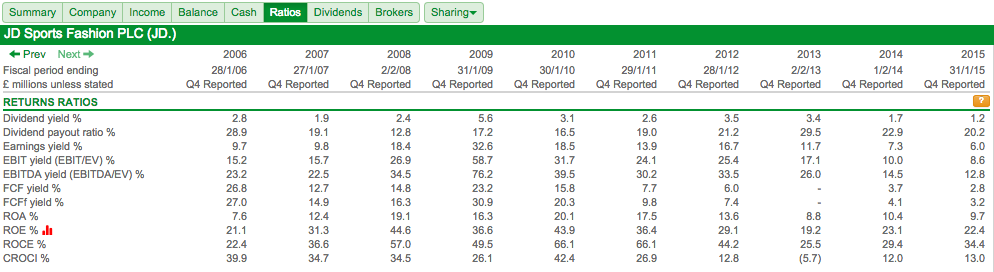
ShareScope calculates lots of return ratios. ROCE and ROE are at respectable levels but are on a declining trend. If you look back at the previous table, you can see that capital employed (the amount of money invested by the company) doubled between 2011 and 2014 from £134.3m to £268.1m whereas profit (normalised EBIT) actually fell from £81.4m to £75.1m.
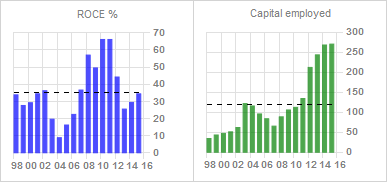
This is the kind of trend that needs investigating. Much of this it seems can be put down to the purchase of Blacks in 2012 which has been losing money and seems to have required a lot of investment to put it on the right track and also a struggling fashion business. Looking forward a year at the 2015 results it seems that JD Sports has got a better grip on its finances. My calculations show that capital employed has increased only slightly to £270m but normalised EBIT has increased by 22.5% to £92.6m and ROCE is heading up again.
Cash flow analysis
Cash flow is the lifeblood of any business. As an investor you want to see a company producing lots of profits and plenty of surplus (or free) cash flow. (For a full explanation of cash flow read my Step-by-Step Guide here).
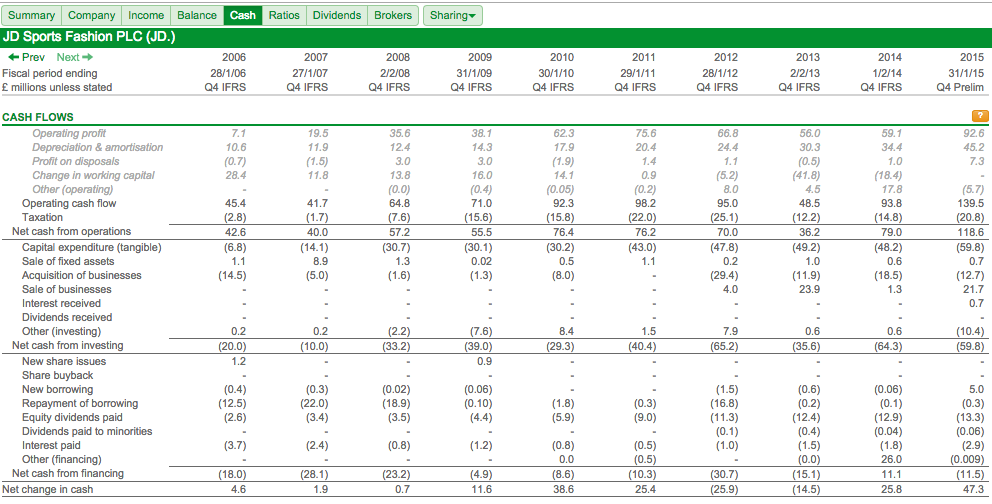
Studying the flow of cash around a company is probably one of the most valuable exercises that you can do as an investor. That's because cash flow is a lot better at telling the truth about a business than profits are - it is a lot harder to manipulate. I spend a lot of time looking at cash flow and find the cash flow ratios from ShareScope extremely useful.
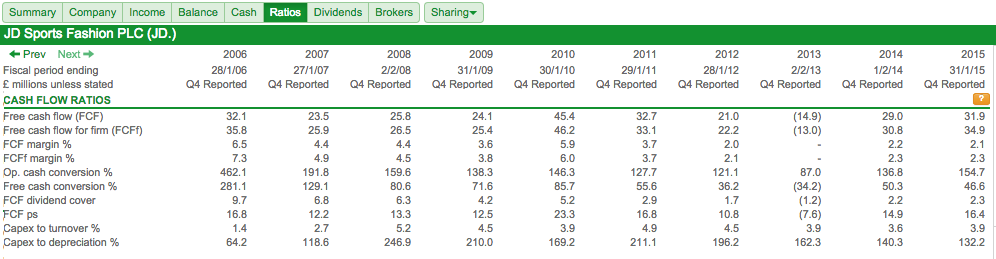
The first thing I tend to do is compare the amount of cash generated by a business with its profits. Whilst cash flow can be a bit bumpy in a particular year, you want to see a business turning a large chunk of its profits into cash.
Operating cash conversion compares operating cash flow with operating profits. JD Sports has comfortably generated more operating cash flow than operating profit during the last ten years. A failure to do this consistently is usually a red warning flag that there could be something wrong.
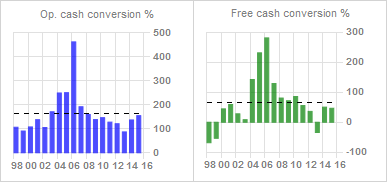
Free cash flow conversion looks at the amount of cash flow left over after items such as interest, tax and capital expenditure in the business (known as free cash to equity) have been paid and then compares it with the level of post-tax profits. You can also do this by comparing the free cash flow per share (FCF ps) with a company's normalised earnings per share (EPS).
Consistently negative free cash flow is a bad sign. The main reason for this is usually a very high level of capital expenditure (considerably more than depreciation which is a proxy for how much needs to be spent to maintain a company's assets in good condition). This either tells you a company is over-investing (i.e. not getting a lot of extra cash into the business in relation to extra cash spent) or that its profits are overstated because the depreciation charge is a lot lower than the cash spent on assets.
JD Sports seems to have been able to generate free cash flow consistently which has meant that there has been plenty of cash left over to pay its relatively small dividend. It hasn't turned all its post tax profits into cash because it has been investing quite heavily (more than depreciation). As long as this extra spending on assets leads to higher profits in the future then there is no cause for concern. But how do you get any confidence that a company can do this?
Some more advanced cash flow analysis
ShareScope gives you everything that you need to make a good investment decision. However, there are always extra bits of analysis you can do if you want to dig deeper. I often export data from ShareScope into a spreadsheet so I can crunch the numbers a bit more.
| JD Sports (£m) | 2012 | 2013 | 2014 | 2015 | Cumulative |
|---|---|---|---|---|---|
| Acquisitions | 29.4 | 11.9 | 18.5 | 12.7 | 72.5 |
| Selling businesses | -4 | -23.9 | -1.3 | -21.7 | -50.9 |
| Capex | 47.8 | 49.2 | 48.2 | 59.8 | 205 |
| Sale of assets | -0.2 | -1 | -0.6 | -0.7 | -2.5 |
| Working capital | 5.2 | 41.8 | 18.4 | 0 | 65.4 |
| Depreciation | -24.4 | -30.3 | -34.4 | -45.2 | -134.3 |
| Net cash investment | 53.8 | 47.7 | 48.8 | 4.9 | 155.2 |
| 2012 EBIT | 76.6 | ||||
| 2015 EBIT | 92.6 | ||||
| Change | 16 | ||||
| Return on Extra Investment | 10.31% | ||||
One of the things I like to do with the cash flow numbers is to keep an eye on what kind of return a company is getting on its recent investments. This is different to looking at return on capital employed. I want to compare the change in profit generated by any extra cash invested in the business.
Here I am looking at the last four years where JD Sports has been spending quite heavily. I add up all the cash spent on acquisitions, new assets (capex) and any extra working capital (such as more stocks of goods) and then take away money coming in from asset sales and depreciation. This gives me the net cash invested in the business. Between 2012 and 2015 this was £155.2m. Over the same time period, profits (EBIT) increased by £16m. So the extra investment has produced a return of 10.31%.
This is a satisfactory number but nothing special. That said, investments need time to bed in and mature and are probably best appraised over a longer time period. If I performed the analysis from 2009, then the return on extra investment goes up to a very impressive 24.37%.
You might be surprised to hear that it is quite common for companies to spend a lot of money for very little - if any - extra profits.
| JD Sports (£m) | 2009 | 2010 | 2011 | 2012 | 2013 | |||
|---|---|---|---|---|---|---|---|---|
| Acquisitions | 1.3 | 8 | 0 | 29.4 | 11.9 | |||
| Selling businesses | 0 | 0 | 0 | -4 | -23.9 | |||
| Capex | 30.1 | 30.2 | 43 | 47.8 | 49.2 | |||
| Sale of assets | 0 | -0.5 | -1.1 | -0.2 | -1 | |||
| Working capital | -16 | -14.1 | -0.9 | 5.2 | 41.8 | |||
| Depreciation | -14.3 | -17.9 | -20.4 | -24.4 | -30.3 | |||
| Net investment | 1.1 | 5.7 | 20.6 | 53.8 | 47.7 | |||
| 2009 EBIT | 48.1 | |||||||
| 2015 EBIT | 92.6 | |||||||
| Change | 44.5 | |||||||
| Return on Extra Investment | 24.37% | |||||||
How can it grow?
Once you've got to know a bit more about the business and studied its financial history you need to start turning your attention to a company's future prospects. Knowing what happened in the past is very useful, but a company's share price and dividend paid are based on what will happen in the future.
For a share to be a good long-term investment it has to have the potential to keep on growing its profits. How do you go about working out whether JD Sports can do this?
The first thing I tend to do here is check out the latest news on current trading. You can easily find this in the news section in ShareScope. It's important to spend time reading the comments of the chief executive, finance director and the review of the business in a results statement. There will almost always be a comment on the future prospects of the business in there.
On reading the latest results statement in ShareScope, it seems that the company can continue to grow its profits in the years ahead. This looks like it can come from three main areas:
Firstly, from the core UK sports business continuing to trade well. This business seems to be in rude health and, as long as there is not a return to lots of promotional offers from competitors, profits look like they can keep on going up.
Secondly, the overseas business looks to have good prospects and the company is spending a lot of money here as evidenced in these comments:
"We have continued to extend our store presence in Europe with 19 new stores for JD and Size?, taking us to 70 stores. Our continued development recognises that our offer has been well received to date in these markets. We are also encouraged by the performance of Sprinter in Spain and Chausport in France. In so far as this progress continues, we anticipate further growth in overseas markets."
"Our increased confidence in international success means that investment in JD's international fascias will be a key focus for the Group in the new year. International development opportunities combined with ongoing investment in Project Emperor and further works at Kingsway means that there is likely to be a further substantial increase in the overall capital expenditure in the new financial year."
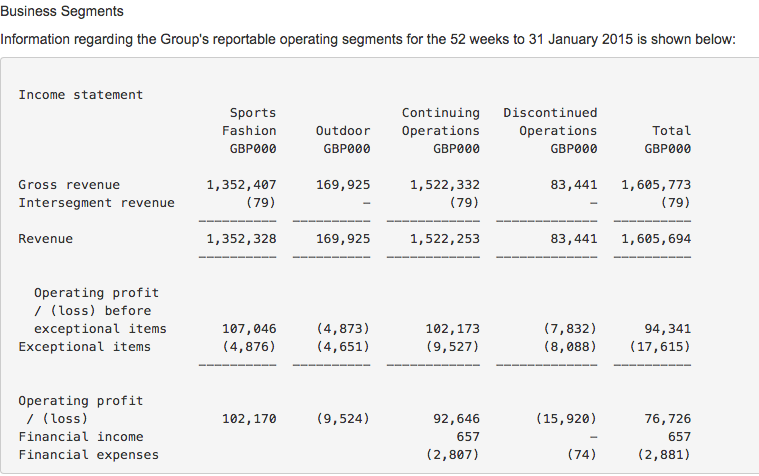
Thirdly, the company has sold its loss making Bank fashion business which lost £7.8m last year (shown in the discontinued column below). Those losses won't be there in 2016 giving a boost to overall company profits.
If there's one thing to worry about then it is the slow progress at getting Blacks to make money. This is costing JD Sports a lot of money to put right and does make me worry that it could be throwing good money after bad. This comment from the latest results contains some cause for concern:
"The turnaround of our Outdoor fascias continues although the encouraging results in the first half were somewhat tempered in the second half as the milder and drier weather led to a general oversupply relative to demand for winter related product in the market throughout the season with consequent high levels of discounting. We continue to work with our branded partners and our own brand supply chain to improve our product proposition and market positioning to achieve a more focused consumer targeting for each part of our business. Property investment, both in terms of new stores and refitting existing stores, is also required but will be driven by the strength of the proposition and the property costs in each location. We are conscious that delivery of profitability has been delayed but remain determined to enhance our proposition and the efficiency of the operations so that profitability is achieved in 2016/17."
What do City analysts think?
I think profits can grow, but are City analysts thinking the same? You can check this out in ShareScope by looking at analysts' profit forecasts. You can see these in the income statement as shown below:
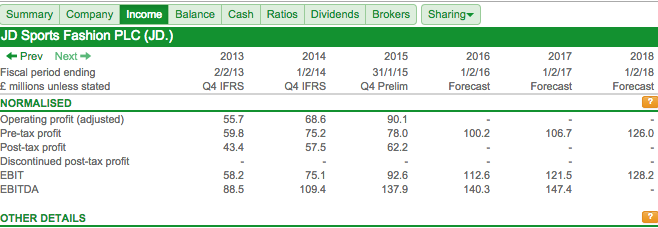
A big jump in pre-tax profit is currently expected in 2016. City analysts aren't always right - in fact they are often wrong - but checking on the direction of profit forecasts is generally useful.
One point to bear in mind though is that the forecasts above are an average of all the analysts that provide forecasts to our data provider. Within ShareScope you can have a good hard look at how these forecasts were put together by clicking on the 'brokers' tab in the financials section.
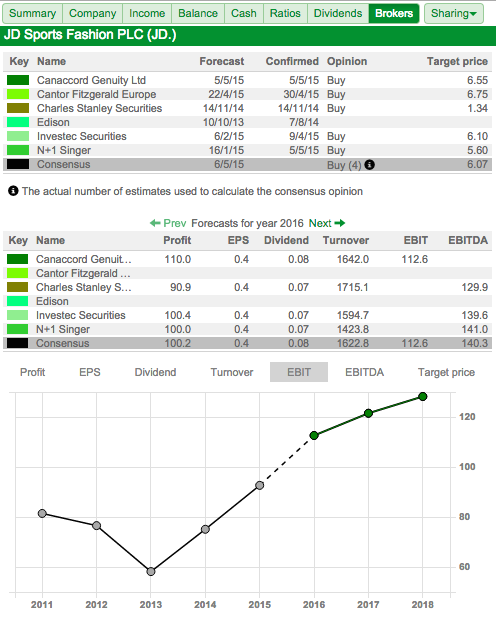
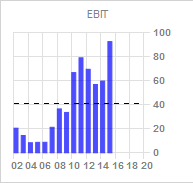
What you need to pay attention to is when the forecasts were made. More recent ones are probably more reliable than ones made three or four months ago. Our data supplier, Morningstar actually weights the forecasts accordingly which is a smart move. You can see each broker's forecast for items such as turnover, EBIT, pre-tax profit, earnings per share, dividends per share and their target price for the share. You can also set up a chart in ShareScope to show you the direction of analyst forecasts compared with historical results. I've set the chart to look at EBIT above.
Are the shares good value?
Paying the right price is crucial to investment success. Good companies are rarely available at rock bottom prices, but paying a "fair price" rather than a high price is what you should be aiming for.
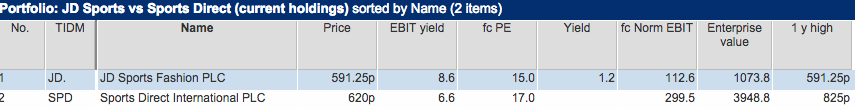
I set up a portfolio table in ShareScope to look at a prospective investment on lots of different valuation measures. I usually compare them with similar companies as well. So let's look at JD Sports and Sports Direct again.
Choosing a valuation yardstick is a matter of personal choice and will depend somewhat on the type of company you are looking at. My preferred valuation measure is EBIT yield (EBIT divided by a company's enterprise value - its market cap plus or minus its net debt or net cash). I like this measure because unlike a PE ratio it is unaffected by company debt levels (more debt lowers PE ratios and makes companies look cheaper than they really are) and different tax rates. It is therefore a very clean valuation measure that is good for comparing against other companies.
If possible I like to buy shares with EBIT yields of more than 10%. If a company is growing very quickly then I might lower this threshold to 7%. I don't want to pay too much for a share but realise that in most cases you have to pay up for good companies.
JD Sports' EBIT yield of 8.6% is based on its last reported annual profits and current enterprise value. It is cheaper than Sports Direct on this measure and with profits expected to grow strongly I might be tempted to buy some shares. This view is supported by looking at the forecast EBIT of £112.6m which would give a prospective EBIT yield of 10.5% which looks reasonable value.
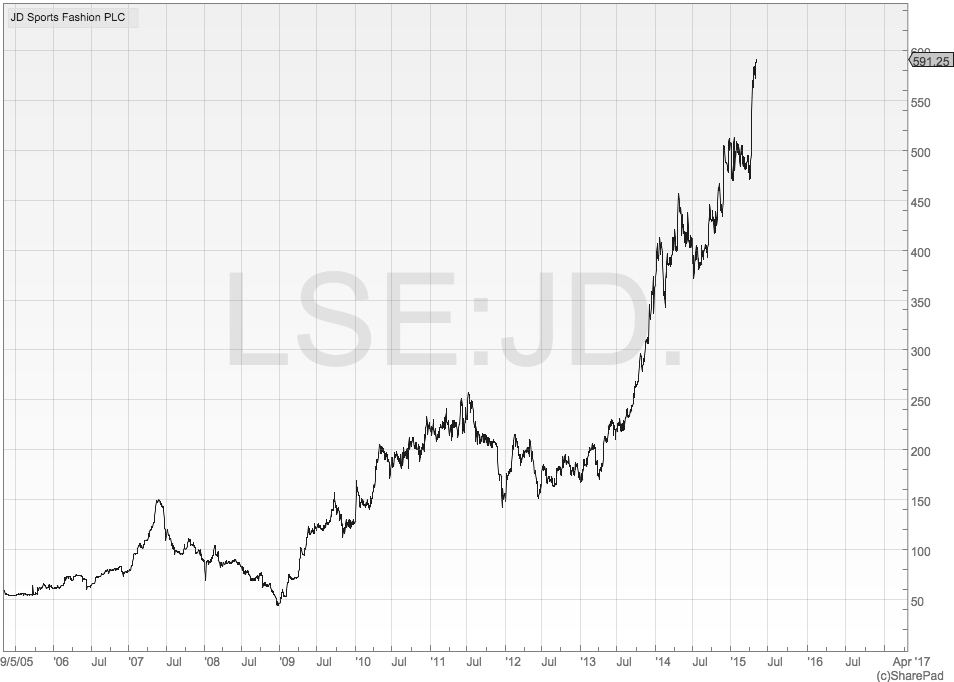
One thing that might put me off though is the current share price which is at an all time high. The chart above shows that the shares have been on a terrific run for the last three years. Maybe I should wait? But will the share keep on going up?
If the high price puts you off, you can always set a target price and set an alarm in ShareScope to alert you when the share has reached that level. Here's how to set an alarm for JD Sports at 540p:

By ticking the box and the envelope I will get an alert in ShareScope and an email when JD Sports' share price falls below 540p so I can get on with looking at other possible investments.
Conclusion
As you can see, you have all the data you need in ShareScope to perform a thorough analysis of a company and make a considered investment decision. Yes, I have years of experience which help me to do this quickly but just as I learnt how so can you. My weekly articles and my Step-by-Step Guide are here to help you achieve this and please feel free to email me at analysis@sharescope.co.uk with any questions or suggestions for future articles.
Phil Oakley

