How to identify genuine sales growth
One of the main reasons to buy the shares in a company is to benefit from the future growth in its profits and cash flows. Bought at the right price, growth can turbocharge your returns from owning a share. Unsurprisingly, lots of investors spend a great deal of time trying to unearth such gems.
However, when people start looking for growth shares, their focus tends to be heavily biased towards profits growth. That's understandable as profits are what drive share prices at the end of the day. But not all profits growth is of the same quality. Some of it is based on unsustainable sources.
Let me explain. Investors tend to focus on four different measures of profits:
- Operating profit aka Earnings before interest and tax (EBIT)
- Pretax profit aka Profit before tax (PBT)
- Post-tax profit aka Profit after tax (PAT)
- Earnings per share (EPS)
It is not too difficult for a company which isn't really growing (i.e. not selling more goods or services) to keep on growing its profits for a while and perhaps trick unwary investors that all is well when it might not be.
Cutting costs is a common way to keep operating profits growing. Repaying debt or refinancing existing borrowings at a lower interest rate can lead to lower interest expenses and a higher PBT. A lower tax rate can then boost post-tax profits. Then the company can shrink the number of shares outstanding and boost its earnings per share.
These actions are all welcome if you are a shareholder. However, if you are screening the stock market for growth shares by focusing solely on profits growth - especially EPS growth - then you might end up buying a dud. You think that you are buying a growth share but when all the cost cutting and refinancing ends, the profits growth ends too and this is often accompanied by a sharp fall in the share price.
Want to learn how to analyse shares like a professional? Download our FREE guide.
Sign-up to our mailing list to receive a PDF of our Step-by-Step Guide to Investing.
Share this article with your friends and colleagues:
Sales growth is key
Sales are the lifeblood of any business; its primary source of income. It cannot survive and prosper if it cannot persuade customers to keep on buying its products or services. Genuine growth companies grow by selling more not by cutting costs or buying back their own shares.
Yet growth in sales (often referred to as turnover or revenue) can also be of varying quality. To identify high-quality sales and ultimately profits growth you need to find a way of scrutinising the sources of a company's sales growth.
In this article, I am going to show you how to give yourself a better chance of spotting high-quality growth shares and avoiding bad ones. I am going to focus most - but not all - of my attention on the Alternative Investment Market (AIM) where it is possible to find some genuinely good growth companies but also some that might look good but are anything but.
A company's sales growth can come from a variety of good and bad sources:
- Like-for-like (LFL) sales - Selling more from its existing assets. This is usually a good source of sales growth but not always.
- Investing in new assets - This can be good as long as the new assets improve or maintain a company's return on investment (ROCE).
- Buying other companies - Again, this can be fine as long as a company can improve or maintain its return on investment.
- Selling more goods and services on credit - Companies can make themselves more competitive by offering more generous credit terms to their customers - giving them a longer time to pay their bills. Sometimes this is good business practice but at other times it can be a warning sign to investors.
Let's look at each of these in turn.
Like-for-like sales
This measures the change in sales coming from a company's existing operations that have been in business for at least a year. It is commonly used in industries such as retailing and consumer goods and is seen as a good measure of a company's underlying sales growth.
You'll find information on Like-for-Like (LFL) sales in the company's trading updates and results announcements. You can find these in SharePad.
Increases in LFL sales are usually taken as a positive development but some care is needed here. One area where LFL sales can be slightly misleading is in retailing. This is due to something known as the maturation effect.
Retailers can give the impression that they have very strong underlying sales growth when really what is happening is that stores that have opened during the last couple of years are just going through a natural maturation process. This happens because new shops or outlets rarely reach their natural level of sales in the first year of opening. During their first year, sales are not included in a LFL calculation but they are in their second year when sales may still be building up to normal levels.
This is why retailing companies with aggressive new opening schedules can post very strong LFL sales as lots of new stores are maturing at the same time. This tends to get investors and analysts excited and they often start predicting big growth in the retailer's sustainable profits which leads to a big rise in the share price.
When the company has built up to a large number of stores, the impact of new openings can begin to wane. In fact, new openings can start to be a problem as they start taking sales away from existing stores - a process known as sales cannibalisation. This is when LFL sales can fall off a cliff.
A good example of this happening in practice is Restaurant Group (LSE:RTN). It has rapidly grown its number of restaurants but LFL sales have fallen sharply as you can see in the table below.
| Year | Stores | Net Change | LFL sales (%) |
|---|---|---|---|
| 2016 HY | 513 | 7 | -3.9 |
| 2015 | 506 | 34 | 1.5 |
| 2014 | 472 | 27 | 2.5 |
| 2013 | 445 | 23 | 3.5 |
| 2012 | 422 | 22 | 4.5 |
| 2011 | 400 | 11 | 3.25 |
| 2010 | 389 | 22 | -1 |
| 2009 | 367 | 13 | -2 |
| 2008 | 354 | 24 | 1.5 |
| 2007 | 330 | 46 | 5.5 |
| 2006 | 284 | 5 |
As has its share price:
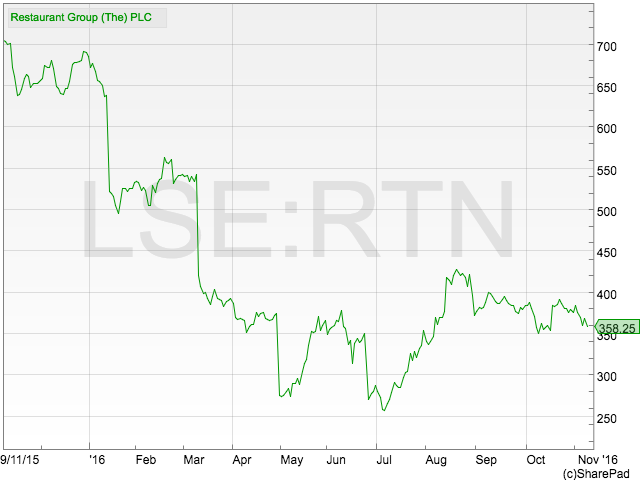
The other key thing to look out for with LFL sales is the split between how much the change in sales came from selling more (volume) and how much came from price. The ideal scenario is a mixture of volume and price increases. If a company is having to slash prices to sell more then this could be a sign of weakness. Sales growth due only to price increases is also a worry as customers may switch to a cheaper competitor.
Buying sales
The ideal company is one that does not have to spend a lot of extra money to grow its sales. Many companies invest in new assets (such as shops or factories) or buy other companies in order to grow.
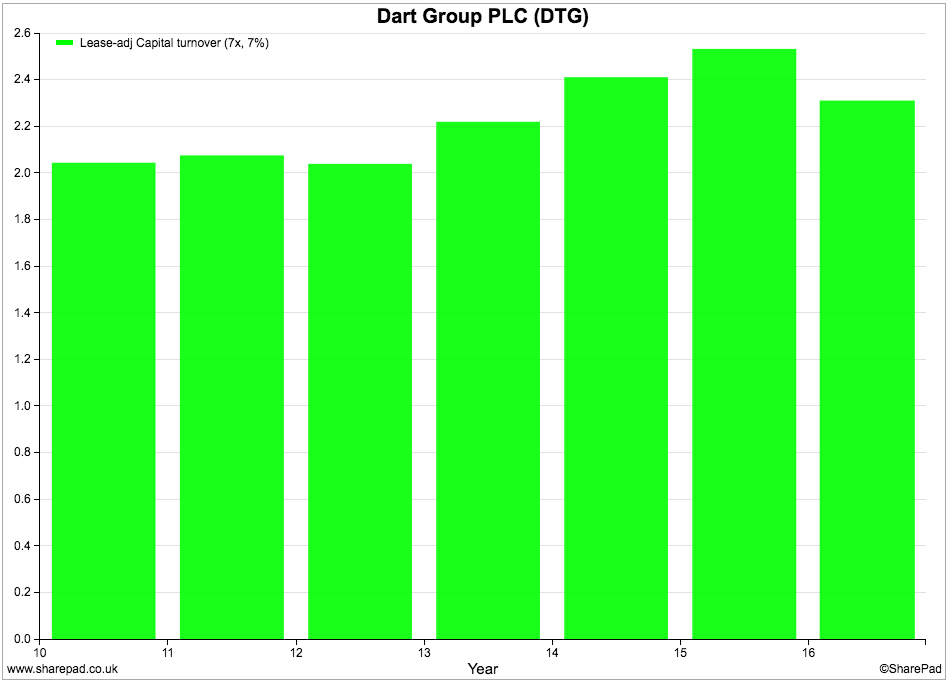
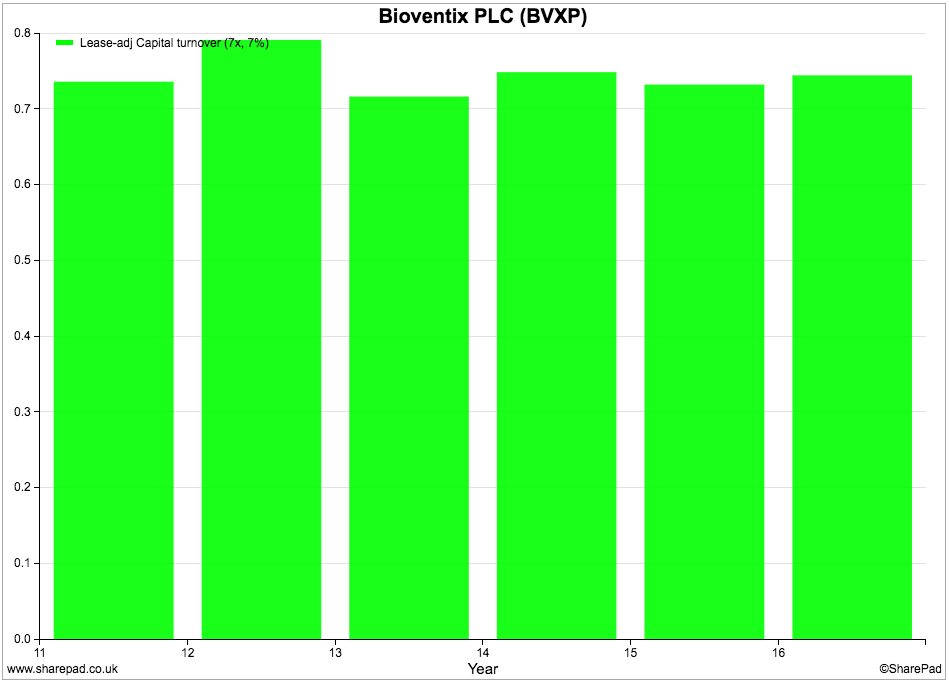
One excellent way to check the quality of a company's sales is to look at its Capital turnover ratio. This looks at the value of sales produced for each £1 of money invested. This ratio is best calculated using an adjustment for rented assets or leases. This is very easily done in SharePad.
When you come across a company that has been posting strong sales growth, you really want to see a stable trend - or preferably a rising one - of capital turnover. Dart Group (AIM:DTG) and Bioventix (AIM:BVXP) where sales growth has been averaging more than 20% per year for the last five years, look good on this measure.
Abcam (AIM:ABC) has seen its capital turnover ratio cut in half during the last five years as it has made acquisitions.
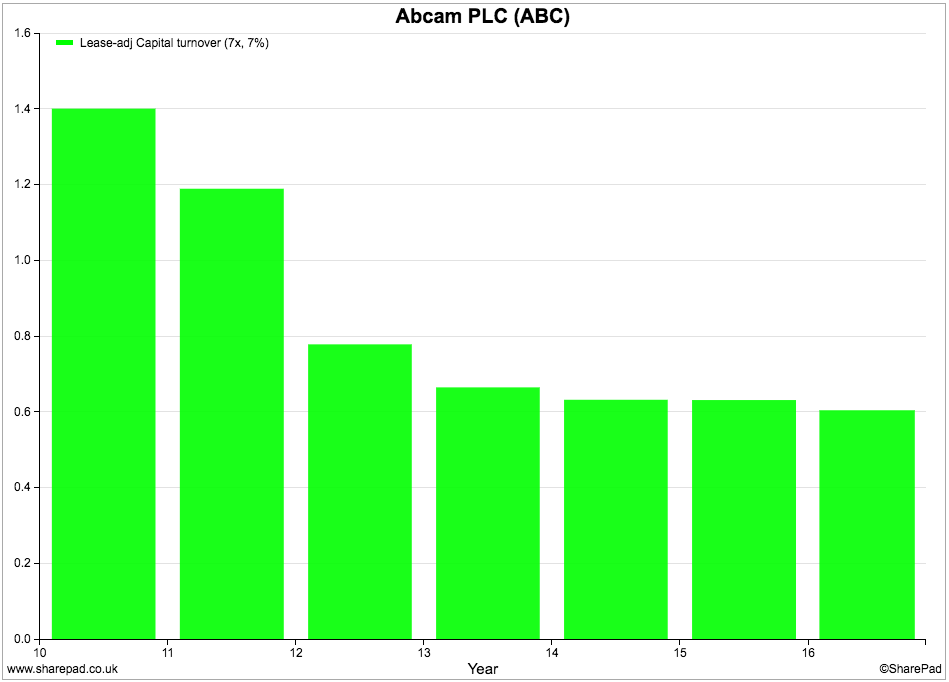
EBIT progress has been lacklustre and ROCE has come down significantly as shown in the Dupont analysis below. (To learn more about this really useful way of analysing a company click here.)
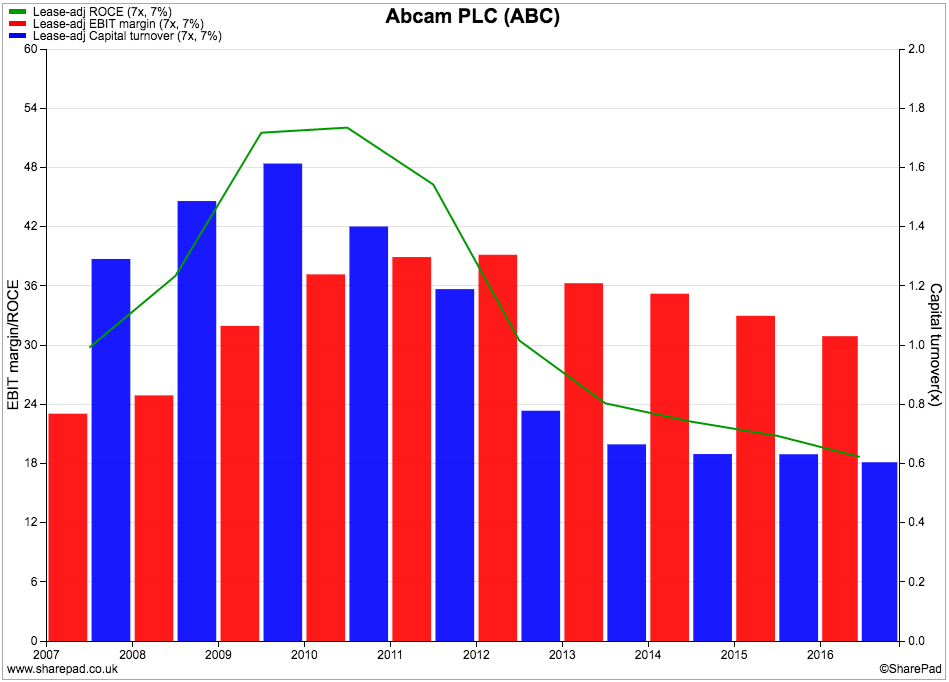
This has not stopped Abcam being a very lucrative share to own in recent years, but the sharp downwards trend in capital turnover and ROCE would concern me and I would want to do more digging before owning the shares.
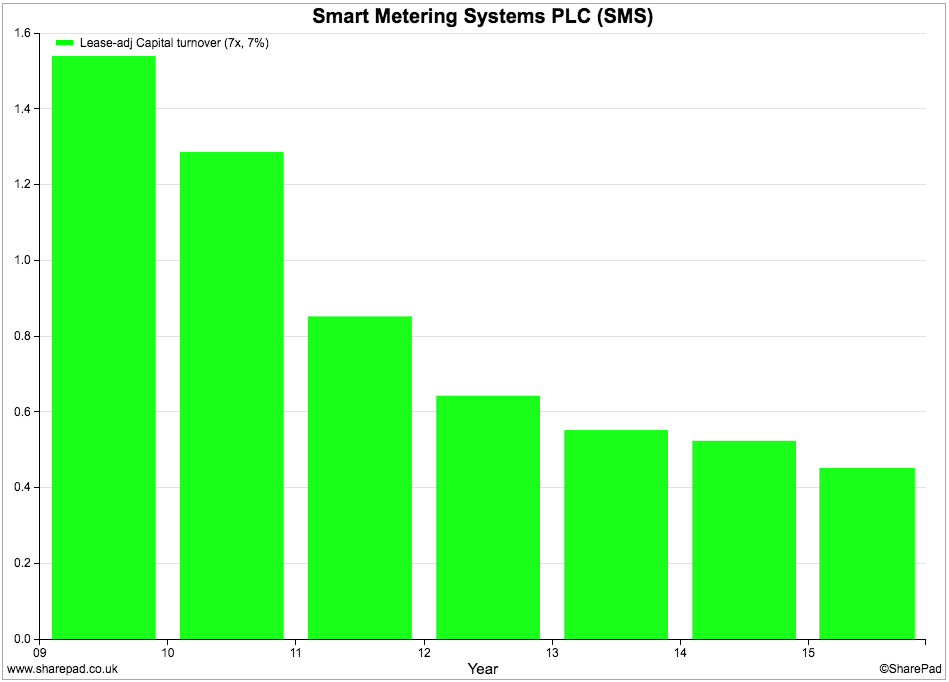
Another company which has grown sales rapidly is Smart Metering Systems (AIM:SMS), but it has also seen a collapse in capital turnover.
Unlike Abcam, it has been able to increase its profit margins (red bars) to offset this and see a much gentler decline in ROCE (green line).
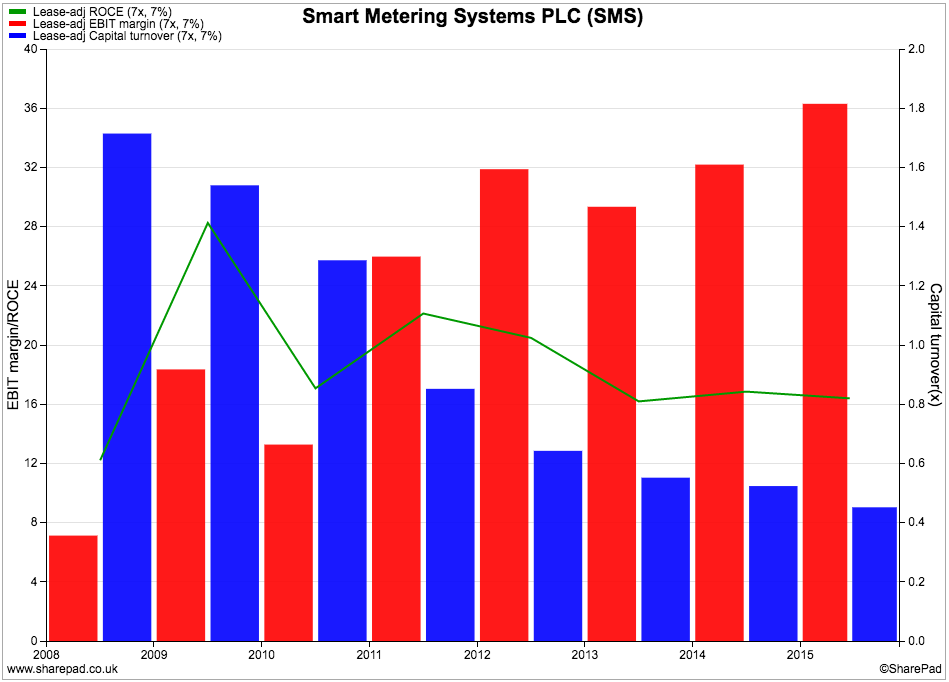
However, the risk to be aware of here is that if profit margins ever see significant falls, ROCE is likely to collapse.
Selling more on credit
I've left arguably the most important test of sales quality until last. Companies can increase their sales growth by offering more generous sales terms to their customers. You can spot this by looking at the ratio of trade debtors to turnover. The higher the ratio is, the bigger the proportion of sales invoices outstanding at the year end.
This can be nothing to worry about if it allows the company to win extra business with high-quality customers. However, if the ratio is increasing, it can be a sign of poor quality growth. Waiting longer to get paid reduces a company's free cash flow and might mean that it has to have a bigger overdraft to meet its day-to-day cash expenses (working capital). There is also a risk that credit is given to poor quality customers who might end up not paying their bills at all (bad debts) resulting in lower profits.
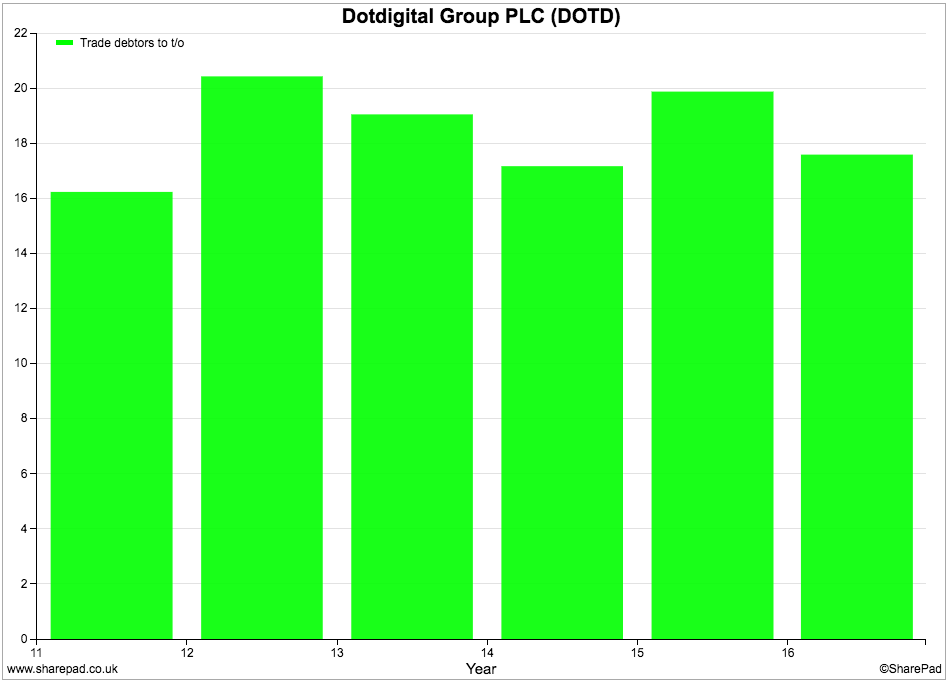
Ideally, you want to see a company growing its sales with a stable or declining trade debtors to turnover ratio. Computer software company DotDigital (AIM:DOTD) looks reasonable on this measure, despite having grown its sales at an average annual rate of nearly 25% over the last five years.
Dart Group, which looked good on a capital turnover basis, does not fare as well on trade debtors to turnover.
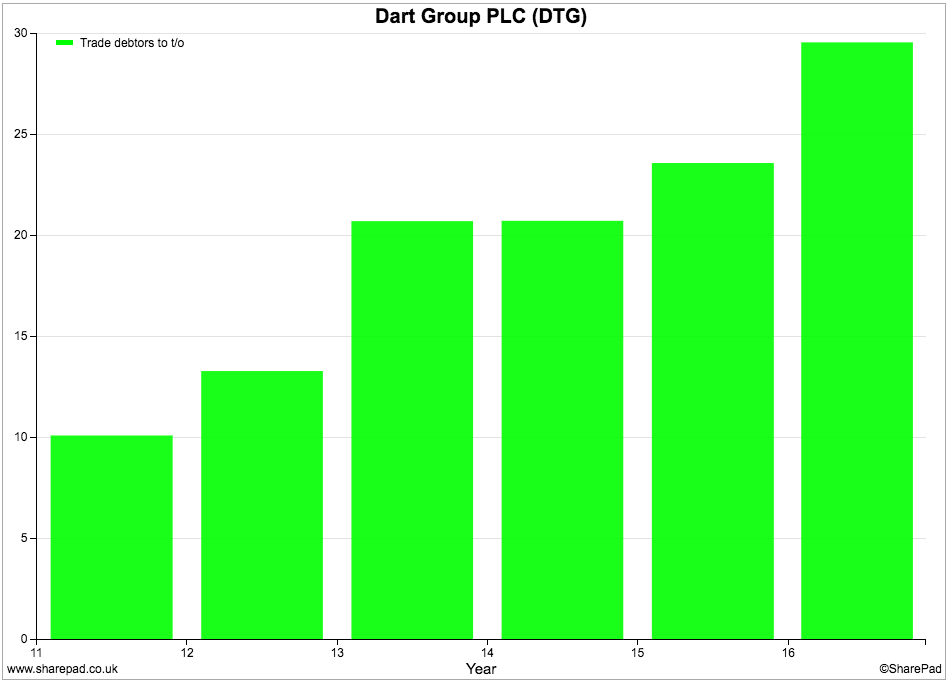
This ratio has gone from 10% in 2011 to nearly 30% in 2016. This is a big increase and can often be a sign of what is known as overtrading - and needs investigating. When you come across a situation like this you might find an explanation in the company's annual report. You want to try and find out as much as possible such as:
- Is the increase in debtors due to one major customer or lots of different ones? Could the default of a big customer threaten the solvency of the company?
- Is the age of the debtors getting longer? This would be a bad sign.
- Has the company made adequate provision for some of these debts going bad or will it have to do more and reduce future profits?
A rising debtors to turnover ratio can also be a sign of aggressive accounting and can be one of the first warning signs that all is not well. Pay attention to the size of the ratio as well as the trend.
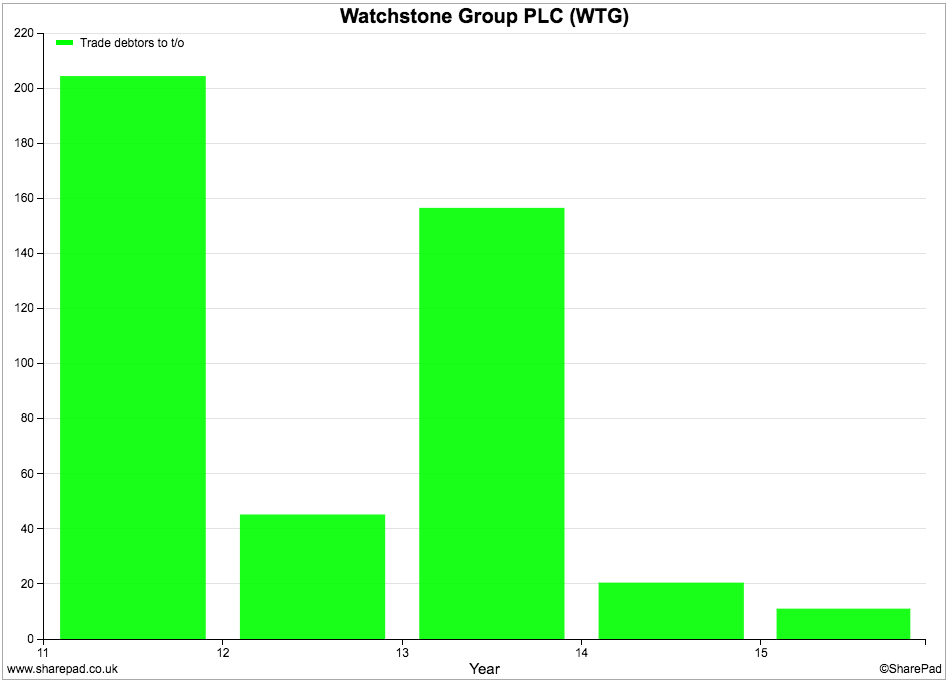
Watchstone Group (AIM:WTG), which used to be known as Quindell, became embroiled in controversy when some investors questioned the quality of its profits as trade debtors reached more than 200% of annual turnover. Today, the ratio is around 11% which doesn't usually give rise to any cause for concern.
As a rule of thumb, most good companies will rarely have a ratio of trade debtors to turnover of more than 25% and it is often a lot less. Globo, a high profile AIM bankruptcy in recent years, was growing its sales by nearly 50% in 2014 but saw its trade debtors to turnover ratio increase from an already high 40% in 2013 to 47.8%. It called in the administrators in November 2015 as it could no longer pay its debts.
If you have found this article of interest, please feel free to share it with your friends and colleagues:
We welcome suggestions for future articles - please email me at analysis@sharescope.co.uk. You can also follow me on Twitter @PhilJOakley. If you'd like to know when a new article or chapter for the Step-by-Step Guide is published, send us your email address using the form at the top of the page. You don't need to be a subscriber.
This article is for educational purposes only. It is not a recommendation to buy or sell shares or other investments. Do your own research before buying or selling any investment or seek professional financial advice.

