Is Benjamin Graham's "net net" strategy for finding undervalued shares relevant today?
One of the most enduring themes in today's stock market is the popularity of high-quality companies.
Companies that are perceived to be very profitable with high returns on capital employed (ROCE), large amounts of free cash flow and with good future prospects are seeing their shares change hands at very high valuations. Anyone who has owned shares with these characteristics has done very well. It seems that like many other things in life it pays to buy quality - for the moment at least.
Yet this trend has left one group of investors in a bit of a difficult situation. So called value investors have shunned these high-quality shares. They reason that they are too expensive and therefore too risky.
They might be right. Buying shares for well over 20 times earnings (PE) or free cash flow (P/FCF) usually implies lots of growth in the future. History tells us that very few companies are capable of delivering this and when the growth that had been priced into shares fails to materialise the share price can tank and investors lose a lot of money.
Of course, there is another argument that low interest rates on savings accounts and government bonds have made quality shares more attractive and they might not be as expensive as some people think. I've written more on this subject here.
However, if you are an investor who likes to go against the crowd and trawl the stock market for unloved bargains times have been tough. Not only has this style of investing been out of favour, but the general increase in share prices has meant that there are fewer genuine bargains out there.
Want to learn how to analyse shares like a professional? Download our FREE guide.
Sign-up to our mailing list to receive a PDF of our Step-by-Step Guide to Investing.
Share this article with your friends and colleagues:
Trawling for bargain shares with Benjamin Graham's "net net" filter
Benjamin Graham built his reputation as the "father of value investing" by buying unpopular shares that the stock market had largely ignored. He then waited for their fortunes to improve in order to bank a profit.
Graham didn't like taking big risks with his money and tried to avoid popular shares trading on high valuations. So he developed a way of looking for undervalued shares where he was unlikely to lose much money if his judgement and reasoning were wrong.
Instead of focusing on a company's profits, Graham often looked at its balance sheet. He looked for shares which he could buy for less than the value of its working capital (mainly stocks, debtors and cash) after all the company's liabilities had been deducted from it.
He calculated a company's net current asset value (NCAV) as follows:
NCAV = Current assets minus total liabilities
Divide your answer by the number of shares to get NCAV per share.
In other words, he wanted to buy the company without paying anything for the value of tangible assets such as land, buildings and plant and machinery. He wanted to get these for free. Companies that met these criteria became known as "net nets" as the value is net of all liabilities and fixed assets.
If possible, Graham would try and buy shares at no more than two thirds their NCAV per share value. By doing this he reckoned he was protecting himself if he bought a bad company as the value of it was already so low that he was unlikely to lose money. That said, Graham bought lots of shares - sometimes more than 100 - to spread his risk and achieved good results with the strategy.
Screening for NCAV shares in ShareScope
It is very easy to screen for shares trading below their NCAV per share in ShareScope. Just follow these simple steps:
- Select a list of shares such as the FTSE All Share index.
- Create a new filter.
- Apply a sector filter and exclude Equity Investment Instruments (mainly investment trusts).
- Add a criterion which looks for shares trading below their NCAV per share. You'll need to use the Combine item button feature as shown below:
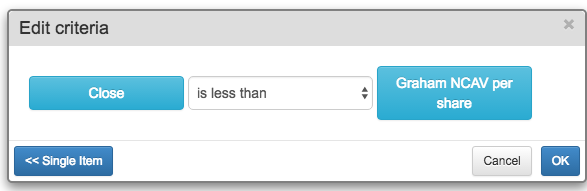
You will find the Graham NCAV per share option in the Ratio section of the Add criteria dialog.

Applying this filter to all the shares listed on the London Stock Exchange gives a list of 68 qualifying shares. However, many of these shares have tiny market capitalisations and would be very difficult to buy and sell without incurring lots of costs in the form of high bid-offer spreads (the difference between the quoted buying and selling prices offered by market makers in a share).
Setting a minimum market capitalisation of £20m provides a list of 11 shares. That is not very many and could be seen as a sign that there are few bargain-priced shares on the stock market right now.
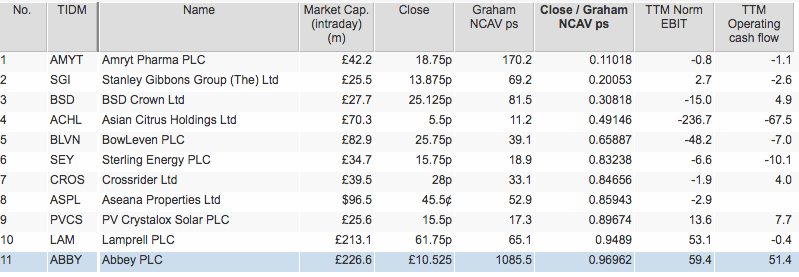
I've added an extra column to my results table using the combine item feature to give me the ratio comparing the last closing share price compared with the NCAV per share. As you can see, only five shares are trading for two thirds or less of their NCAV (below 0.66) - again showing how few shares there are currently trading at very low valuations.
So what do you do next once ShareScope has produced a list of shares for you?
Things to consider with NCAV shares
Blindly buying a list of NCAV shares and hoping for the best is probably not the best thing to do. Shares usually do not trade below their NCAV without good reason. More often than not the share price is distressed because the company is performing poorly and is expected to keep on doing so.
You are only likely to stand a chance of making money from a share trading below its NCAV value if the company can turn itself around. You need to try and avoid buying a dud share.
One of the first steps you can do in ShareScope is to add some more columns to your results table. Two important ones are operating profit and operating cash flow. A company that is losing money is going to struggle to pay its bills.
If a company is also not producing any operating cash flow then its cash balances are probably going to fall and debt balances rise. This means that its NCAV per share is going to fall and so its shares could be a value trap
Let's look at our list of shares again with these two columns added.

What we can see straight away is that a lot of these companies have been losing money. Only PV Crystalox Solar and Abbey have operating profits and positive operating cash flow on a trailing twelve month (TTM) basis.
Here's what I would do next:
- Check the company news in ShareScope. Has the company released a positive trading statement?
- Have a look at a one year share price chart. Are the shares in a long-term downtrend or have they already bounced? Have you missed the boat?
- Look at ratios such as interest cover and fixed charge cover. Can the company comfortably pay the interest on its borrowings and rents?
- Look at the bid-offer spreads on the shares. You can add columns for the bid and offer prices or for spread %. A wide spread between the buying and selling prices of a share are common in very small companies (PV Crystalox Solar has a spread of 6.25% as I write) and are probably best avoided.
- Have the directors been buying shares in meaningful amounts? This would be a good sign. You can check this in ShareScope by clicking on the green DD button.
Can you trust the balance sheet values?
The problem with valuing companies on the basis of their balance sheet values are twofold:
- A balance sheet value is a snapshot taken on one day of the year.
- Values of assets might be unrealistic (too high) and liabilities such as the pension fund deficit too low. Year-end borrowing levels might be lower than the average throughout the year.
These problems can mean that the latest NCAV per share number is too high which in turn could mean that a share is not as cheap as it looks.
When it comes to checking the value of the three main current assets - cash, stocks and debtors - there are lots of things that need to be considered. Let's deal with each of them separately.
Cash balances
Cash is usually seen as having few issues. Cash balances can be boosted by delaying the payment of bills or from a customer paying in advance (although this will be offset by a reduction in creditors and so does not overvalue the company).
Debtors
Debtors can be more problematic. Some of the company's debtors may not pay their bills resulting in bad debts. You can learn more about a company's debtors to give you an insight into whether bad debts might become a problem and reduce the balance sheet value of debtors.
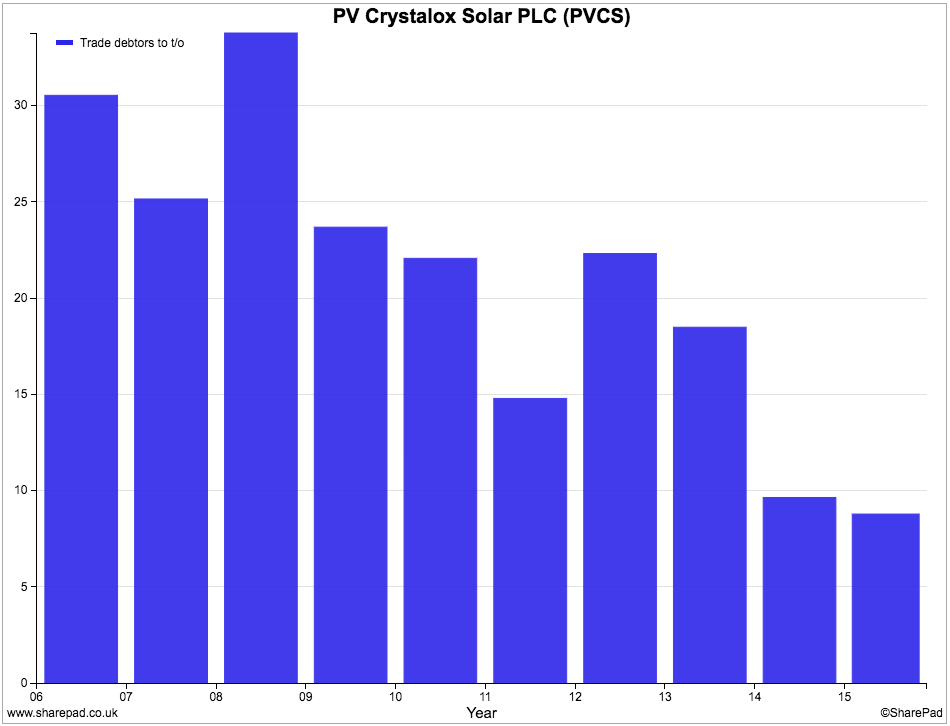
Look at the ratio of debtors to sales. A rising ratio might indicate that the firm has been trying to boost its sales by offering more credit. This can increase the chances of debts going bad and balance sheet values being reduced. You can easily check this in ShareScope.
The Trade debtors to turnover ratio for PV Crystalox Solar has been coming down as shown in the chart below.
Look in the company's accounts and study the debtors note carefully. Companies will often show you the provision they have made for bad debts in order to arrive at the balance sheet value.
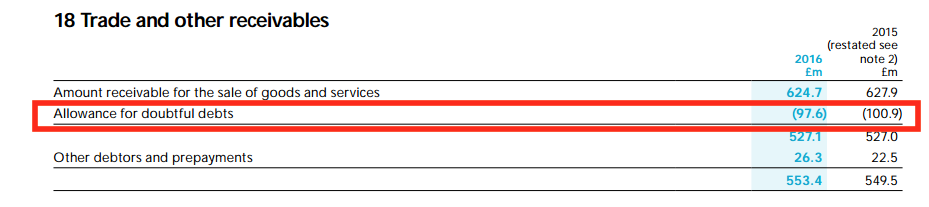
For this company, the value of trade debtors in 2016 is £624.7m. A £97.6m provision for bad debts reduces this to £527.1m. You can work out the percentage of gross debtors that is assumed to be bad by dividing £97.6m by £624.7m to get 15.6% and compare it with previous years (16.1%). If the ratio is a big number - 15% is - and is getting bigger then you will have strong grounds to question the value of debtors on the company's balance sheet.
Stocks
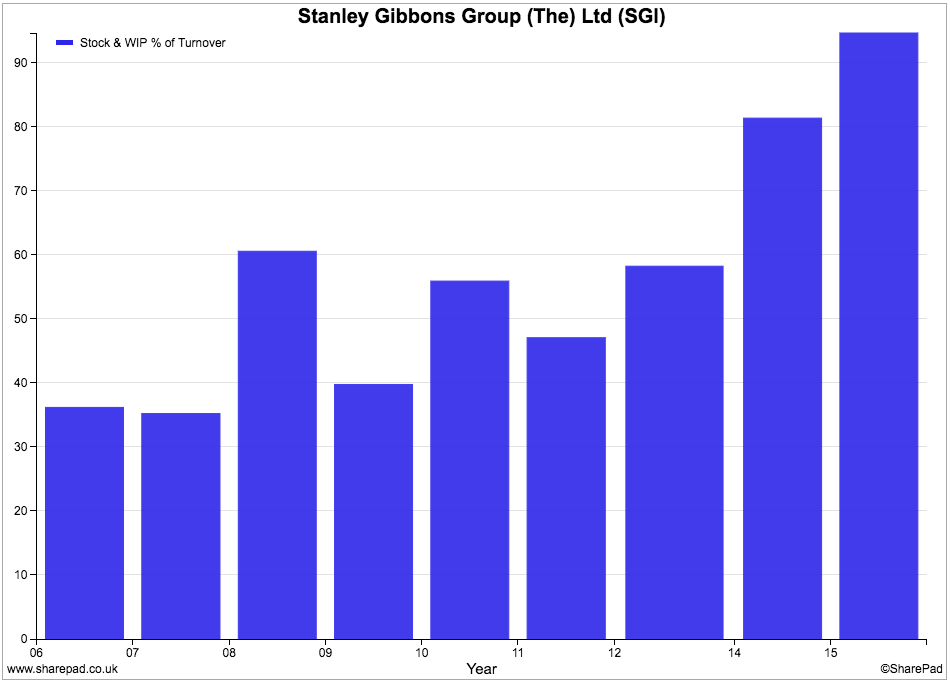
Unsold stocks of goods and raw materials have to be valued at the lower of cost or their net saleable value. As with debtor balances, look at the ratio of stock to turnover (sales). An increasing ratio might be a sign that a company has too much stock which might have to be reduced in value in order to sell it. Has this been going on at Stanley Gibbons plc?
Is NCAV investing still relevant today?
It's a lot less relevant at the moment.
It is important to note that the makeup of the stock market has changed significantly since Graham's day. As our economy has become more based around the service sector than manufacturing, companies have relatively fewer current assets (no stock) than they did between the 1930s and 1970s.
This means that finding shares that are trading for less than NCAV is going to be more difficult. Yet the absence of lots of shares with these characteristics might be another sign that the stock market is richly valued just now.
However, it does not mean that you cannot find cheap shares. It just means that you are probably going to have to look for them in a different way.
You are probably going to have more success looking for shares with low multiples of earnings, free cash flow or where there is a big discount to earnings power value (EPV).
This article is for educational purposes only. It is not a recommendation to buy or sell shares or other investments. Do your own research before buying or selling any investment or seek professional financial advice.

