Stock Watch: N Brown
N. Brown is not a name that most people are familiar with but to certain groups of shoppers its brands of Jacamo and JD Williams are. The retailer has carved itself a profitable niche in selling ranges of clothes to people that other retailers weren't really bothered about. It specialises in larger sized clothes and clothes for the over 50s age group. It also sells to many of its customers on credit and makes a profit from that as well.
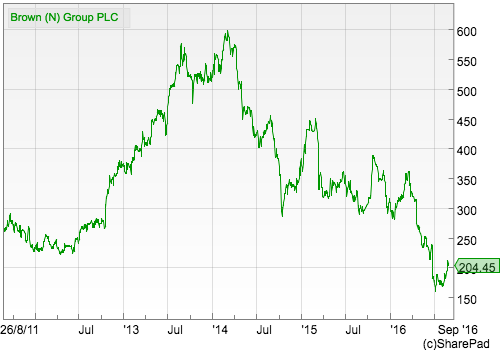
Up until 2014 the company's share price had been moving nicely upwards, but since then times have become much tougher for the company. The progress in its profits has disappointed investors and this has resulted in the share price trading at around a third of its 2014 peak. In fact, it wouldn't be too unkind to say that the shares are looking a little distressed at its current levels.
Time to open up ShareScope to see if there's anything of potential interest to investors.
Want to learn how to analyse shares like a professional? Download our FREE guide.
Sign-up to our mailing list to receive a PDF of our Step-by-Step Guide to Investing.
Share this article with your friends and colleagues:
Sales and profit history
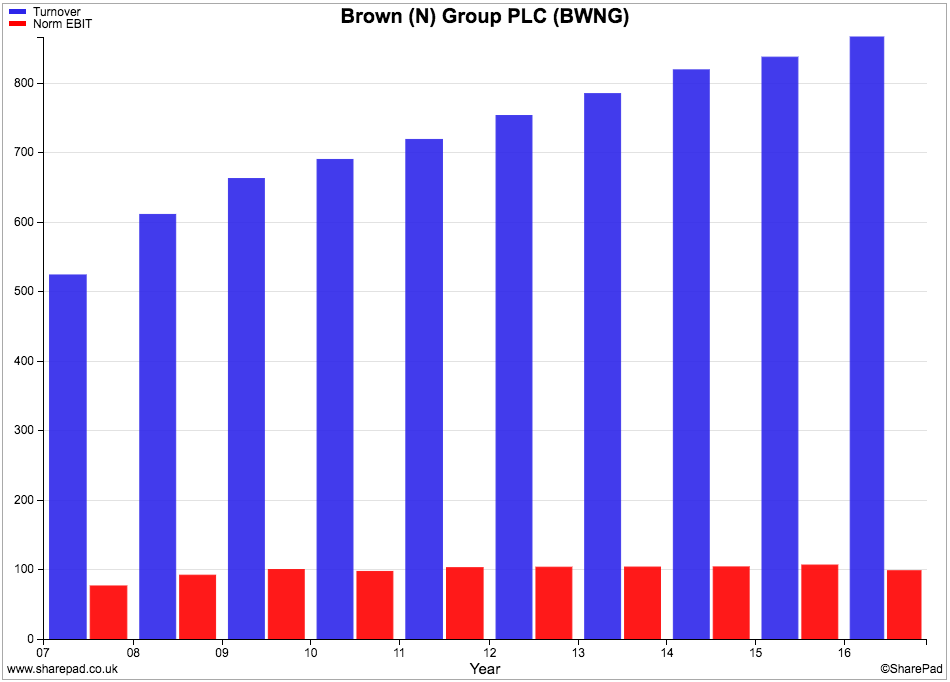
The first thing that jumps out at you when looking at the company's financial history is that it seems to have been quite successful at growing its sales but turning those sales into growing profits has been hard to do. This is not a good sign.
In fact, a closer look shows that its normalised trading profits (EBIT) have essentially stagnated for some time now. This is telling me that it is becoming less profitable. EBIT margins were over 15% in 2008. They were 11.3% in the year to February 2016. This quite a big drop and a disturbing trend. Not one that you would associate with a flourishing business.
Financial Returns
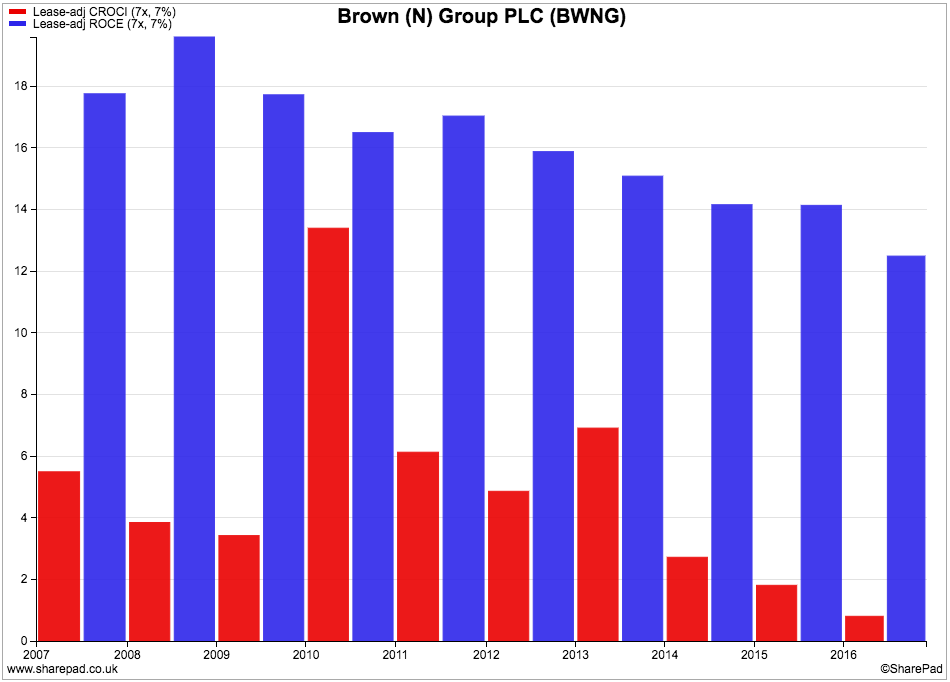
ROCE has also been on a declining trend and is showing that the company is getting less bang for its buck. A lease-adjusted ROCE of over 18% eight or nine years ago was a good number. Fast forward to 2016 and that ROCE number is just above 12%. That's not bad by any means but it is probably not the hallmark of an outstanding business.
What is more noticeable is the very low free cash flow returns on capital employed (CROCI) that the company has been producing in recent years. A look back over the last decade shows that CROCI has tended to be very low. It seems that this company is not very good at turning its profits into cash which is rarely a good sign and often a bad one.
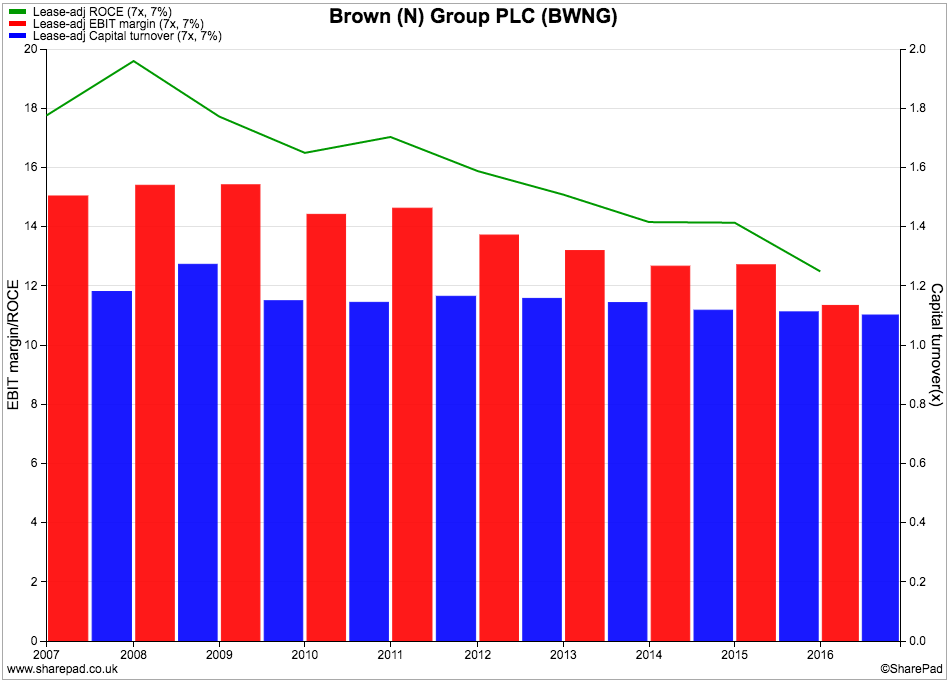
Before we look at N Brown's cash flow further, let's take a closer look at why its ROCE has been falling. The DuPont analysis chart below shows that ROCE has been almost entirely driven by falling profit margins. Capital turnover - the value of sales generated per £1 of capital invested - has been quite stable.
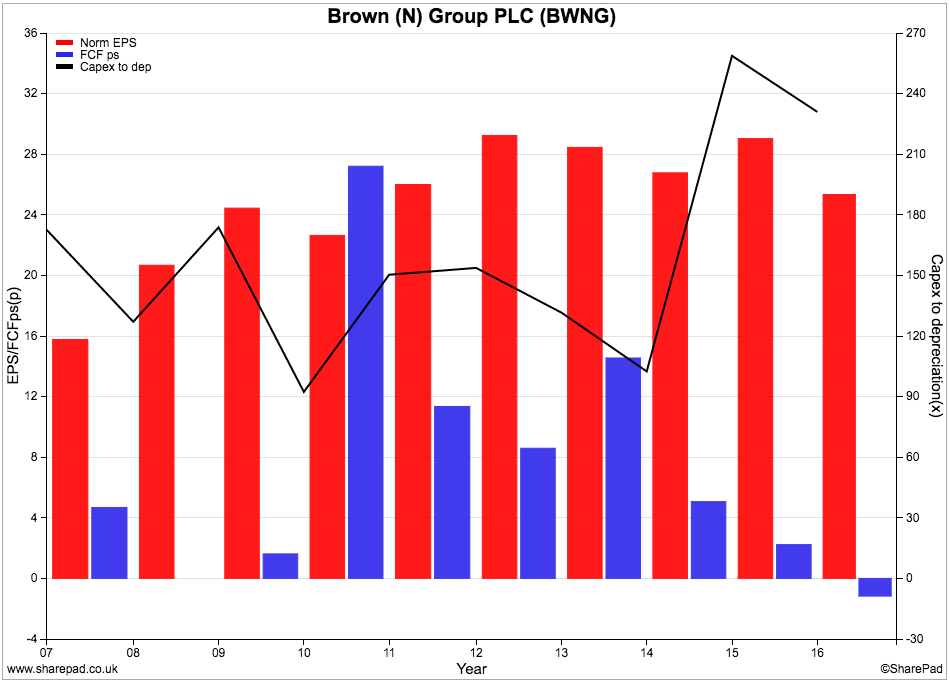
Returning to the company's free cash flow performance. We can see that free cash flow per share has only been greater than normalised EPS once since 2007. Quite often the difference between the two numbers has been very big.
This needs investigating. A lengthy period of investing in new assets (capex) can often explain why free cash flow per share is quite a lot lower than EPS- as was the case in 2015 and 2016. This is fine if ROCE is being maintained or increasing. But if it isn't then it might be a warning sign that all is not well with a company. It might even lead you to ask whether its profits are believable or not which would be very worrying.
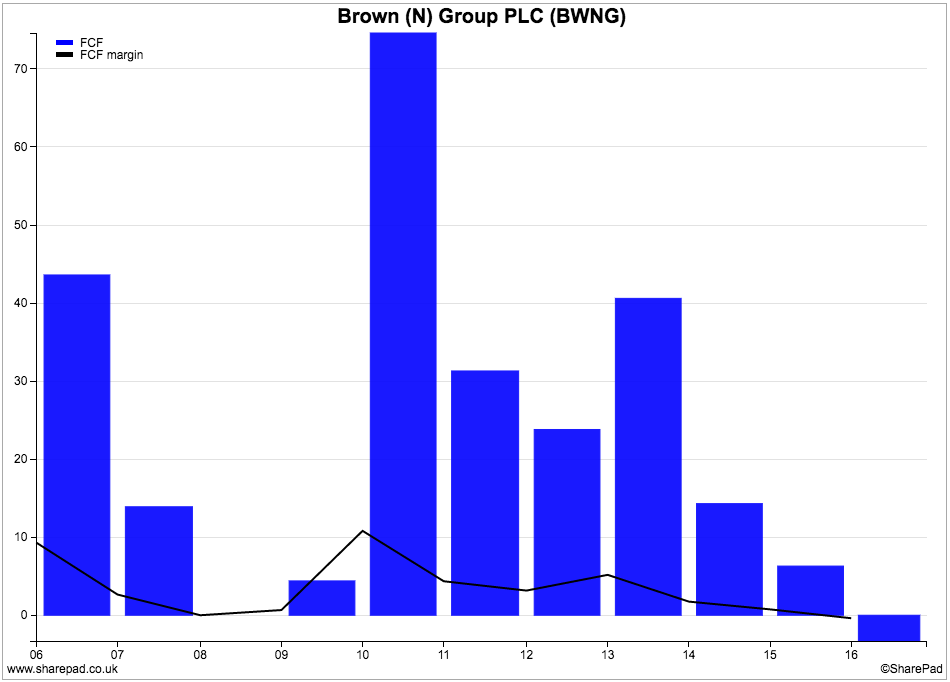
As you can see from the chart below, free cash flow has been falling and turned negative in 2016. The free cash flow margin has also been very low with the exception of 2010.
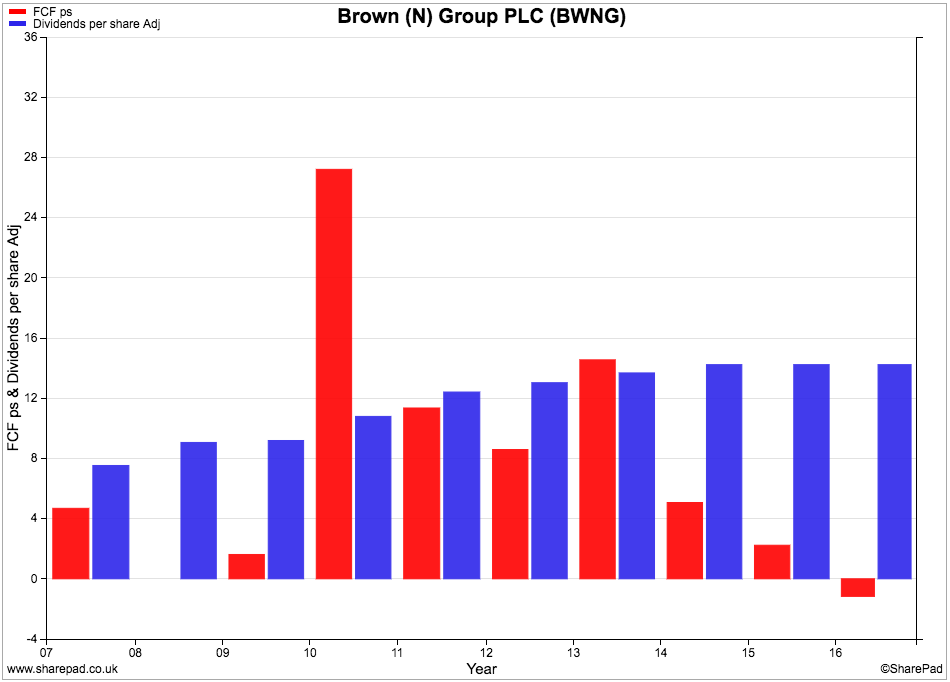
Despite the poor free cash flow performance, the company has kept on paying a cash dividend to shareholders. Yet the free cash flow per share has been nowhere near covering it. Is this a sign that N Brown's dividend is unsustainable and will eventually be cut?
A closer look at the company's cash flow is in order.
Below is a screenshot of the company's cash flow statement in ShareScope. I have highlighted what I see as three key issues:
- Regular cash outflows from increases in debtors.
- Related, frequent cash outflows from working capital.
- A spike in capex in 2015 and 2016.
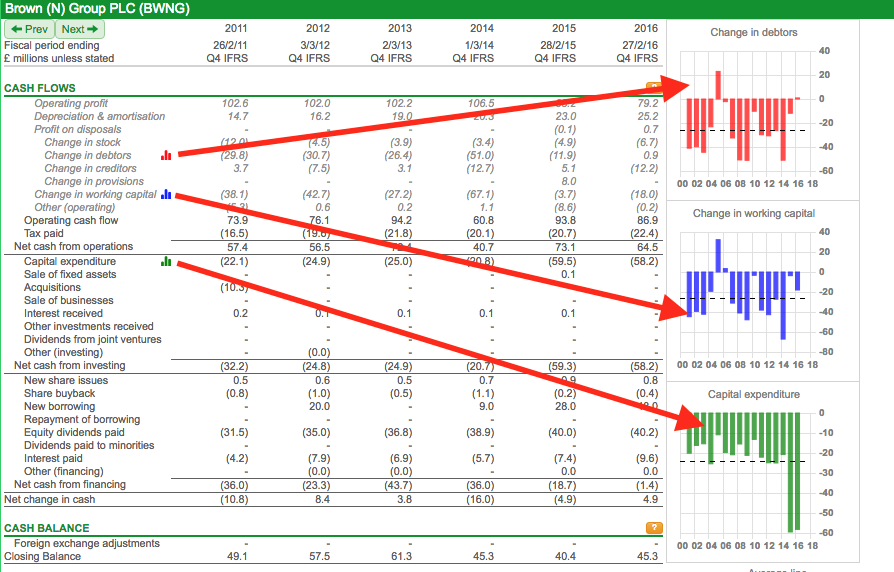
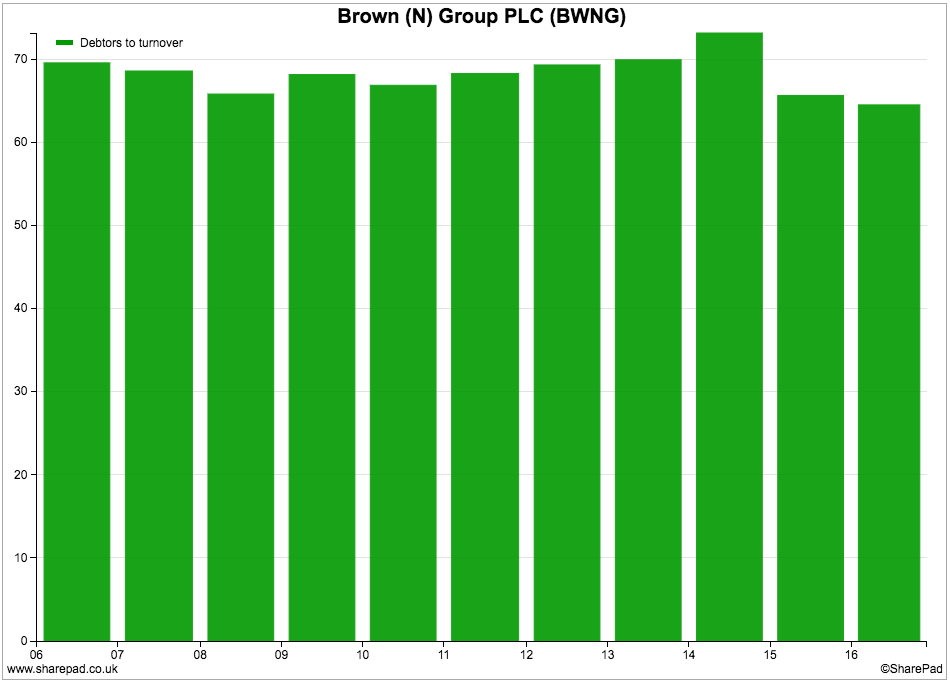
Because it sells goods on credit, N Brown has to wait to turn its sales into cash flow. The company has a very high ratio of debtors to turnover of just over 60% down from over 70% in 2014. In fact, 2016, saw a small cash inflow from reducing debtors but in previous years very large amounts of cash have been flowing out from them.
It is a lot easier to grow sales if you offer your customers credit than if you do not. Profits are booked when the goods are sent to the customer but N Brown has to wait for the full amount in cash which means that its free cash flow will be less than its profits.
However, there is a danger that some of the cash will never arrive as customers might default on their debts. In 2016, N. Brown provision for bad debts was 15.6% of the amount of credit outstanding down from 18.3% in 2014. This is a very big number and does lead you to question the quality of sales. Worryingly, N Brown has said that the provision rate is likely to go up again in 2017 which will damage its profitability and cash flow.
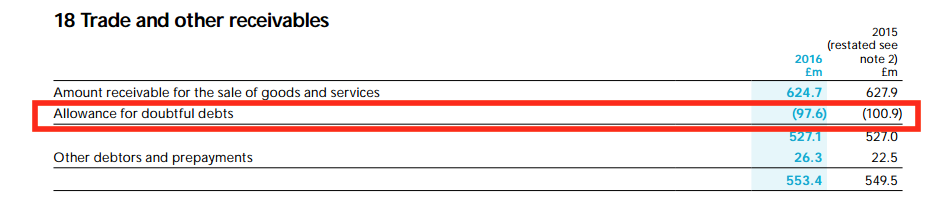
You can see from a note to its 2016 annual report that the company expects £97.6m of its total trade debtors (credit given to customers) not to be paid.
Dig a little deeper and you will find out some more very interesting information.
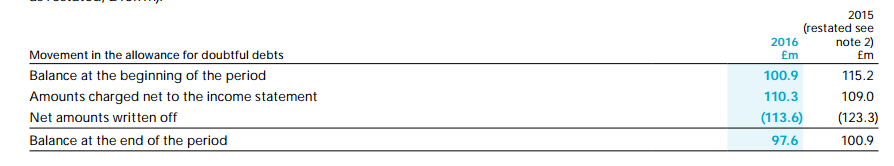
If we look at how the balance for doubtful debts has moved throughout the last year we can see that profits were reduced by £110.3m in 2016 - more than the total amount of profit altogether - and that £113.6m of credit was written off.
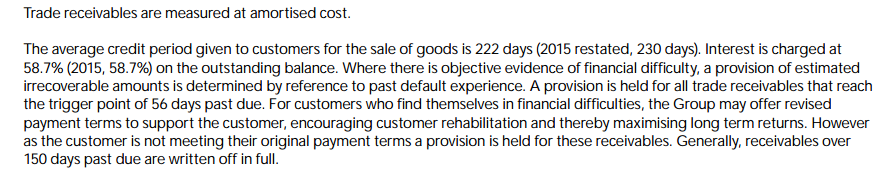
You then discover that N Brown thrives on its customers being in debt to them as it charging them an interest rate of 58.7% on outstanding balances.
I haven't gone into the maths but it seems to me that the company makes most of its money from credit interest and not that much from selling clothes. The gross profit from financial services in 2016 was £141.7m with the bulk of the other operating costs of the business probably allocated to clothing. What I am effectively saying here is that I think most of the gross profit for Financial Services was trading profit or EBIT. Total EBIT for the whole company was £98.2m.
So whilst large debtors is not usually a desirable characteristic of a company, it is part and parcel of N Brown's business model as it gets paid a hefty interest rate on outstanding credit balances but pays a price in terms of very poor free cash flow. This may mean that you might not like the quality of profits but I don't think there is anything bad going on here.
The way to look at this is that the company creates trade debtors to generate a significant interest income in return. It also expenses bad debts against its income to reduce profits. If the company was just creating lots of debtors to increase sales - and getting no interest in return - I would be more worried about what was going on.
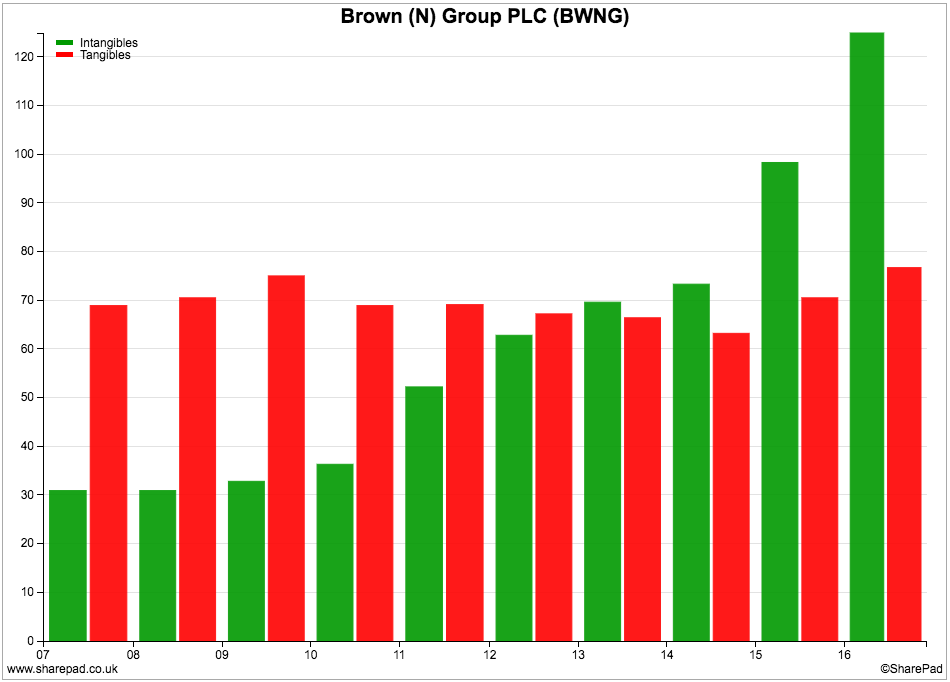
The other interesting part of the cash flow statement is the big rise in capex in 2015 and 2016. This is largely due to the company upgrading its IT systems. Capex should fall back to around £40m in 2017 but this will still be higher than a sharply rising depreciation and amortisation expense of around £30m due to a big increase in intangible assets in recent years.
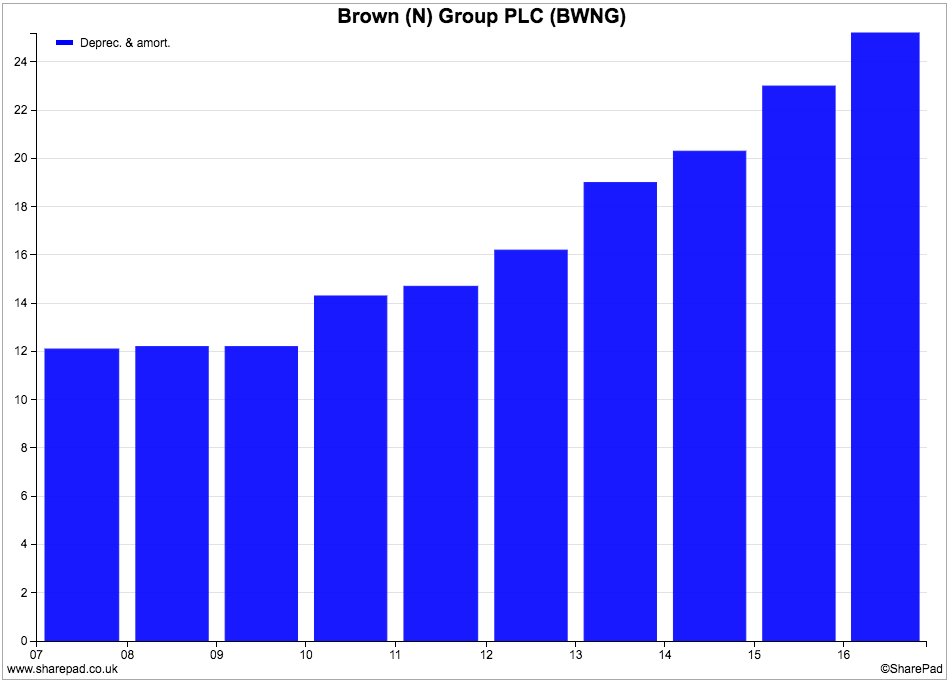
One item to keep an eye on is spending on tangible fixed assets. The amount on the balance sheet hasn't grown that much in recent years. A new warehouse has been built recently and suggests that the company is investing in new assets and not underinvesting but this may see capex stay higher than depreciation for a while which will reduce free cash flow.
Financial position
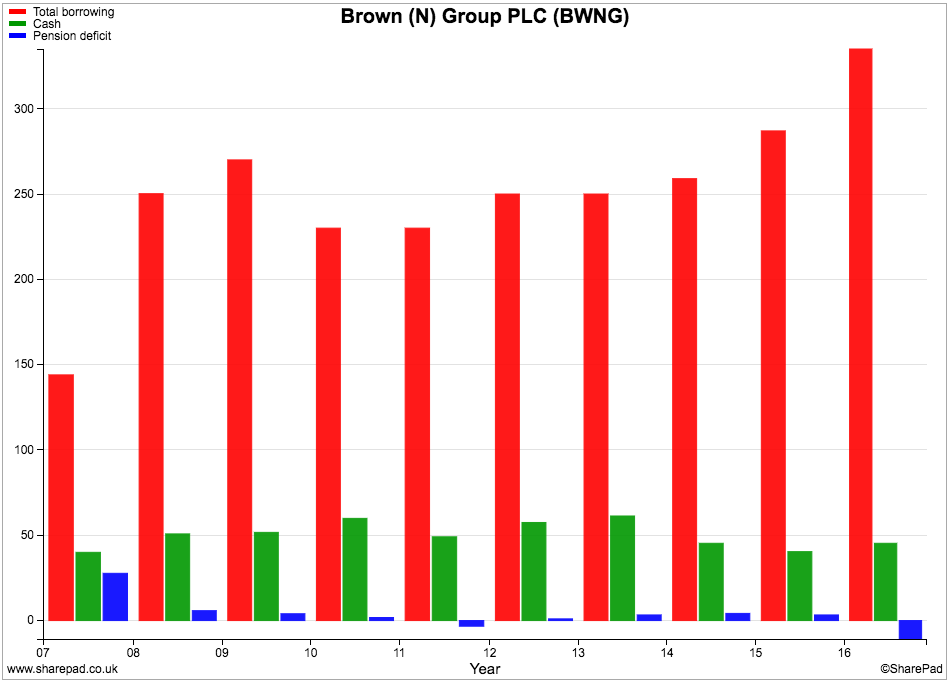
Borrowings have increased during the last couple of years due to the company's weaker free cash flow and the continued payment of a £40m cash dividend.
If you look at the company's profits then interest cover was a comfortable 12.3 times. On a cash flow basis (operating cash flow less depreciation divided by interest paid) it is still 6.4 times and nothing to worry about.
The pension fund deficit has been wiped out and was in surplus at the last balance sheet date.
Future prospects and valuation
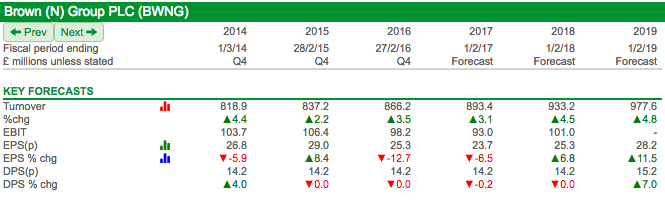
N Brown is struggling to grow its profits due to a very competitive and difficult clothing market in the UK. City analysts expect profits to fall in 2017 as trading remains subdued and costs rise. A recovery is expected thereafter but EPS in 2019 is not expected to be above the level achieved in 2015.
The bad debt levels are also expected to increase but credit income is expected to grow. The company hopes that its new IT system will help it buy better and reduce the markdowns on its stock and help boost profits in the future. That said, a weaker pound will make buying products from abroad more expensive in 2016/17.
Given the company's difficulties it is not that surprising to see its shares trading on very low valuations. At 207p, they trade on a forecast PE of 8.8 times and offer a prospective dividend yield of 6.8%. They also trade below their earning power value based on last year's EBIT.

Some investors will undoubtedly find the dividend yield tempting. However, the dividend per share has been held at 14.2p since 2014 and is expected to remain at that level for the next couple of years. Given the company poor free cash flow characteristics though the sustainability of the dividend has to come into question which is what the high yield seems to be implying (see How to tell if dividend shares are cheap or expensive).
To sum up
- The company has been struggling to grow its profits for some time.
- ROCE has been falling due to lower profit margins.
- CROCI numbers are low.
- Selling goods on credit means that N Brown has a very poor free cash flow performance.
- Its profits look to be genuine but may not be of the highest quality.
- The rate of bad debts is very high and costs the company a lot of money.
- It seems as if the company makes most of its profit from credit interest rather than selling clothes.
- Capex has spiked higher during the last two years.
- Increased investment in software will increase amortisation expenses.
- The dividend is not covered by free cash flow and could be vulnerable to a cut.
- The low share price and high dividend yield suggests that the dividend is vulnerable or future dividend growth will be small.
This article is for educational purposes only. It is not a recommendation to buy or sell shares or other investments. Do your own research before buying or selling any investment or seek professional financial advice.

