How useful a measure is net asset value (NAV)?
Many value investors have become successful by focusing on a company's assets as well as its profits and cash flows.
They spend a lot of time studying balance sheets, looking at a company's assets such as land, buildings, stocks of goods and money owed by customers (trade debtors) as well as liabilities such as borrowings, outstanding bills (trade creditors) and pension schemes.
If you take away the value of liabilities from the value of assets and you get what is known as a company's net asset value or NAV for short.
Want to learn how to analyse shares like a professional? Download our FREE guide.
Sign-up to our mailing list to receive a PDF of our Step-by-Step Guide to Investing.
Share this article with your friends and colleagues:
Calculating NAV
Let's see how you calculate NAV by looking at the balance sheet of housebuilder Barratt Developments.
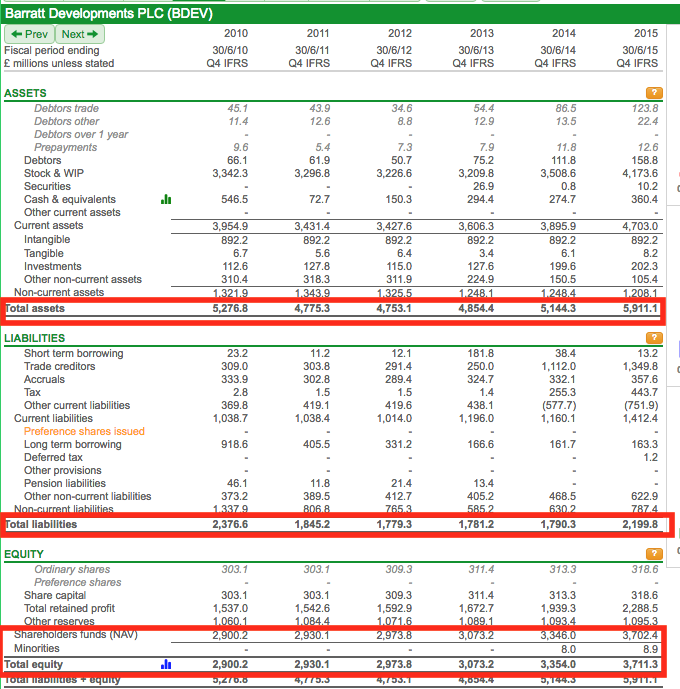
For the year ending June 2015, we take its total assets of £5911.1m and take away total liabilities of £2199.8m. This leaves £3711.3m remaining which equals the amount of total shareholders' equity in the company.
To get to the NAV for the company we then make another adjustment by taking away the part of the business which belongs to outside shareholders or minority interests. This is £8.9m which gives a NAV of £3702.4m. If we then divide this number by the 995.5 million shares that were outstanding at the balance sheet date we get a NAV per share of 371.9p.
Why some investors use NAV to select shares
The example of Barratt Developments above shows one of the main rules of accounting. This is that the NAV figure must equal the value of the shareholders' equity in a business.
It can also be seen as an estimate of what shareholders might receive if the company was closed down and all the assets were sold off and all the liabilities were paid.
In practice though, this is rarely the case. Assets and liabilities may be worth more or less than their balance sheet values.
Some investors are more trusting in asset values than profits. They reason that there's less scope to manipulate them and that there may be some hidden, alternative value that doesn't show up in the income statement. If they can buy the shares for less than their NAV then they might be bagging themselves a bargain.
One of the main reasons to look at asset values is that it can be a good way to look at companies that might be temporarily going through a hard time and not making any profits. In some cases looking at NAV might help you find an undervalued share whereas a PE ratio or dividend yield wouldn't.
You can look for potentially cheap shares by comparing the share price of a company with its net asset value (sometimes referred to as book value) per share. This measure is called Price to NAV or Price to Book value. If you can buy a share at a big discount to its book value (a price to NAV a lot less than 1) then it might be possible to make money from it when business conditions improve. History tells us that this can be a very profitable investment strategy.
I've run a quick filter in ShareScope which tells me that there are currently 102 companies with a market capitalisation of more than £50m (late August 2016) with share prices trading at 20% or less than their NAV per share - or a price to NAV ratio of 0.8 or less.
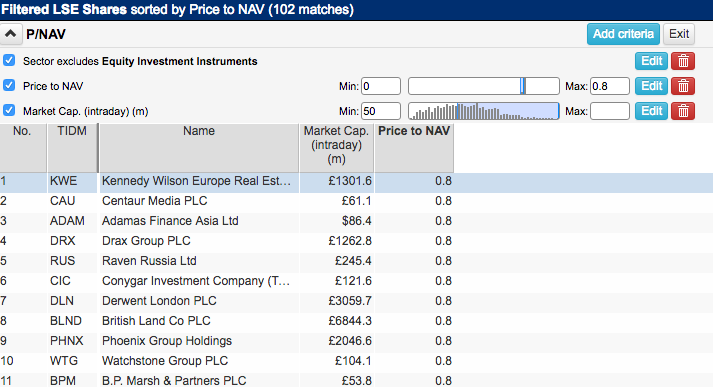
You can run the same filter in ShareScope.
So should you just go out and buy some of these shares and wait for the profits to roll in?
Not quite. You might get lucky with some shares but as with most things in investing there's a few more things that you need to consider before taking the plunge and parting with your cash.
Trying to understand NAV
In its most basic form NAV is just a number. You need to try and understand what that number is telling you. When you start digging a little deeper you will often find out that there is more to a company's NAV than initially meets the eye.
Here are a few things that you need to consider.
NAV is a snapshot value
NAV is calculated from a company's balance sheet which is taken on the last day of a financial reporting period such as every six months or every year. It is the value on that day only which might be different to the NAV today, especially if the business has seen changing profits or the company has made a big acquisition.
Intangible assets
Some companies can have large intangible assets such as brands, patents and goodwill (the amount above NAV that the company has paid to buy other companies in the past) which can be difficult to value. They might be very valuable but they might not be.
To err on the side of caution some investors like to exclude the value of a company's intangible assets and not pay for them. They look at something called net tangible asset value (NTAV) instead.
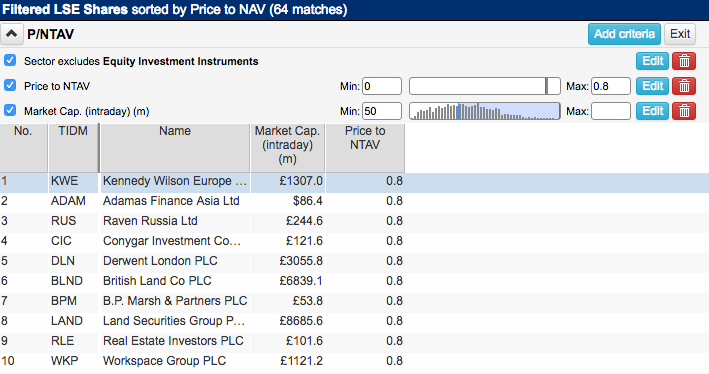
If we run a filter in ShareScope to find shares at a 20% discount to NTAV the list of qualifying shares falls from 102 to 64.
Overvalued assets and undervalued liabilities
Another issue to consider is that the asset values on the company's balance sheet might be unrealistic - they might be too high. With the exception of property companies and financial companies who value assets at market values, other companies value them at the lower of cost or market value - but these adjustments may only be made periodically.
Struggling companies might have customers that won't pay them which means that the value of debtors on the balance sheet is too high. Stocks of unsold goods can fall in value as well and will have to be reduced in value.
Fixed assets such as properties and plant and machinery might also be overvalued. One way to find out whether this might be the case it to look at the profits that they produce. A quick rule of thumb I use it to look at the company's trend in return on capital employed (ROCE). If ROCE is less than 7-8% then I might start thinking that the value of a company's assets is overvalued.
What I am effectively saying here is that if a company's assets can't make a satisfactory level of profit - a high enough return - then they are not worth the value they are stated at on the balance sheet. Intuitively this makes sense as the intrinsic value of any asset is related to the amount of profit or cash that it will produce over its life.
Companies regularly review the carrying value of the fixed assets on their balance sheets with something called an impairment test. They will estimate the profits and cash flows that the assets can make in the future and value them. By looking at ROCE yourself you can sometimes spot potential asset write downs (reductions) before the company actually does them.
One thing to watch out for is the potential for undervalued liabilities which can overstate a company's NAV or NTAV. The main liability in this respect is a company's pension fund deficit.
In recent months interest rates on bonds have fallen sharply which will increase the cost of paying final salary pensions in the future. If interest rates don't rise then these pension liabilities will increase at the next balance sheet date and reduce NAV and NTAV.
I tend to think about final salary pension scheme liabilities in overly simplistic terms but I find it helps people understand them quite well. Let's say you have to pay a pension of £10,000 to a retired employee and interest rates are 10%. You might need £100,000 invested in the pension fund to pay that pension (£100,000 x 10% = £10,000).
If interest rates fall to 5% then you need £200,000 to generate an annual income of £10,000 (£20,000 x 5% = £10,000). Final salary pension schemes are more complicated than this in practice but this simple example explains why pension scheme liabilities increase when interest rates fall.
For more on pension deficits click here.
Hidden liabilities
Some liabilities are not disclosed on a company's balance sheet. Companies which rent or lease assets instead of owning them can have big future liabilities which are expensive to cancel or get out of.
These hidden debts would have to be paid if a company was broken up or liquidated and would reduce NAV and NTAV. Bear this in mind if you are thinking of buying a share based on its balance sheet asset value.
You can find out the capitalised value of leases using the Investor Tools button in ShareScope.
If a company went out of business and was liquidated then redundancy costs would probably have to be paid as well. This would also reduce NAV and NTAV.
When to use NAV and NTAV
NAV and NTAV are not always useful measures, particularly when companies don't have a lot of assets. In most cases, valuing a company on the basis of its profits or cash flows is better.
However, companies where there are potentially lots of realisable assets that could be turned into cash are well suited to using a NAV and NTAV measures. In particular companies in these sectors:
- Banks and Insurers
- Property
- Housebuilders
- Investment trusts
- Mining
A practical filter for finding shares using asset values in ShareScope.
Below is a filter that you might want to try if you are screening for cheap shares based on asset values: It has four main criteria:
- A market capitalisation of more than £50m to exclude very small companies with shares that can be difficult and expensive to buy and sell.
- A P/NTAV of less than 0.8 (20% discount) and greater than zero in order to avoid companies with negative NTAVs.
- A ROCE of 8% or more. So the assets are probably worth what they are valued at on the balance sheet.
- A Piotroski F-Score of 6 or more. The company has an improving financial position.
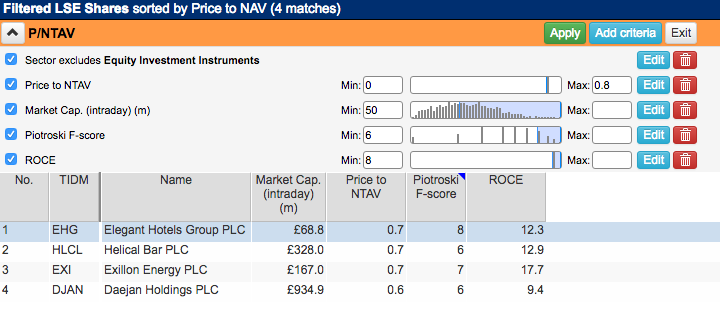
This filter has not produced a very big list of shares to look at which might be telling us that there aren't many cheap and improving companies out there.
However, with ShareScope you are in charge of your screening. Feel free to relax or exclude some of the criteria or include different ones. Have a look at my library of articles to get some ideas.
This article is for educational purposes only. It is not a recommendation to buy or sell shares or other investments. Do your own research before buying or selling any investment or seek professional financial advice.

