Using ShareScripts in ShareScope Part 2: Indicator scripts and ShareScript Studies
ShareScripts are files which can be used to provide additional functionality in ShareScope Plus and ShareScope Pro.
You can use ShareScripts to draw analytics and other useful items on the charts. They can be used to create custom columns, filters and alarms, and can also be used to export data.
For more information about coding ShareScripts have a look at our ShareScript documentation available here.
If you would like to view the ShareScript library outside of ShareScope you can locate it here.
Indicator ShareScripts
Indicator scripts can be used on the main chart or in their own indicator window below the main chart.
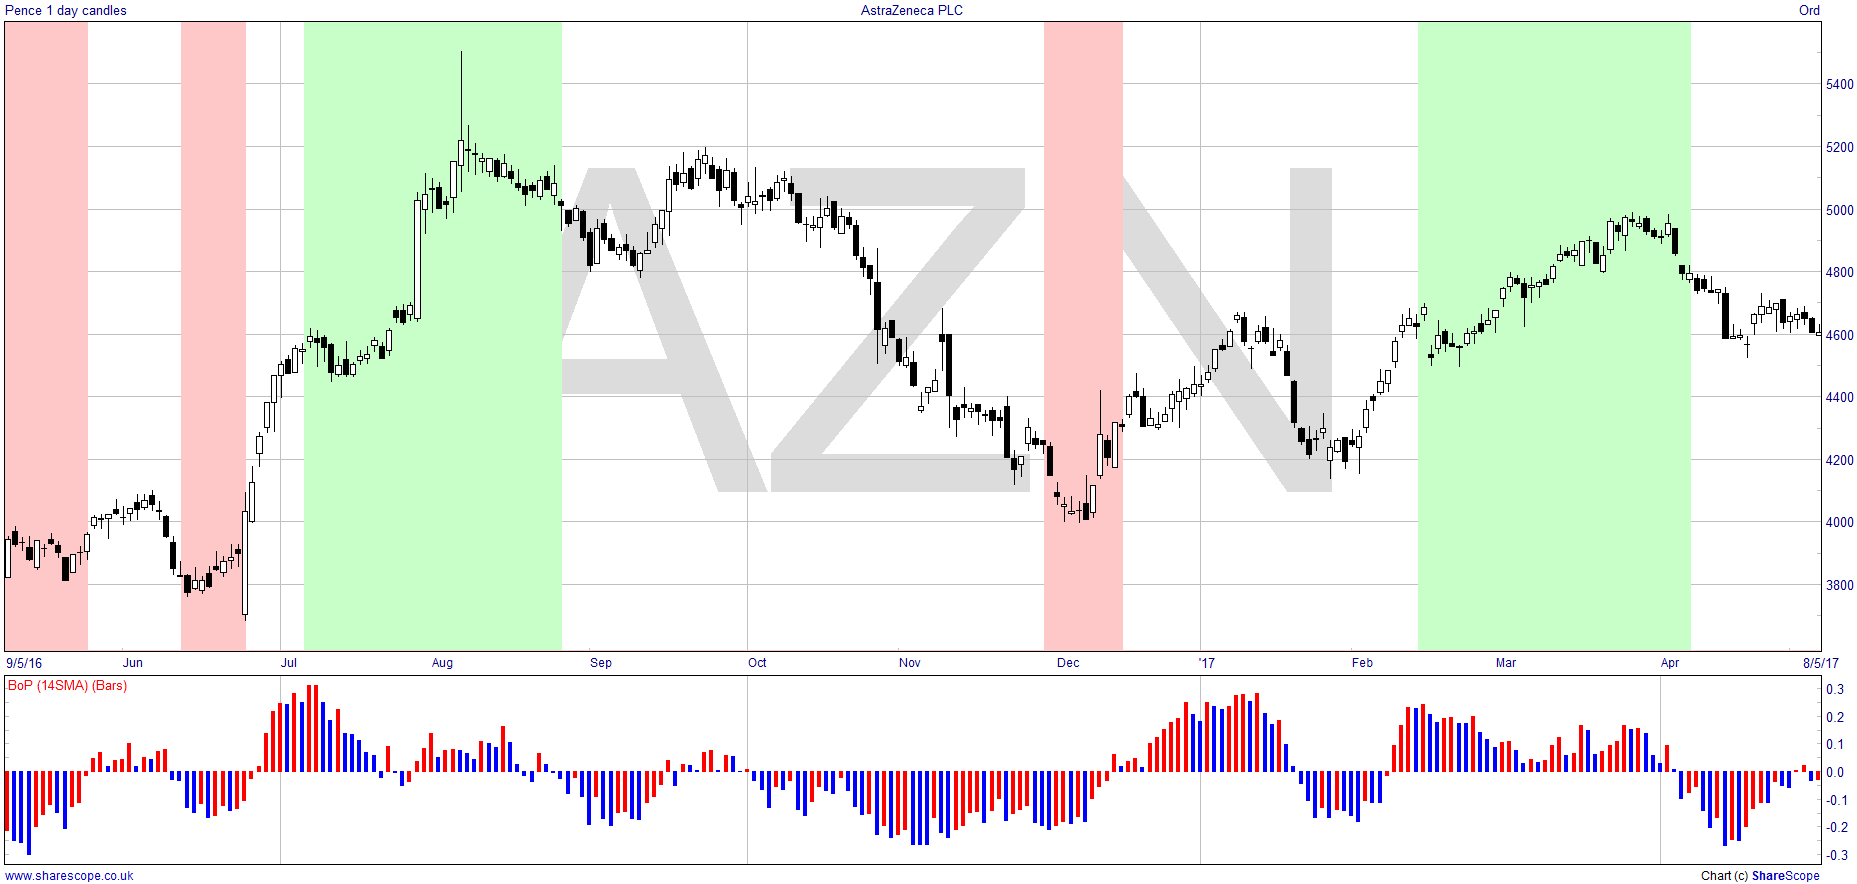
The Turtles System 2 script is an example of an indicator script designed to be applied to the main chart. This is because it colours the background of the chart.
The Balance of Power script, which draws a histogram, is a good example of a script that is designed to be drawn in its own window below the chart.
To add an indicator script to the main chart
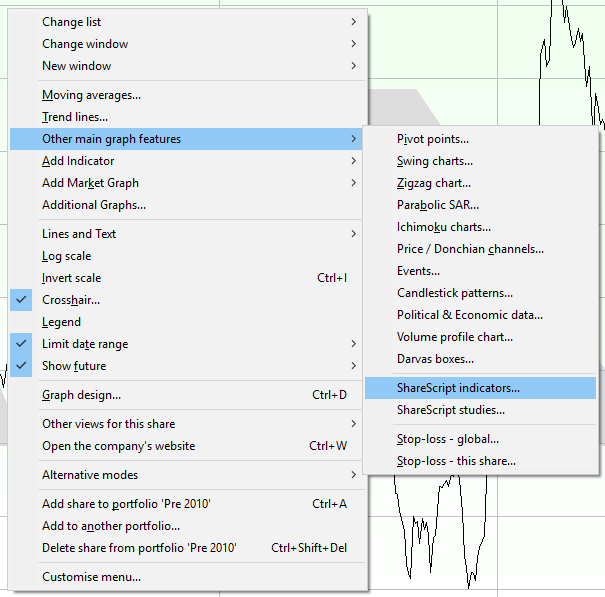
- Right click on the chart, move the mouse over Other main graph features and then select ShareScript indicators... from the sub-menu.
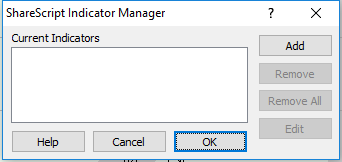
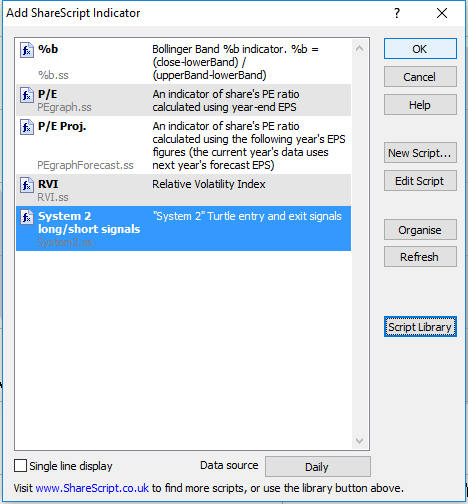
- The ShareScript Indicator Manager will open. Click on Add.
- If the script you wish to add is in the list of scripts on your computer select it and click on OK.
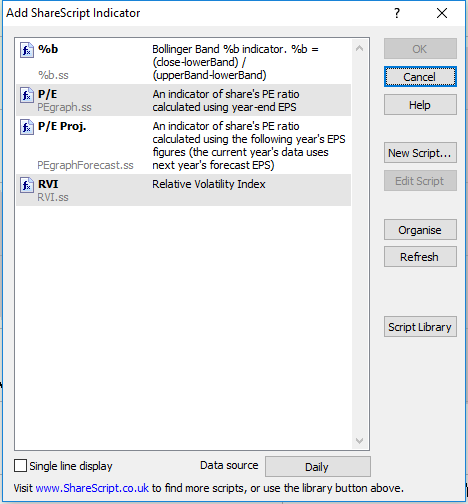
- Otherwise click on the Script Library button on the right-hand side of the dialog window.
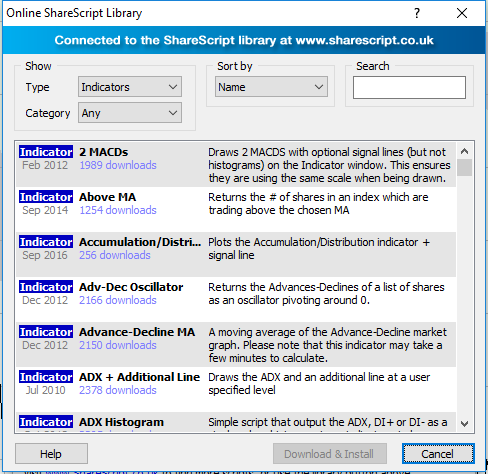
- The script library dialog window has a Search box you can use to quickly select the script you are looking for.
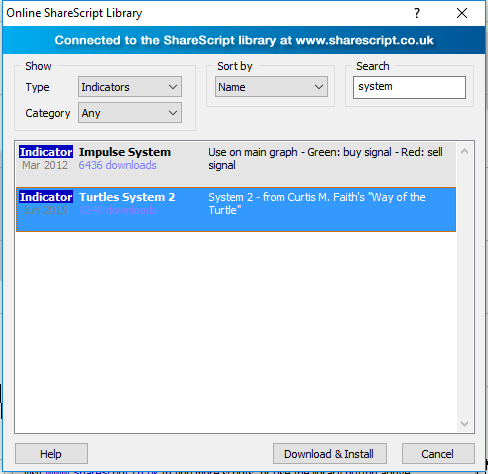
- Select the script from the list and click on Download & Install.
- Then click on OK.
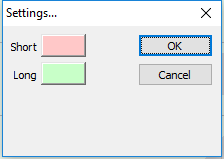
- This will cause the script to run. If the script has a dialog box included as part of its code then this will open and you will be able to make whatever choices required. Once you have made your choices click on OK.
- The indicator will then be added to the main chart window.
To remove the script from the chart
- Right click on the chart, move the mouse over Other main graph features and select ShareScript Indicators...
- Select the script and click on the Remove button.
To add an indicator script in a separate window
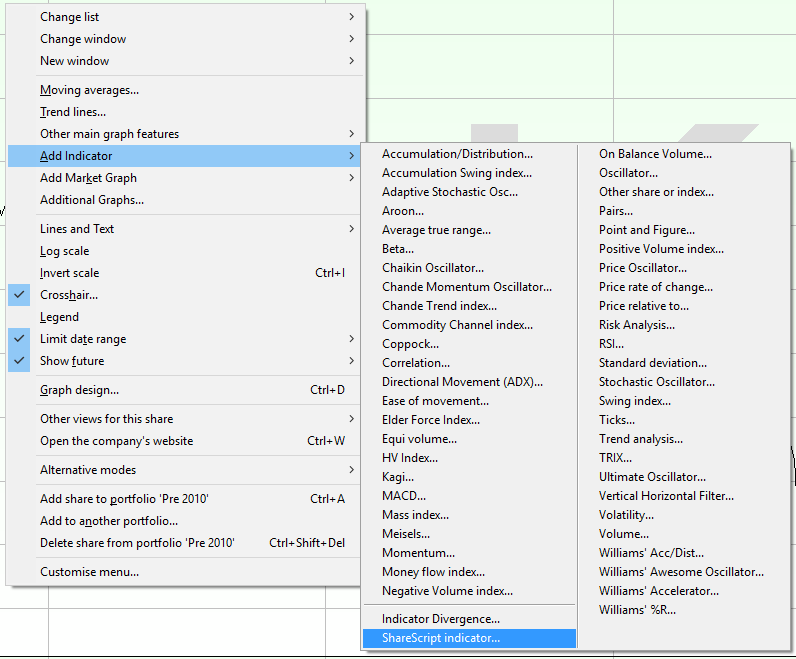
- Right click on the chart move the mouse over Add Indicator and then select Add ShareScript Indicator...
- If the script you wish to add is in the list of scripts on your computer select it and click on OK. Otherwise use the Script library to download and install the indicator script that you wish to apply to the chart.
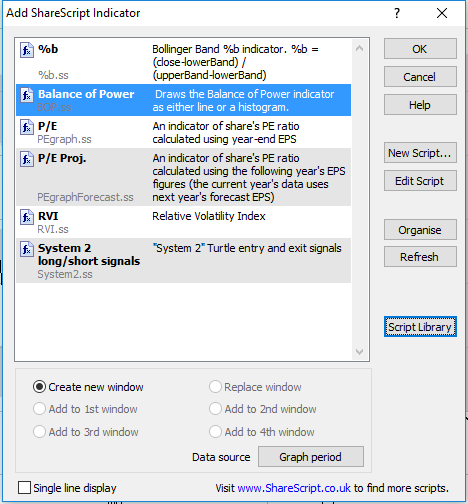
- When you add an indicator script in this manner you are given the option to select the data source at the bottom of the dialog window.
There are four options you can select: - Daily
- Weekly
- Monthly
- Graph Period - this uses whatever bar size is set on the main chart and will change dynamically if the main chart is changed.
- Once you are happy with your data source selection you can then click on OK.
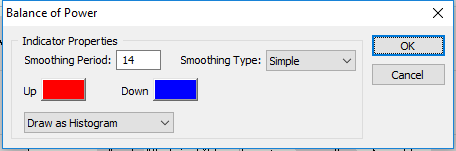
- This will cause the script to run. If the script has a dialog box included as part of its code then this will open and you will be able to make whatever choices meet your requirements. With your choices made click on OK.

- The indicator will then be added in a separate window below the chart.
To delete the indicator you can either click on the little cross at the top right corner of the indicator box or right click on the indicator title at the top left of the indicator box and select Delete from the menu.
ShareScript Studies
ShareScript Studies are added to the main chart and are similar to ShareScript Indicators. However, studies have a greater amount of flexibility and enable us to draw complex shapes and text on the chart in way that is not possible with an indicator script.
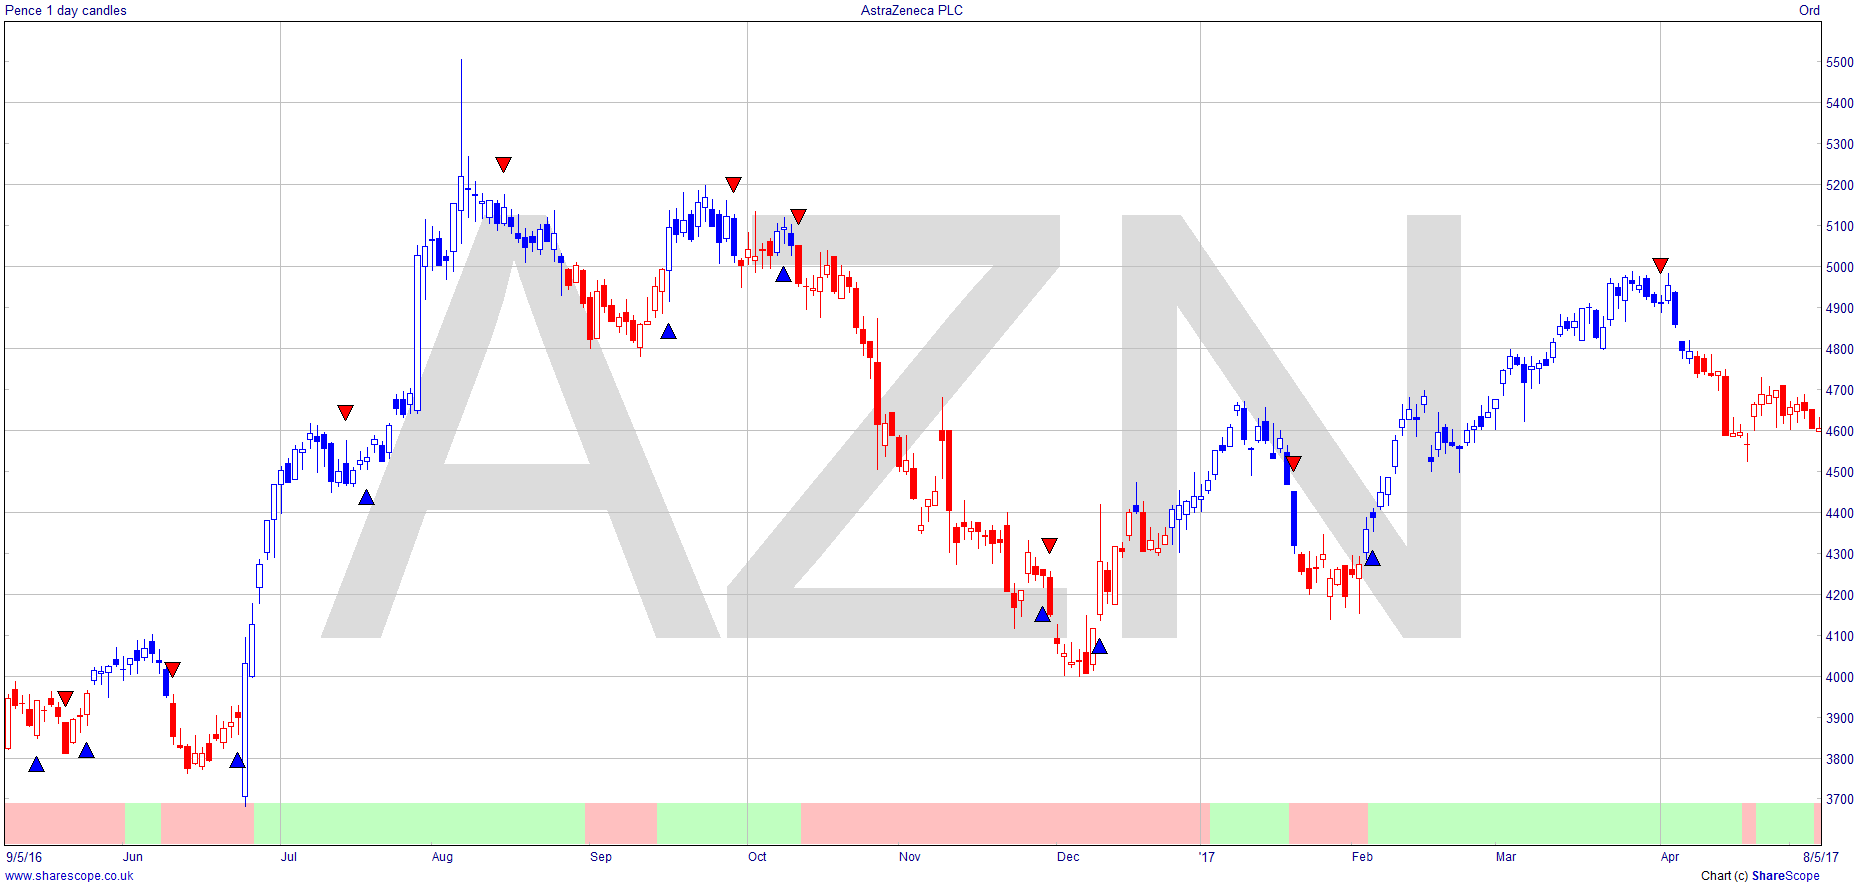
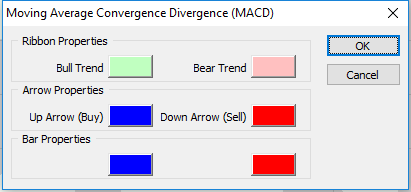
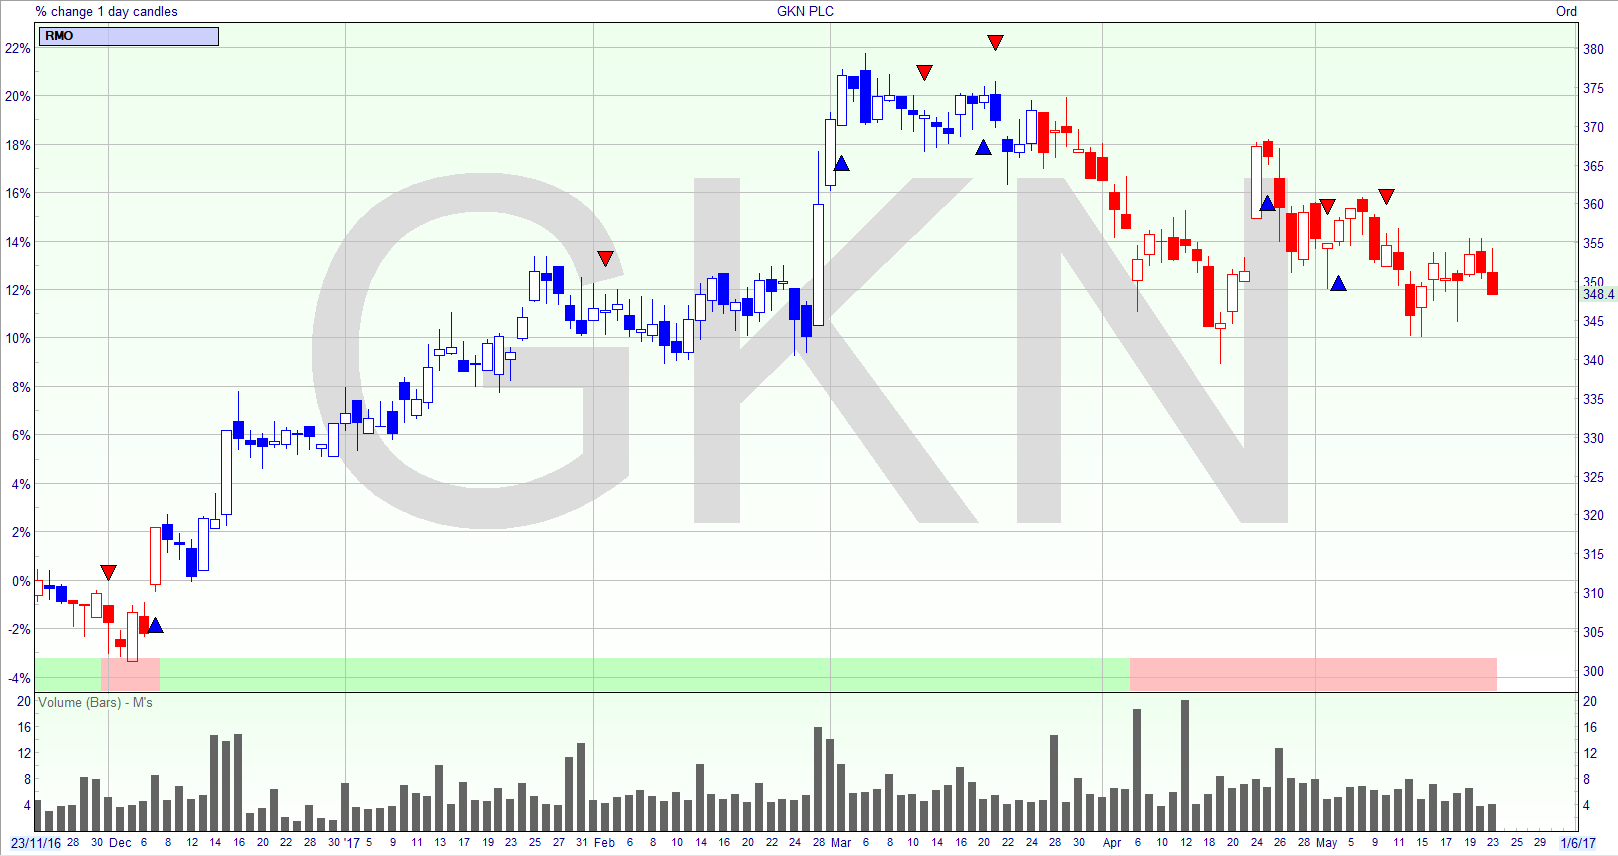
The Rahul Mohindra Oscillator (RMO) is being drawn in this example. You can see a ribbon is being drawn across the bottom of the chart, the candlestick colours are being determined by the study and it is also drawing arrows on the chart.
To add a ShareScript study:
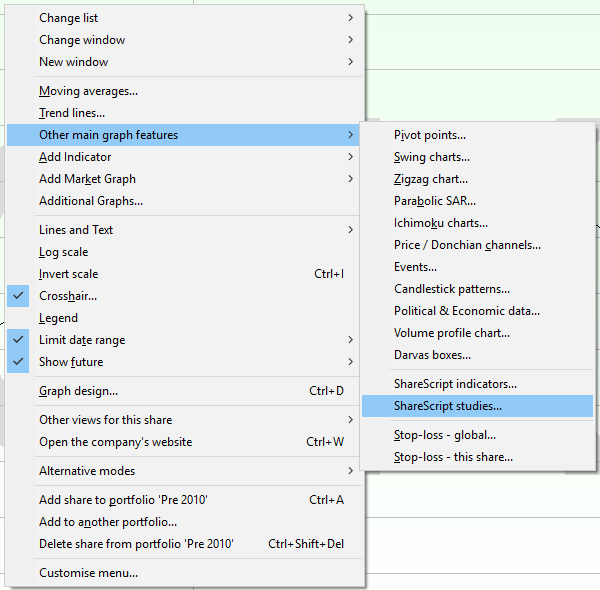
- Right click on the chart, move the mouse over Other main graph features and then select ShareScript Studies... from the sub-menu.
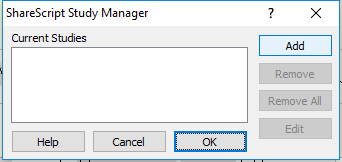
- The ShareScript Study Manger will open. Click on Add.
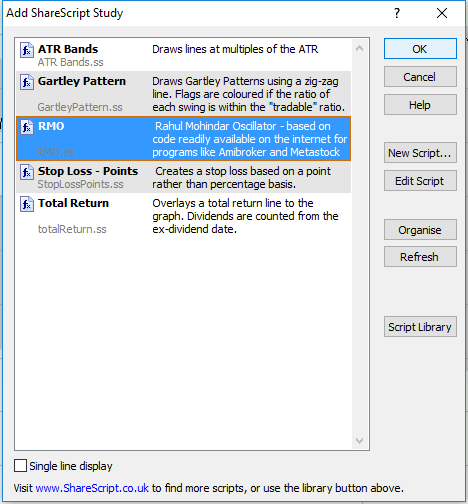
- If the script you wish to add is in the list of scripts on your computer select it and click on OK. Otherwise use the Script library to download and install the indicator script that you wish to apply to the chart.
- This will cause the script to run. If the script has a dialog box included as part of its code then this will open and you will be able to make whatever choices required. Once complete click on OK.
- The ShareScript Study will then be added to the main chart window.
To delete the ShareScript Study right click on the blue Study manager bar at the top left of the chart and select Delete Study. Alternatively you can right click on the chart, select Other main graph features then ShareScript Studies.... This will open the Study manager you can then select the script and click on Remove.
To learn more about using ShareScripts in other parts of the program click here.

