Tutorial: Headline Results
In ShareScope, the Headline Results include Turnover (Sales), Pre-tax Profit, Normalised Earnings Per Share and Dividend Per Share.
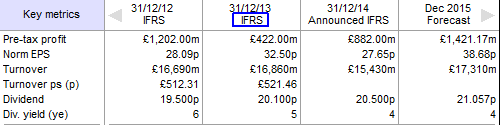
From 2007, Headline Results are reported to IFRS standard, however not all companies have historical results in this format. The Key Metrics table on the Details view will show if the results are reported to the IFRS standard.
Many companies issue results twice a year, i.e. Interim and Year End results. Other companies however, issue results quarterly and at other times during the year.
This example shows the Quarterly, Interim and Year End results. Results are usually presented two or three months after the period-end. Note that in the example above the Year End results for the period to 31/12/14 are classed as Announced. Once Hemscott Group have received the company's Year End Accounts they re-analyse them so as to allow a direct comparison between different companies (e.g. non-recurring or extraordinary items are removed or adjusted for). During this time the results are classed as "Announced" and only the Headline Results are displayed, no Advanced Results (see below) are calculated. Only Year End results are normalized or adjusted for share consolidations or splits.
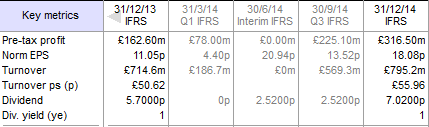
On the Details screen, where the example above is taken from, the Interim, Q3 and Year End results are all cumulative. ShareScope is able to display separate results entries for each quarter, i.e. Quarter 1, Quarter 2, Quarter 3, Quarter 4 in addition to Interim and Year End (see below for more information).
Headline Results in List Tables
To add Headline Result columns to a List Table, right click on a column heading and select Add Result Column. The following dialog is displayed:
Notice there are four tabs - Headline Results, Income & cash flow, Balance Sheet and Ratios.
This tutorial only covers the Headline results; should you have any queries about the results in the other tabs you can find information about what they are and how they are calculated from the Help button or by selecting an item and pressing F1.
By selecting different options under the Result, Period, Year and Calculated headings you can create a table with a full history of Headline results, including Quarterly results, for all the companies in the list.
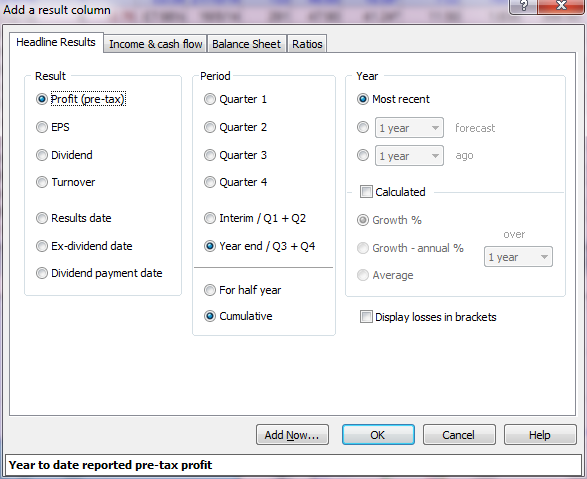
Under Year you can choose the Most recent result, 1 to 3 years forecast or 1 to 10 years ago.
If you tick Calculated then you can choose either Growth %, Growth - annual % and Average. You can also select the number of years over which this is calculated.
So if you select EPS, Year end/Q3+Q4, 1 year forecast and Growth % 1 year you will add an EPS 1 year forecast growth column to your list.
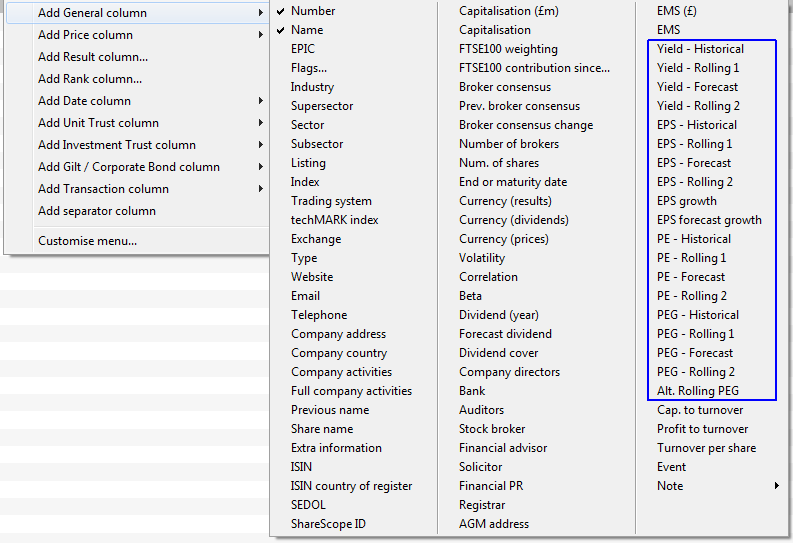
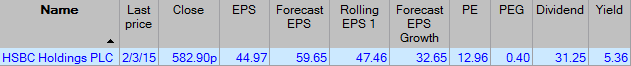
From these Headline results, and using the latest Close price, other ratios such as Yield, P/E and PEG can be calculated. Variations on these ratios include Historical (based on the last adjusted result), Projected (based on the first year forecast result), Rolling 1 and Rolling 2. The Rolling ratios "roll" from between one year and the next, depending on how far through the company's financial year it is. Rolling 1 "rolls" from the Historical to the first year Forecast result; Rolling 2 "rolls" from the first year Forecast to the second year Forecast. To add these ratios as columns, right click on a column heading and go to Add General Column:
| The Historical versions of these ratios are calculated as follows: | Using this example, the calculations are: | |
|---|---|---|
| Yield = | Dividend / Latest Close Price | 31.25 / 582.90 (if using price in pence, as in this case, multiply by 100) = 5.36 |
| P/E = | Latest Close Price / EPS | 582.90 / 44.97 (if using price in pence, do not multiply by 100) = 12.96 |
| PEG = | P/E / EPS Forecast Growth | 12.96 (the result from above) / 32.65 = 0.40 |
The Rolling values, as mentioned previously, "roll" between the Year End results. In the example below, Rolling 1 roll's between the EPS (Historical) value and the 1 year forecast value.
In the example below the difference between the Historical and 1 year forecast EPS values is 14.68
As of 02/03/15, we are slightly over two months into the financial year for this company, or just over a sixth of the way through. If you add a sixth of the difference (14.68/6) onto the Historical EPS your result will be slightly less than the Rolling EPS 1 value (ShareScope calculates to the day which explains the slightly higher Rolling EPS 1 value).
Remember, if you have any trouble finding or using any of these features, please don't hesitate to contact our Customer Support team. They will be delighted to help.

