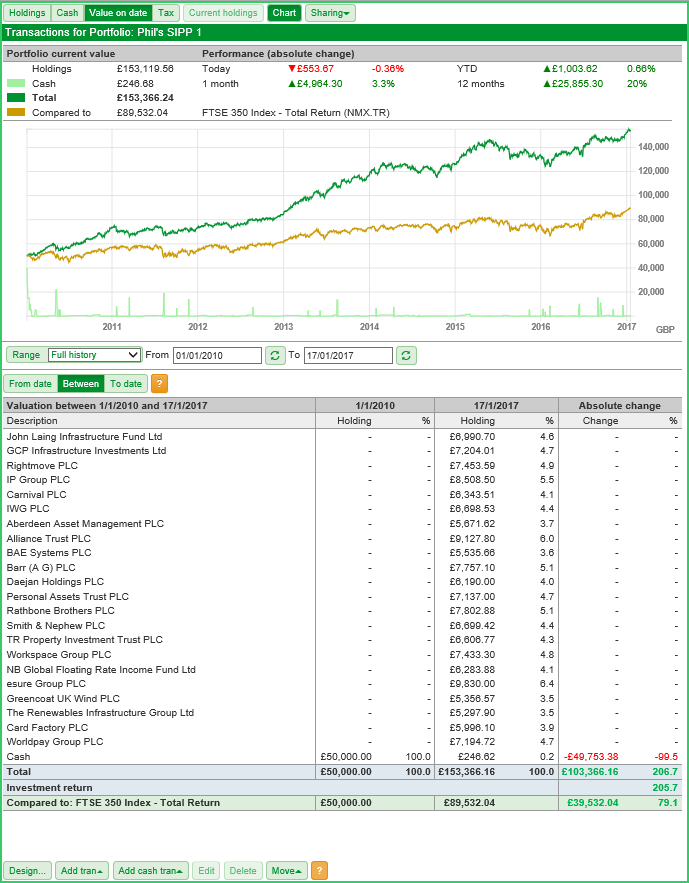
The Value on date view
The Value on date tab is designed to show your portfolio performance over a time range.
To access the The Value on date view:
- To begin, select the appropriate portfolio using the blue Port button on the blue side of the screen.
- Once you have selected a portfolio, you will see that the dark green Trans button is selectable - clicking on this will open the Transactions view. Note that the Trans button will also turn white, indicating that this is the current view.
- From here you can click the pale green Value on date button.
Below the chart is range selector, allowing you to select one of the following options:
- 1 day ago
- 1 week ago
- 1 month ago
- 1 year ago
- Year to date
- Previous year
- Tax year to date
- Previous tax year
- Full History
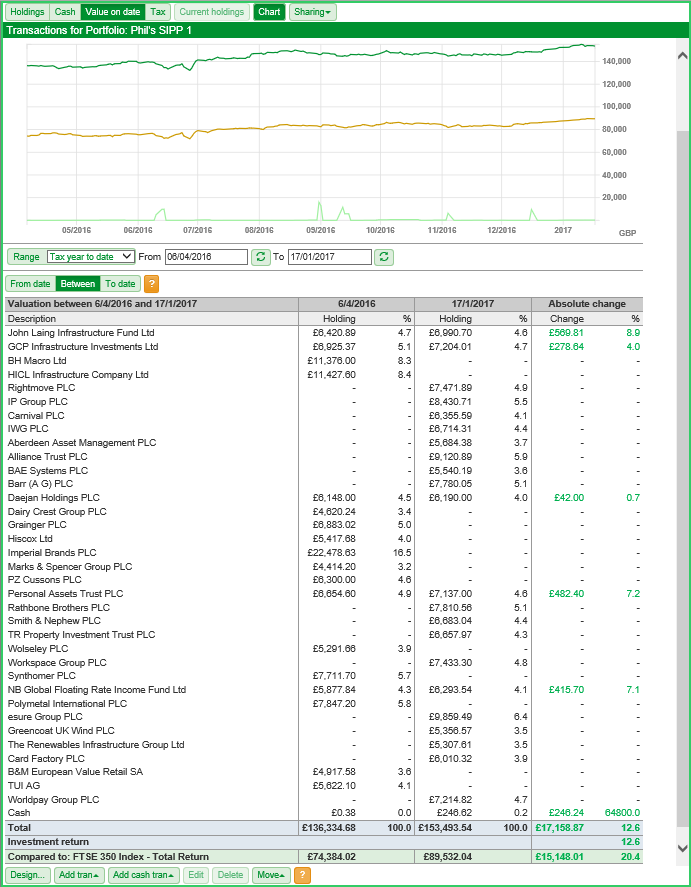
The chart and the Valuation table (on the Value on date view) are both linked to the range selection and, therefore, linked to one another.
If, for example, you selected the range Tax year to date, both the chart and the Valuation table change to show the portfolio valuation performance over that period.
In addition, you can also see how the portfolio has performed relative to a specified benchmark over the same period. In this case, the portfolio has underperformed compared to the FTSE 350 Total Return index.
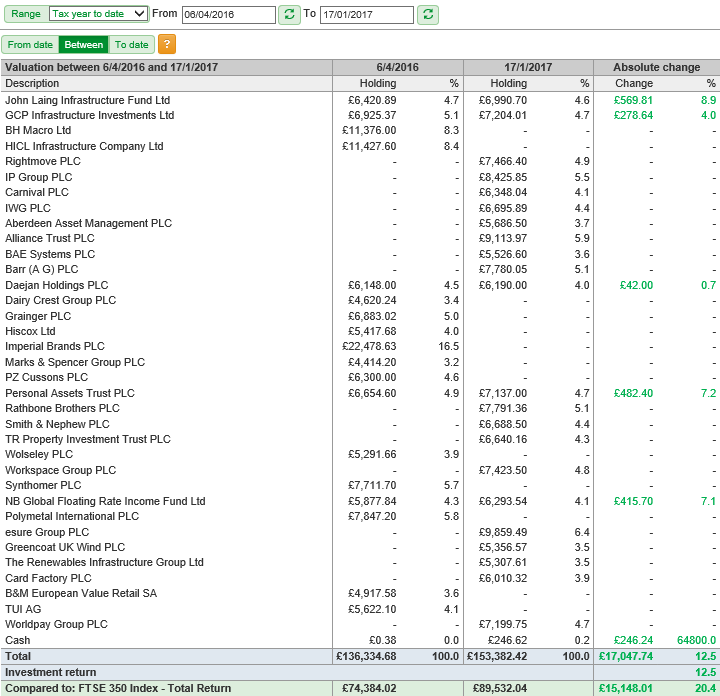
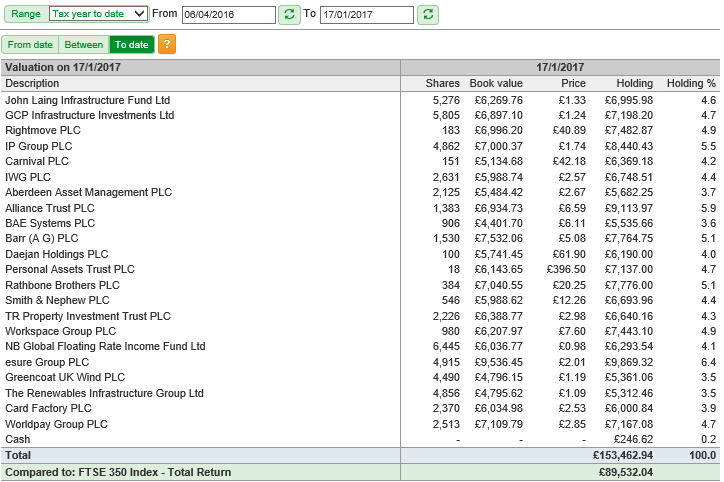
The Valuation table can be set to show the data in one of three ways:
- From date
- Between
- To date
When the Between option is selected the data is presented in three columns:
- The first column shows the shares you held and your cash position on the From date. It shows both the value of the holding and the size of the holding as a percentage of your total portfolio.
- The second column shows the shares you held/hold and your cash position on the To date. It also shows both the value of the holding and the size of the holding as a percentage of your total portfolio.
- The third column shows the change in performance in any shares you have held for the duration of the period selected, along with any changes in your cash position.
At the bottom of the table are three further rows that show the Total value of your investments on each date and how that has changed over the period; the Investment return; and how your portfolio has performed relative to a specified benchmark.
When you select From date or To date, the table will change to show only details of your holdings on the from date or to date depending on which option you select.
The table shows details for yours holding as it was on that date. The information shown includes the number of shares, the Book value (or cost), the price per share on the date, the valuation of the holding on the date and the size of the holding as a percentage of the total portfolio.
As noted earlier in this tutoprial, the chart and Valuation table are linked. This means that if you were zoom in on the chart, for example, then the valuation table will adjust accordingly.
Alternatively if you choose a different date or dates by using one or both of the date selectors then both the chart and the valuation table will be adjusted..
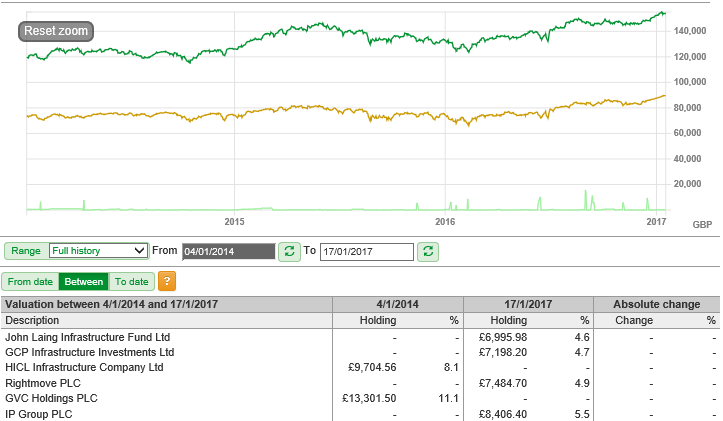
In the above example, the range has been set to show Full history. The chart has then been zoomed to show the data from 4 January 2014. As a result, the From date (below the chart) is now shaded in dark grey to reflect the temporarily zoomed state. You can also see the Valuation table is showing the valuation from 4 January 2014 to 17 January 2017.
The Reset zoom button can be used to return to showing the Full history of the portfolio.
Related tutorials

