How I choose my next share using filters and charts
After many years of investment I still feel a sense of anticipation when I examine lists of shares looking for new opportunities. It's like opening a map to find new places to visit, or a menu at a restaurant that serves everything.
There are other ways to generate investment ideas, but in my experience they're not as dependable. Gaining inspiration from our experiences as customers, suppliers, or employees of companies works, but it exposes us to a very limited range of companies. Insights from investors, analysts, pundits, and journalists can be hazardous. These sources are often tainted by opinion recycled many times before it's reached us. While it may feel like we're learning something new, it's probably worse than useless if it's widely known.
Interpreting the data - the statistics that describe a firm's financial condition and performance - has one big advantage. It's untainted by received opinion. You can make your own mind up about the data.
Share this article with your friends and colleagues:
A meal from the restaurant that serves everything
I start with the broadest list of shares available on SharePad, the 2,023 shares listed on the London Stock Exchange. It includes shares traded on two markets: the Main Market and the Alternative Investment Market (AIM). AIM is derided because it's lightly regulated and has been home to a number of frauds. This is true, but some of the UK's most stable and most energetic companies are listed on AIM too, and it would be a mistake to exclude them from the list of opportunities.
In this article I will explain how I choose one meal from the menu at a restaurant that serves everything - or how I discover the next share for evaluation, using filters and charts. It could be the next share I add to my portfolio
Filtering is the first stage of the process. Today, my filter gets me down to 203 shares.
From 2,023 shares to 203
Filtering should be efficient. We want to quickly reduce the number of shares on our screen to a manageable number. The more criteria we use, the greater the risk we will fiddle around with them all day generating new permutations without actually investigating a share. We may also exclude perfectly acceptable investments because they fail a test that we aren't that wedded to.
I use four factors, two of them measure profitability, one measures financial strength, and one measures value. These factors are the statistical embodiment of my strategy, which is to buy good companies at reasonable valuations and hold them for the long-term, preferably beyond the grave. I explained why I think this is a good idea in my previous article. Here I'll introduce the specific factors.
This is the filter in SharePad, and some of the companies that match it:
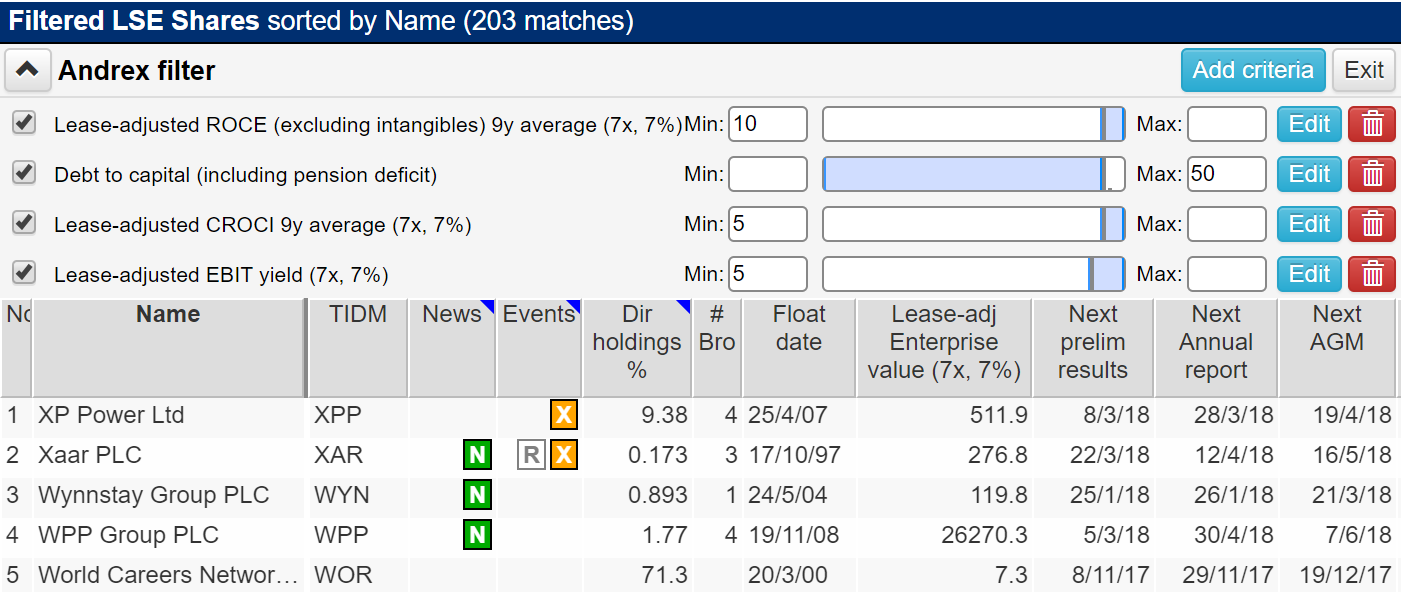
Don't be put off by the jargon. Since debt and off-balance sheet financial obligations like operating leases can distort more familiar measures of profitability and value, like return on equity and the price earnings ratio, I use measures that SharePad has adjusted. You could build a filter using more familiar ratios and get serviceable results.
As you can see from a selection of just five of the 203 shares, they have nothing much in common. One is a supergiant, another is a titch, one is high-tech, another sells seed and animal feed. That's the way I like it. The only things binding these companies are the factors I deem most relevant to long-term buy and hold investing.
Lease-adjusted ROCE 9y average (Min: 10%)
Return on capital is my principal measure of profitability. Since companies are in business to make a profit, high levels of profitability over long periods of time suggest the firm has been successful.
An average can't tell us everything, a company might have been extraordinarily profitable for a few years, and less so in others, but at least we can say the good times outweighed the bad.
Why 10%? It seems like a reasonable return considering the risks of operating a business.
Lease-adjusted CROCI 9y average (Min: 5%)
While the objective of accounting is sensible - it aims to present a true and fair reflection of a company's performance - accountants can sometimes paint a prettier picture than a company actually deserves.
Cash Return on Capital Invested (CROCI) is a second measure of profitability that reassures us the firm has actually made money. As the name implies, it's not based on the accounting profit figure but the cash flows into and out of the company's bank accounts.
I can forgive companies whose cash flows fail to match their accounting profits, there are often legitimate reasons for the difference and ultimately the cash will flow, so I stipulate a minimum 5% CROCI.
Debt to capital (Max: 50%)
The debt to capital ratio compares the amount of money a firm has borrowed in its most recent financial year to the value of the assets required to operate the business. A maximum of 50% is an arbitrary figure. In practice, the lower it is, the better.
Lease-adjusted EBIT yield (Min: 5%)
The EBIT yield values the business by comparing its annual profit before interest and tax to its price, which is its market capitalisation plus debt and other financial obligations, a measure known as enterprise value.
Crudely, the higher the return (i.e. profit) in comparison to the price of the investment, the better value it is. It's the reciprocal of the EV to EBIT ratio, which is similar to the price earnings ratio. Stipulating a 5% minimum return is equivalent to paying no more than 20 times annual profit, before interest and tax, for the shares.
More often than not I disable the EBIT yield filter, which produces even more matches (currently 292), because I want to get to know good companies even if the ratios tell us they're too expensive to buy now.
From 203 shares to one
Two hundred and three shares is too many. To whittle down the number we might add new factors to the filter, or tighten the existing ones - requiring more profitability, less debt, and lower valuations. Those are legitimate ways to prune the list, but once I have a list of shares that broadly satisfy my requirements, I switch to SharePad's financial charting.
One chart to rule them all
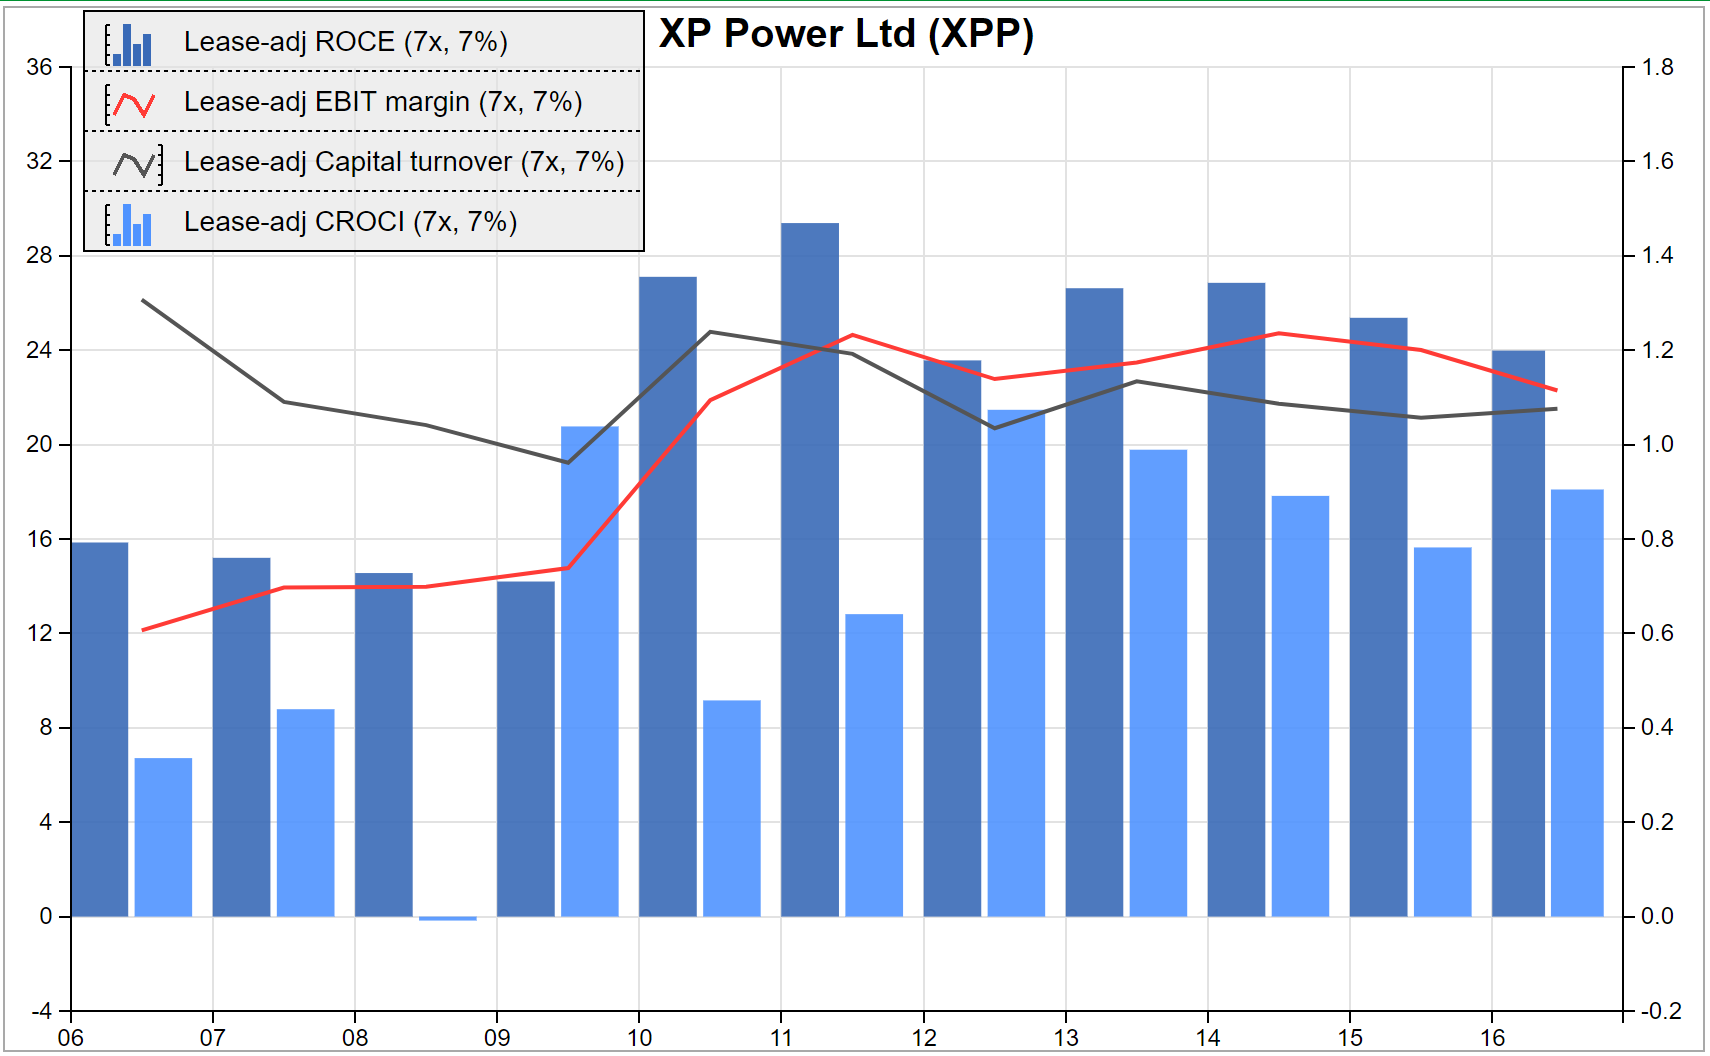
Averages tell us something about how well a company has performed over time, but we need to know more: whether profitability has been stable, volatile, improving, or getting worse. To find that out I plot a bar chart of ROCE and CROCI, the measures used in the filter.
I may also check secondary charts that tell me whether turnover and profit have grown, and whether debt is under control.
Here's XP's profitability:
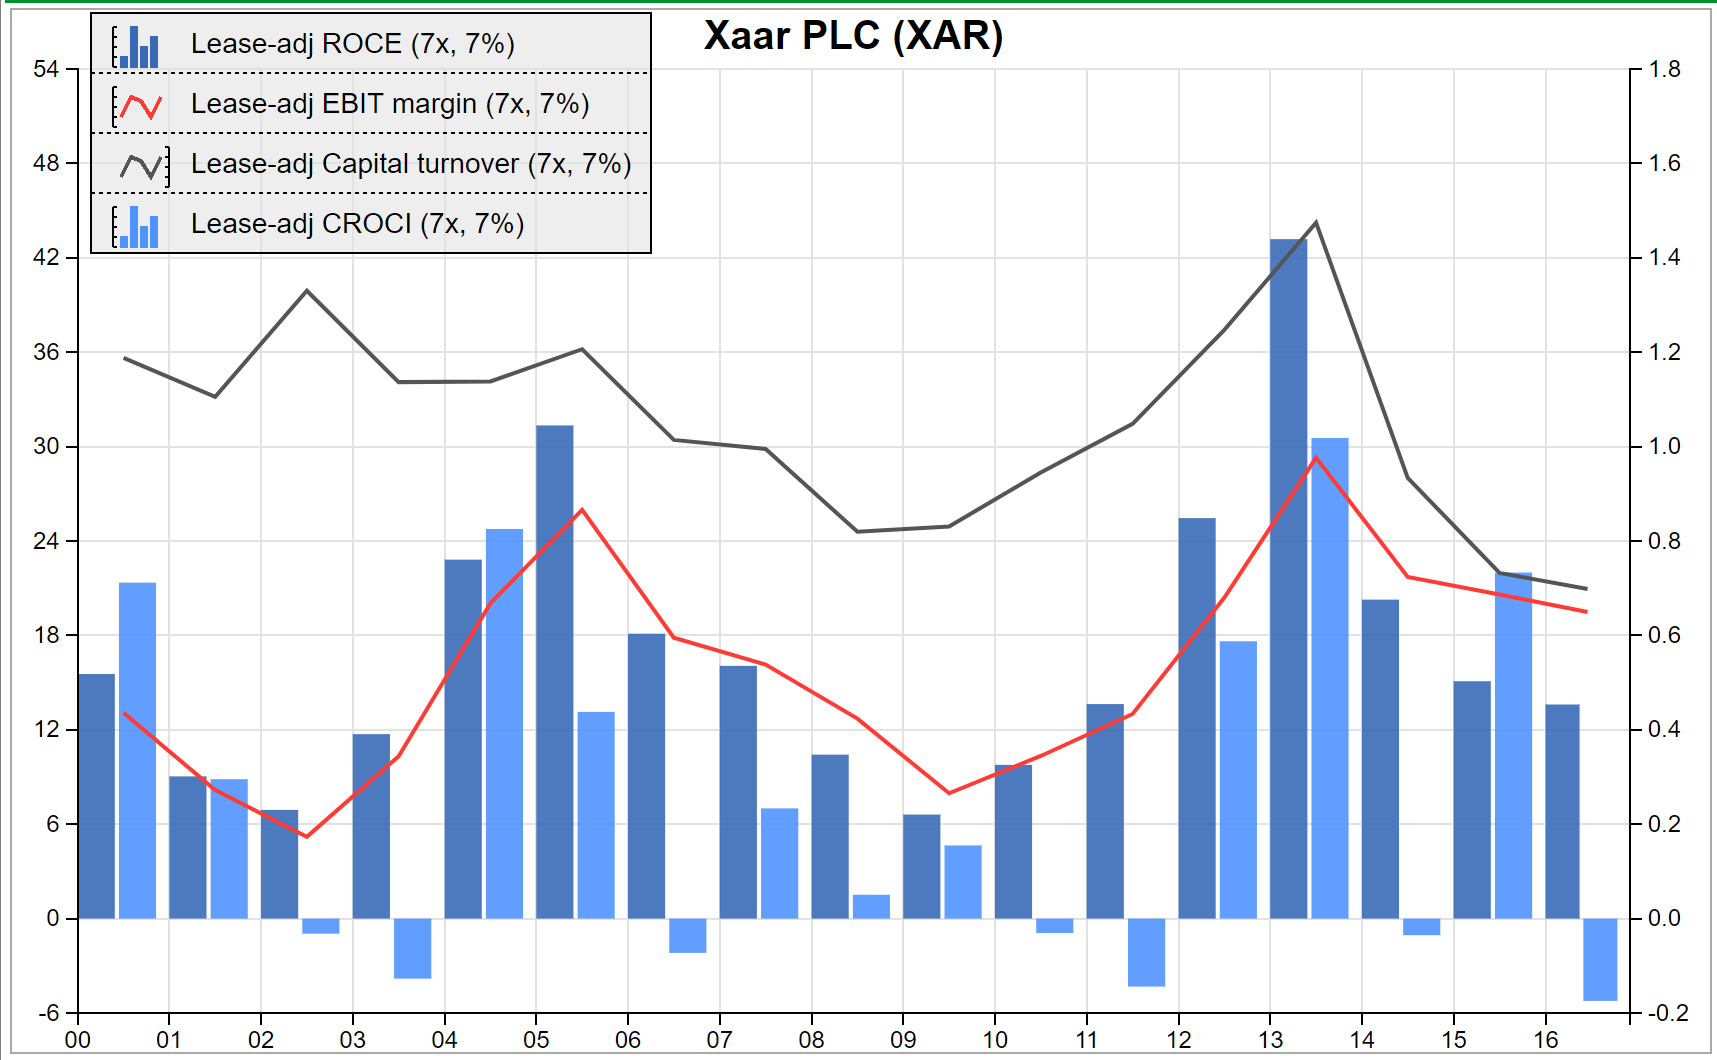
And here's Xaar's:
XP designs and manufactures power supplies for industrial machinery. One look at its chart invites questions, principally what caused the rise in profitability at the turn of the decade? Even more importantly, is it sustainable? If it is, XP Power could be a very good investment.
Xaar designs and manufactures printheads for industrial digital inkjet printers. Profitability has been much more volatile, and its chart invites a different question: Why such extremes? Will the recent decline bottom out like previous declines? Is Xaar doing anything to bring more stability to the business? Will they work?
Xaar's chart is interesting, and I'd like to give it more thought, but it could be difficult to reach firm conclusions. At a glance, though, XP's chart appeals. If I were coming to it for the first time I'd know what I want to find out, and the next step would be to read the company's annual reports.
Secondary factors
I don't look at all 203 charts systematically to find the most attractive prospect. I play around until I find a company I want to investigate. It doesn't take very long, but sometimes it helps to shake the bag and see what tumbles out.
Academics have shown that smaller companies tend to perform better on the stockmarket than larger ones. They've also shown that the longer a company has been listed, the better it performs on average, a factor dubbed "seasoning". Family owned businesses tend to outperform too.
I set up columns in the list view for secondary factors like these and sort the shares to highlight the smallest, the most seasoned, or the shares with the highest concentration of director ownership.
Though these factors aren't critical, they can lead me to intriguing prospects within my predefined set of good companies at reasonable valuations.
If you have found this article of interest, please feel free to share it with your friends and colleagues:
If you have a novel strategy or comments on mine, I'd be interested to hear from you. You can contact me by email (richard@beddard.net) or on Twitter @RichardBeddard.
This article is for educational purposes only. It is not a recommendation to buy or sell shares or other investments. Do your own research before buying or selling any investment or seek professional financial advice.

