Investing in the shares of cyclical companies
Most investors don't like uncertainty. It makes them feel nervous.
These natural human tendencies go a long way to explaining why many investors are prepared to pay a premium price for the shares of companies with dependable profits and cash flows. You just have to look at the current share prices and valuations of consumer goods companies such as Reckitt Benckiser (LSE:RB), Unilever (LSE:ULVR) and Diageo (LSE:DGE) to see this.
This kind of share forms the bedrock of many top investors' strategies. Investors such as Warren Buffett, Nick Train and Terry Smith. They seek to make money by owning the shares of top quality companies for a long time and allow the high returns these companies make and the magic of compound interest to grow the value of their portfolios. Their track records suggest that this has been a very good strategy.
However, there are other ways to make money from the stock market. One option is to invest in the shares of cyclical companies. These are companies whose profits and cash flows tend to move in the same direction as the economic cycle. Their shares will rise when the economy is doing well and fall when it is shrinking or in a recession.
Other types of cyclical companies see their profits move in line with commodity prices (such as mining and oil companies). Housebuilders will see their profits heavily influenced by the trend in house prices.
The shares of cyclical companies can offer tremendous profit opportunities for the more adventurous investor who is prepared to do a bit of legwork. That said, it is very easy to misunderstand them and end up with big losses.
In this article, I am going to show you how you can weigh up the shares of cyclical companies and give you some idea of when you might consider buying and selling them.
Want to learn how to analyse shares like a professional? Download our FREE guide.
Sign-up to our mailing list to receive a PDF of our Step-by-Step Guide to Investing.
Share this article with your friends and colleagues:
Cyclical sectors
The following sectors are generally considered cyclical:
Cyclical Sectors
- Aerospace
- Airlines
- Automobiles
- Chemicals
- Construction
- Electronic & Electrical Equipment
- Forestry & Paper
- General Industrials
- Industrial Engineering
- Metals & Mining
- Media
- Oil & Gas
- Property
- Travel & Leisure
What to look at
Studying a company's financial history is an absolute must for serious investors. You need to know how it has fared during good times and bad. This is even more important when looking at cyclical companies.
In particular, I suggest you look at three key parts of a company's financial performance:
- The stability or otherwise of its trading profits (EBIT). I prefer EBIT to measures such as earnings per share (EPS) as EPS is heavily influenced by things such as the amount of debt a company has and share buybacks. I want to get an understanding about how a company's trading performance might have been influenced by an economic or price cycle. Cyclical companies will have unstable profits which rise and fall over a cycle.
- The trend in return on capital employed (ROCE). Here, I suggest you strip out the effect of intangible assets such as goodwill which arises from buying companies to see what kind of profits a company is making on its underlying tangible assets. This gives a cleaner view of a company's true profitability in my opinion which is easier to compare over a long period of time. SharePad gives you an option to exclude intangible assets when calculating a company's ROCE. A cyclical company's ROCE will be less stable over time.
- The trend in profit margins. Profit margins are arguably a better indicator of whether a company's profits are at a peak or trough than ROCE. The profit margins of cyclical companies will also tend to move up and down a lot over time.
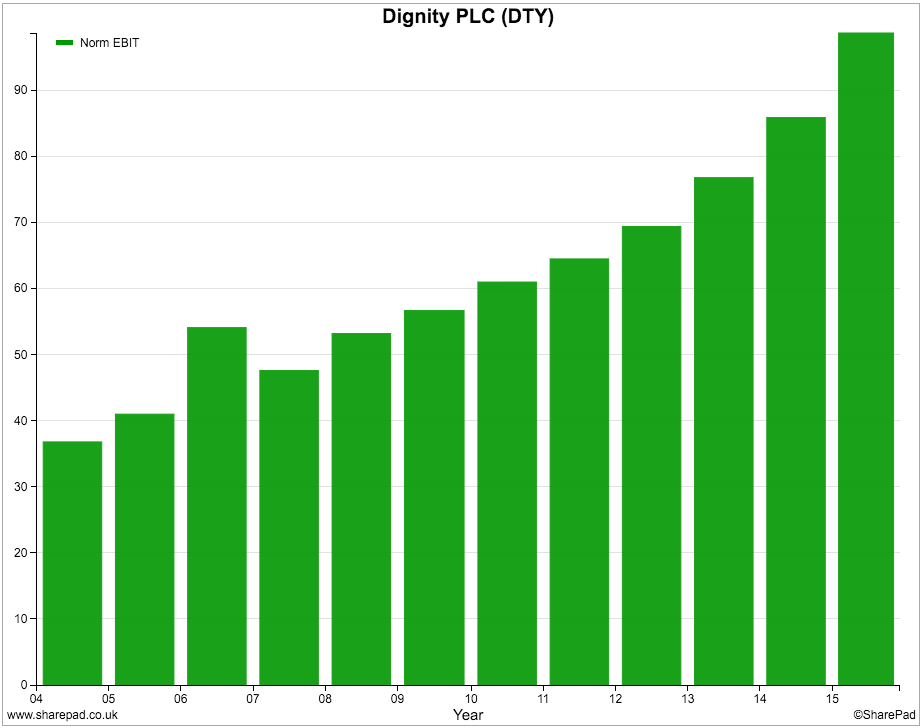
First of all, let's take a quick look at what the profits of a non-cyclical company look like. I am going to use funeral services company Dignity (LSE:DTY) as an example here. Sadly no-one lives forever which makes the business of funerals one of the most dependable out there regardless of what's going on in the wider economy.
As you can see, its profits have been steadily rising over the last decade. During the last recession of 2008-09 there was no decline in its profitability because people kept their hands in their pockets. Unfortunately, funerals can't be put off for very long and have to be paid for.
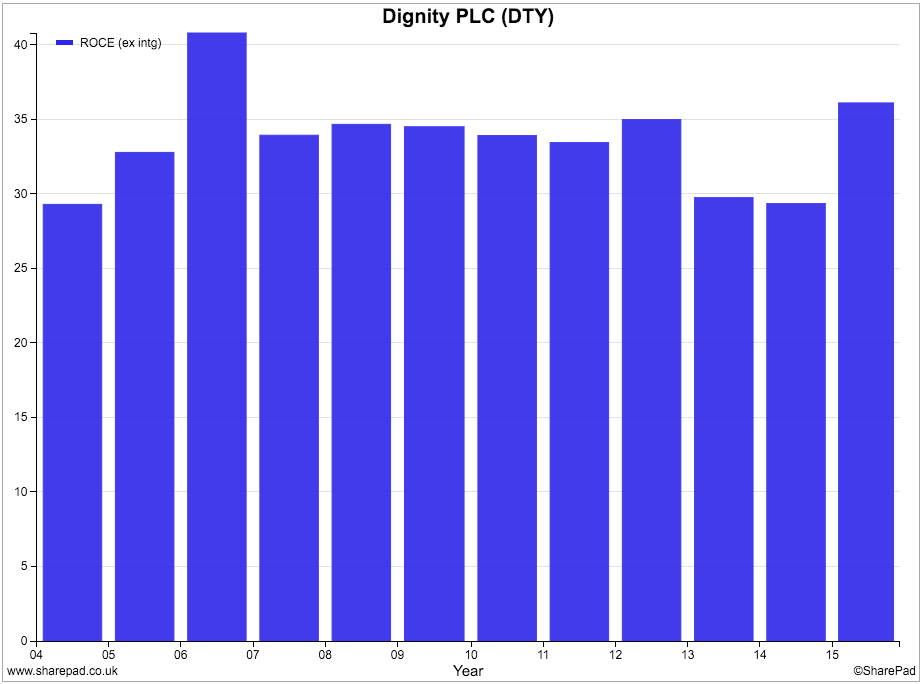
You will also see that Dignity's return on capital employed (ROCE) has been very stable.
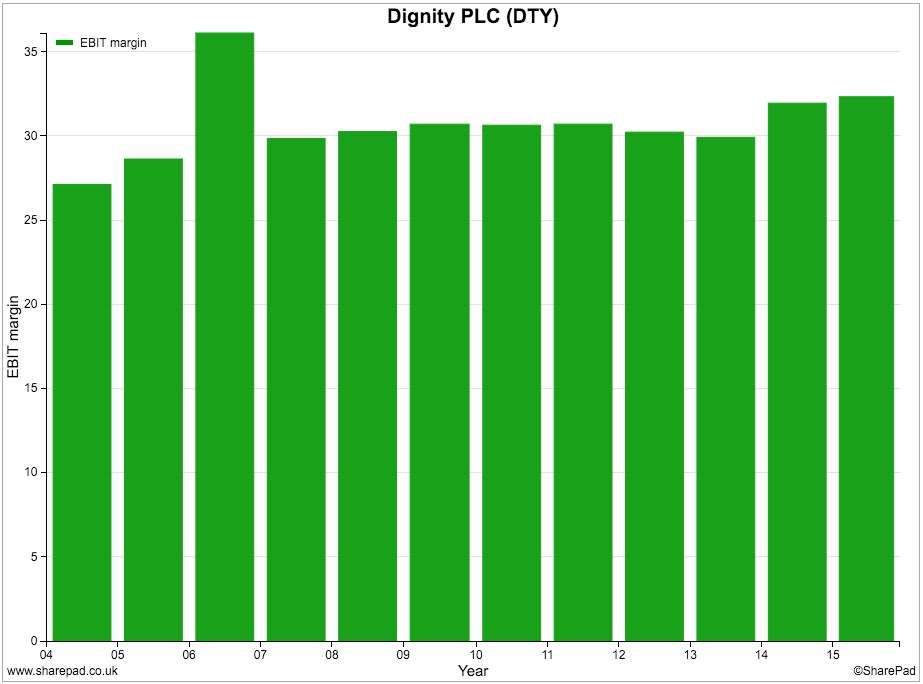
Its profit margins also stayed high and stable.
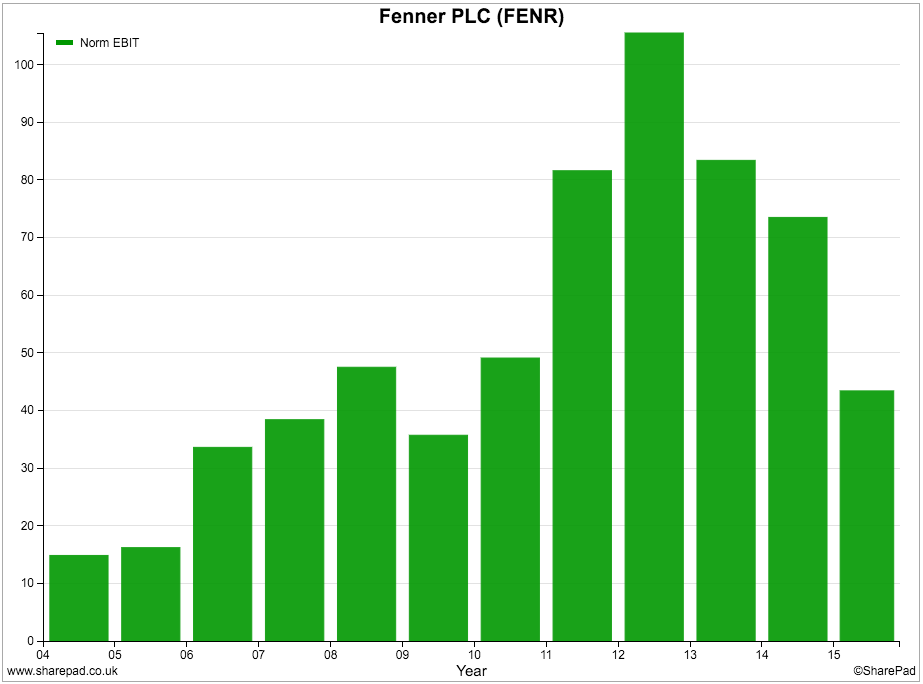
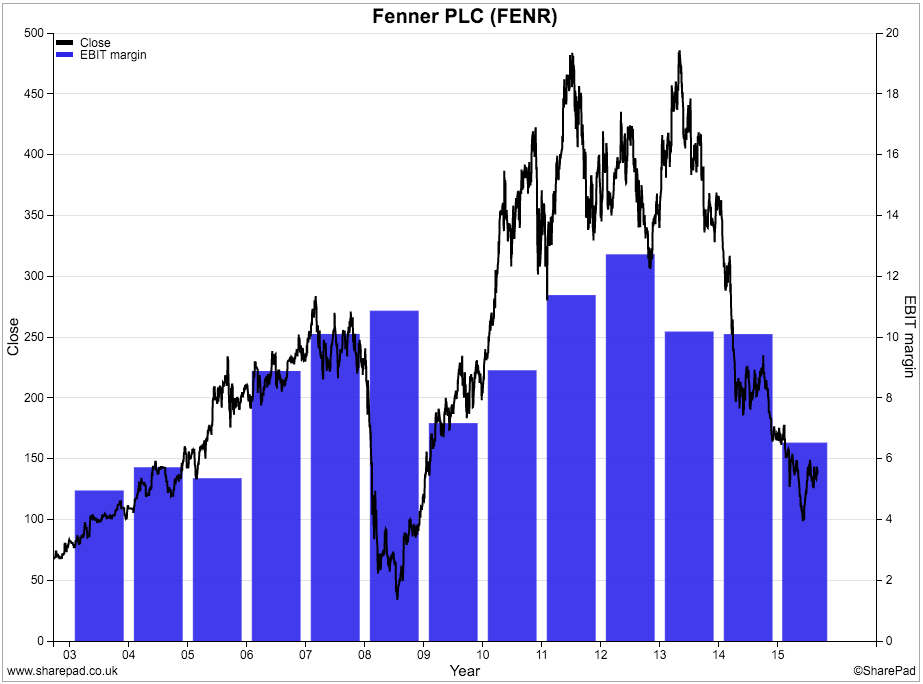
Now let's take a look at what a cyclical company's financial performance tends to look like. Here, I've used the example of industrial engineering company Fenner (LSE:FENR) which, amongst other things, makes conveyor belts for mining companies and high-integrity seals for oil and gas companies.
Demand for both these products - and therefore Fenner's profits - are very sensitive to commodity prices. When commodity prices and thus mining and oil company profits are rising they buy more from Fenner. When prices are falling they tend to buy less. This has made Fenner's profits vary a lot over an economic cycle.
You can see in the chart below that Fenner's profits fell during the 2008-09 recession and have been falling as commodity prices have fallen during the last two to three years.
If you look at its ROCE, you can see that it has not been very stable.
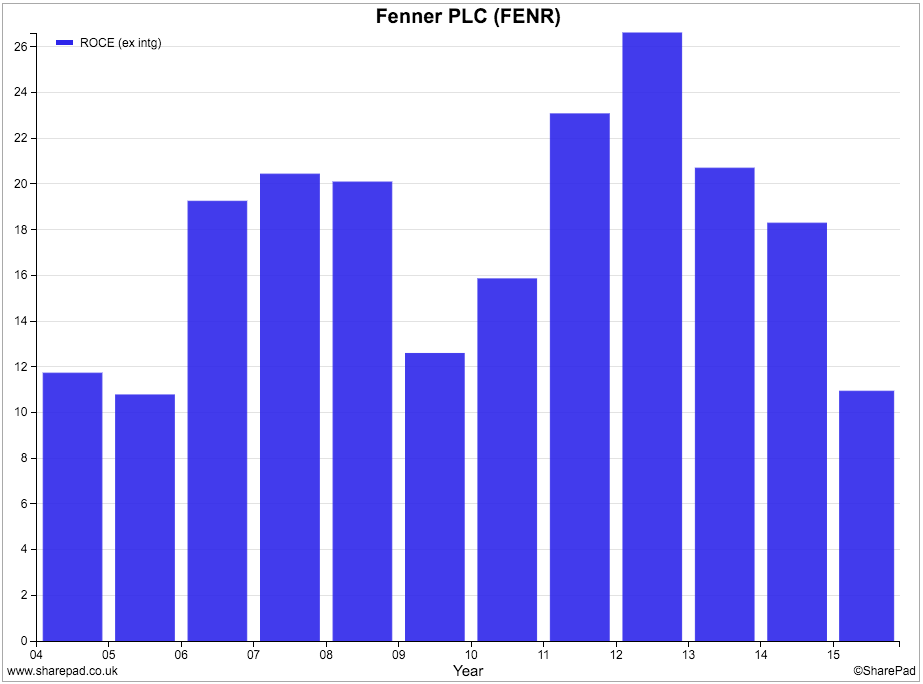
The same is true when looking at its profit margins.
Cyclical companies tend to have unstable profit margins because they are often associated with industries which have a lot of fixed costs such as factories, plant and machinery, and a large part of the workforce. This means that they need a high level of sales to just reach profit breakeven. Once breakeven is reached, additional sales add a bigger amount of additional profit - a higher profit margin - as all the fixed costs have been covered.
The process also works in reverse. This sensitivity of profits to changes in sales is known as operational gearing.
In the chart below, I've plotted the relationship between Fenner's EBIT margin and its share price. Whilst not a perfect match up, there is a reasonably strong relationship between them. However, you will see that as well as having volatile profit margins, the share price is also very volatile.
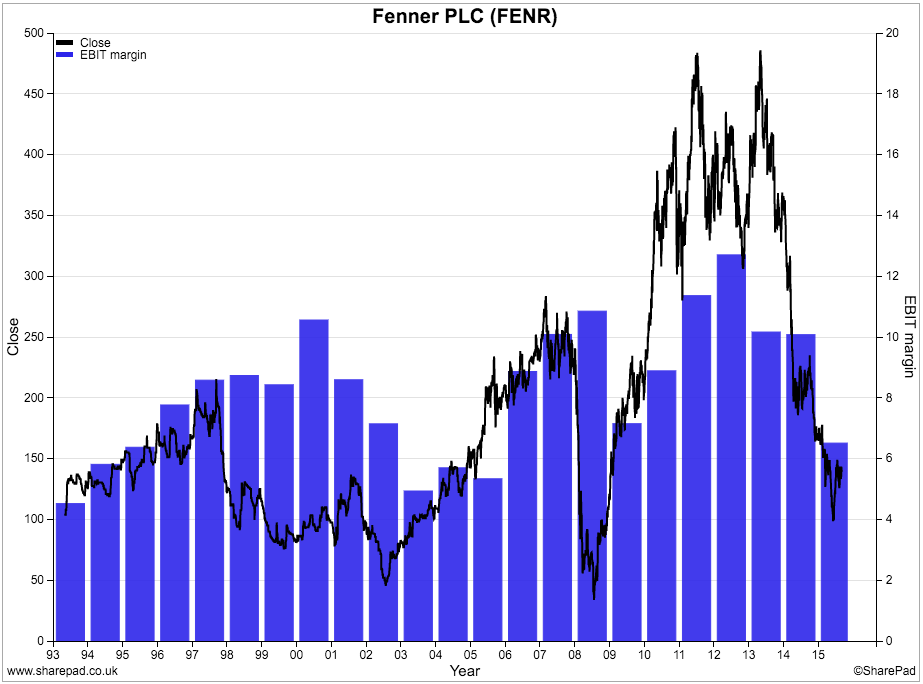
The share price has tended to rise as profit margins have been rising and fall when margins have fallen. This chart is very informative when looking at cyclical shares in general.
What it is telling us is that investors aren't very good at predicting changes in the company's profit margins. Professional investors tend to extrapolate recent trends and think they will carry on. When the direction of profit margins changes, you can see big upwards and downwards moves in share prices.
You really can't analyse cyclical companies very easily without a decent history. With SharePad, I've been able to take my analysis of Fenner's profit margins and share price back to 1993.
A strategy for buying and selling cyclical shares
So what does this tell us in terms of buying and selling the shares of cyclical companies such as Fenner?
To answer this question we have to take into account the valuation of the shares. As I will show you, valuing cyclical shares is not an easy thing to do.
Cyclical shares need to be treated differently when you are interpreting the valuation of them. I'll explain why by discussing the chart below which plots Fenner's profit margins against its trailing PE ratio (share price divided by the last reported year's EPS) as a measure of valuation.
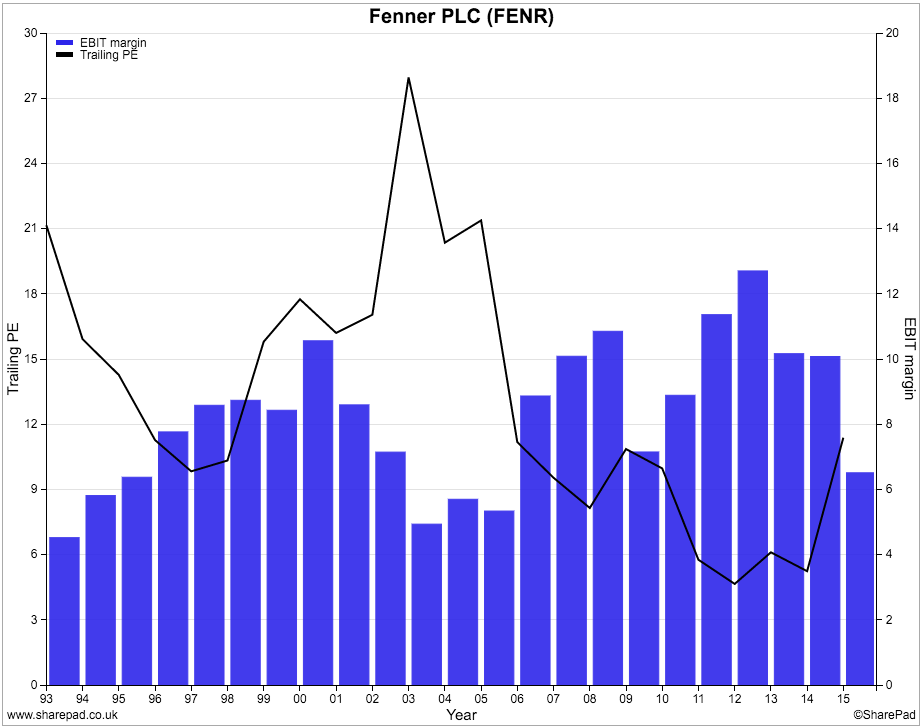
If you look at the bars on the chart you can see four cyclical troughs in Fenner's profit margin:
- 1993
- 2003
- 2009
- 2015
In each instance, these cyclical troughs in profit margins match quite closely the cyclical peaks in valuation - the trailing PE ratio. In other words, cyclical shares tend to look most expensive when their profits are depressed.
The trailing PE ratio also tends to be near a cyclical low when profit margins are at their highest. The shares look cheaper when profits are booming. There are four peaks in profit margins since 1993:
- 1998
- 2000
- 2008
- 2012
This is the opposite scenario to what you would expect to find with most shares. It tells you that the stock market is not stupid when it comes to cyclical companies. High PE ratios tend to indicate high rates of expected profits growth - the kind of profits growth you might see from a recovering cyclical company. Low PE ratios indicate low growth or falling profits ahead.
Does this mean that investors can have some simple rules to buy and sell cyclical shares which can allow them to make profits and protect themselves from losses?
For example:
- Buying when the trailing PE ratio reaches a cyclical peak - when they look expensive.
- Selling when the trailing PE ratio reaches a cyclical trough - when the look cheap.
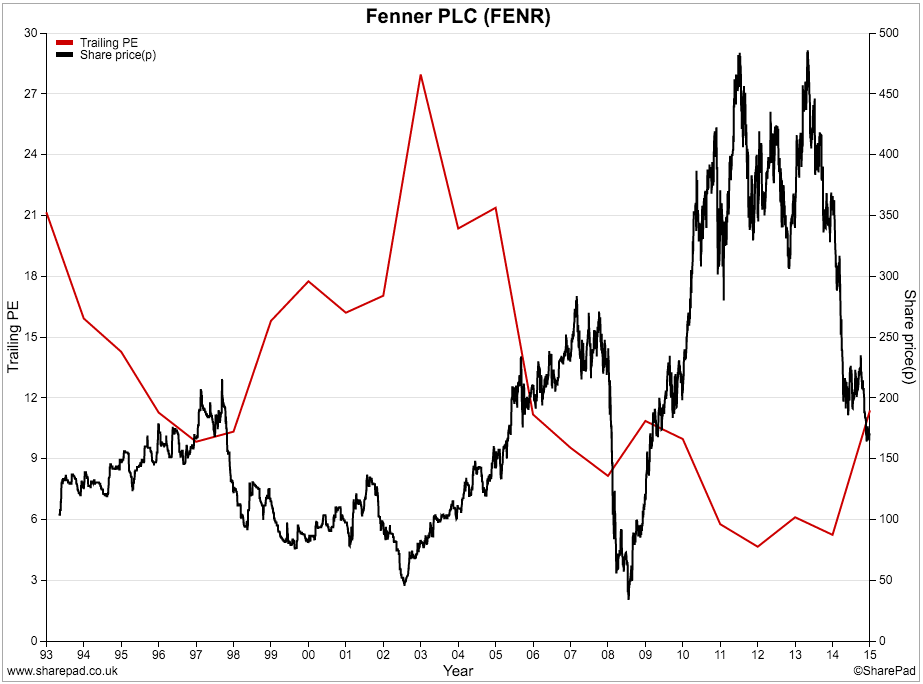
A quick glance at the chart above suggests that this would have worked quite well apart from 2008 when you would have been selling after a lot of losses had been inflicted. Perhaps profit margin is a better guide than the trailing PE?
Let's look at the chart of profit margins and the share price again.

It's all very well being wise with hindsight but maybe margins have been a better indicator with Fenner at keeping investors in and out of the shares at the right time. For example by buying when margins reach a low point and selling when they reach a cyclical high such as:
- Buy 1993, Sell in 1998
- Buy in 2003, Sell in 2008
- Buy in 2009, Sell in 2012
However, the main drawback with this approach is that the investor at the time does not know whether profit margins have peaked or troughed. They know the level of profit margins compared with history but not whether the current trend has ended.
So is there is a better way of weighing up the value of a cyclical share?
A common suggestion is to use a multiple of average profits over a period of 7 or 10 years. A slight problem with this approach is that when profits have grown significantly in recent years, average profits may not be the same as sustainable profits.
I prefer to work out an estimate of average profits using 10 year (or however long you think a profit cycle is) average profit margins as shown below.
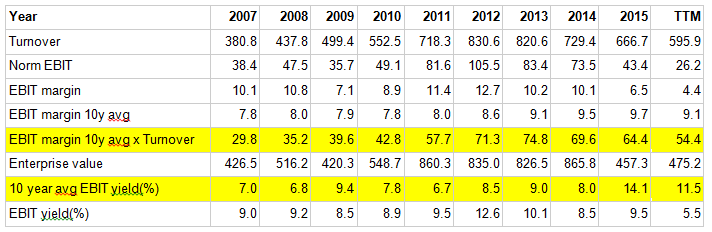
What I have done here is to work out the 10 year average trading profit (EBIT) by multiplying the 10 year average profit margin by the turnover for the year. I have then divided this profit number by Fenner's enterprise value to see what EBIT yield is on offer. The reasoning here is that a high EBIT yield based on average profits which take into account the cyclical nature of the business might indicate a cheap share.
SharePad has EBIT margin data on Fenner going back to 1986. It also allows me to calculate the 10 year average EBIT margin for each year and - using the Combine item feature - calculate an average profit figure. All these figures were put into a custom financial table in SharePad. The only figure I couldn't get SharePad to work out for me was the average EBIT yield (not yet anyway) but because I can easily export my data to a spreadsheet this wasn't a problem.
What you can see is that up until 2015, Fenner's shares have not looked particularly attractive on an EBIT yield. I would consider an EBIT yield of at least 10% as an absolute minimum to even consider buying a cyclical share on this basis and probably nearer 15% given the risks involved.
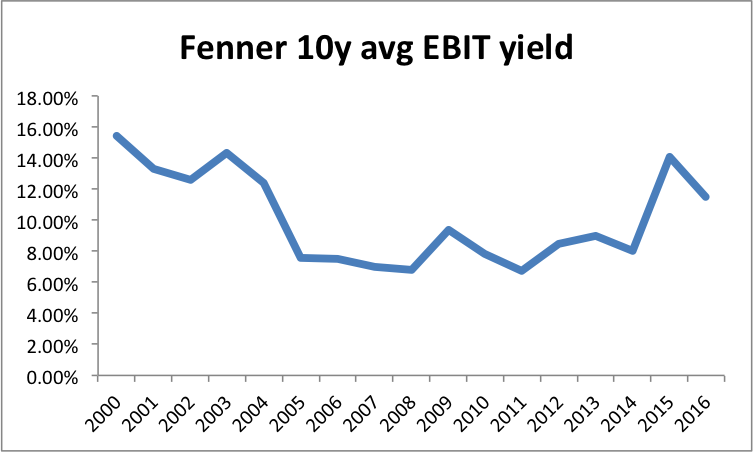
As you can see, Fenner shares have rarely looked cheap on this measure. They were between August 2000 (Fenner has an August year end) and August 2004 when the shares basically went sideways and would have kept you out of the shares for the next ten years which with hindsight might not have been a bad thing.
I like this measure but it doesn't seem to work well with Fenner. In terms of timing buying and selling points as cyclical shares it hasn't told us much. On a long term view though it would have kept you out of the shares which would have saved you money and a lot of stress.
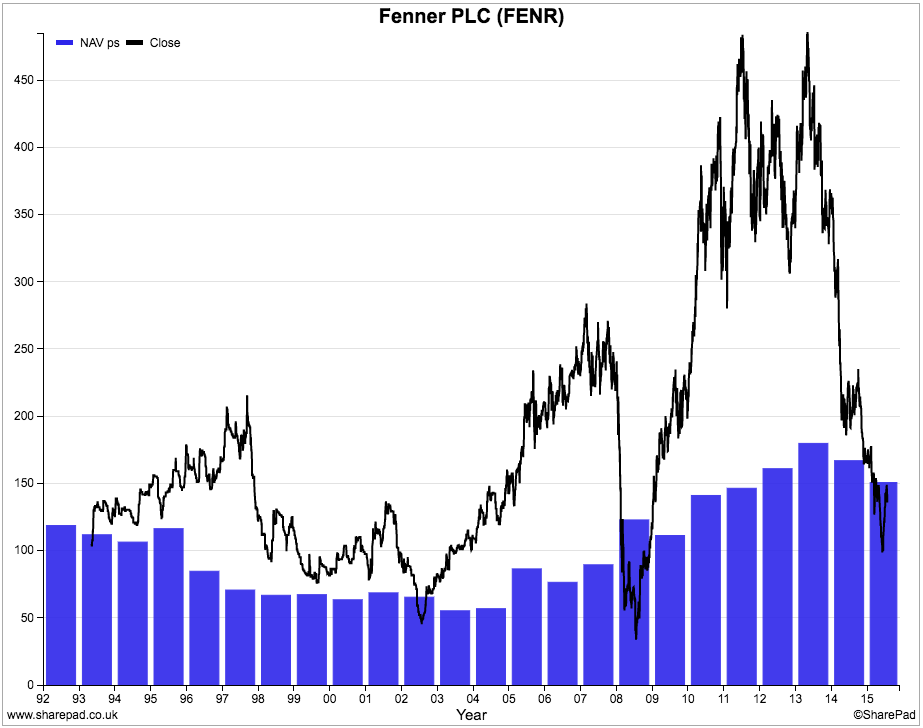
One measure that does seem to be better for timing buying and selling points is price to net asset value (P/NAV). Buying the shares when they are below the NAV per share and selling them when they reach a peak profit margin and high P/NAV could have worked well in the past as the chart below shows. For example:
- Buy 1993 and sell 1997
- Buy 2002 and sell 2007
- Buy 2008 and sell 2011/12
This raises the obvious question: are Fenner shares a buy now?
I'll leave you to work this one out for yourselves. But here are a few things to think about when considering a purchase of a cyclical share:
- Is the company experiencing a normal downturn or is something else happening? For example, has the industry changed which means that future demand for its products will not follow the same patterns as the past? For Fenner, you might consider how long oil prices will stay low or whether shale gas has destroyed the prospects of its major coal customers in the US.
- Is the company in financial difficulties? Can it weather a downturn in profits? Here you need to check whether key financial ratios such as interest cover and fixed charge cover are healthy and whether the company is generating enough cash flow.
- Is the problem company-specific or are similar companies experiencing similar problems? A company-specific problem might lead you to steer clear of the shares.
To sum up
- Cyclical shares are hard for investors to understand.
- But they can offer big money-making opportunities at the right time.
- Studying a cyclical company's financial history is very important.
- Pay close attention to the trend in trading profits (EBIT), ROCE and profit margins.
- Valuing cyclical companies is not easy.
- Buying opportunities occur when the financial performance is bleakest.
- High PE ratios may signal a buying opportunity whereas low PEs could be a selling signal.
- A strategy based on P/NAV and profit margins might work well with cyclical shares.
- You might need a different strategy for each cyclical company/sector.
If you have found this article of interest, please feel free to share it with your friends and colleagues:
We welcome suggestions for future articles - please email me at analysis@sharescope.co.uk. You can also follow me on Twitter @PhilJOakley. If you'd like to know when a new article or chapter for the Step-by-Step Guide is published, send us your email address using the form at the top of the page. You don't need to be a subscriber.
This article is for educational purposes only. It is not a recommendation to buy or sell shares or other investments. Do your own research before buying or selling any investment or seek professional financial advice.

