How to check the condition of a company's assets
This article is going to cover a more advanced topic of financial analysis. It will help you understand whether a company's profits, cash flows and financial returns are believable. It will also show you how to spot situations where a company could be under-investing in its assets which might lead to a big bill further down the road.
I consider this topic to be one of the most important in financial analysis, especially when looking at asset-intensive companies. Time spent on this will definitely make you a better informed investor.
Want to learn how to analyse shares like a professional? Download our FREE guide.
Sign-up to our mailing list to receive a PDF of our Step-by-Step Guide to Investing.
Share this article with your friends and colleagues:
The relationship between capex and depreciation
This can be quite a dry subject but I'll do my best to make it interesting.
Why capex is one of the most important numbers for investors
Regular readers will know that I spend a lot of time writing about cash flow analysis of companies. In particular, a lot of attention is focused on a company's capex (capital expenditure) figure - how much it spends on new fixed assets each year.
Capex is one of the most important numbers in a company's financial statements. This is because it is a flow of cash out of a company's coffers and reduces the amount of money left over to pay shareholders (free cash flow). Yet very few companies can survive and prosper without spending some money.
Capex is split into two parts. There is maintenance capex which is how much a company needs to spend to maintain its existing assets and keep them in good condition. A company cannot skimp on this for too long before its sales and profits start to suffer. The other part is growth capex or how much is invested in new projects in the hope that profits and cash flows will be higher in future years than they are now.
It's a good idea to spend some time trying to understand what's going on with a company's capex spending. You need to try and find out whether a company is spending too little or too much.
The too much bit is probably easier to spot. A company that is spending too much will tend to have small or negative free cash flows and a low and declining return on capital employed (ROCE). Tesco in recent years is a good example of this.
To spot companies that are spending too little requires a bit more legwork.
Depreciation
Depreciation is a non-cash expense which matches the cost of a fixed asset such as a machine against the revenue it helps to make over its useful life. It reduces a company's profits each year. Depreciation should not be automatically seen as a proxy for maintenance capex but if it is calculated prudently it won't be far off.
A company can depreciate an asset in a number of ways. The most common method is known as straight-line depreciation where an equal amount of depreciation is charged each year over an asset's useful life.
Let's say a company buys a machine for £1 million. The directors estimate it will last for ten years and will be worth nothing at the end of its life (its residual value is zero). The depreciation to be charged against revenues each year in the income statement will be worked out by the following formula:

Capex numbers are often compared with the depreciation expense in a company's accounts; if capex is less than depreciation then some may conclude that the company is under-investing.
Like lots of things with investing it's not quite as simple as that. How do you know if depreciation is too high or too low?
Directors can change depreciation expenses to boost profits very easily. The easiest way to do this is to increase the useful life of an asset.
Take the case of the machine above. If the directors change the estimated useful life to 20 years - even though it will only last ten - the depreciation comes down to £50,000 per year and profits go up by the same amount. But it doesn't change a company's cash flow and how much it ultimately has to spend.
Anyone who owns a car will know that depreciation is a real cost. If you buy a brand new car that costs £10,000 outright for cash then, if you are lucky, it will be worth about 40% of what you paid for it three years later or £4,000 (according to the AA). It has depreciated by £6,000 and if you want to replace it with another brand new one you are going to have to find the same amount of money to do it. The same rules apply to the fixed assets owned by companies.
So, having changed the depreciation to boost profits, the machine will have depreciated by £500,000 after ten years and will be sitting on the balance sheet for a value of £500,000 (£1million less ten years of £50,000 depreciation) even though it has worn out and has no value. That £500,000 will have to be written off as a loss and the company and its shareholders will have to find another £1 million of cash (plus inflation) to replace it.
The cash flow statement will tell you the truth as it often does.
But how could you have spotted this was going on?
In this article I am going to teach you three things:
- How to work out whether depreciation might be too high or too low
- How to estimate how worn out a company's assets might be.
- How to estimate the age of a company's assets.
Once you've learned these three skills you will be able to scrutinise asset-intensive companies better and hopefully protect yourself from being fooled.
Looking at Supermarket assets
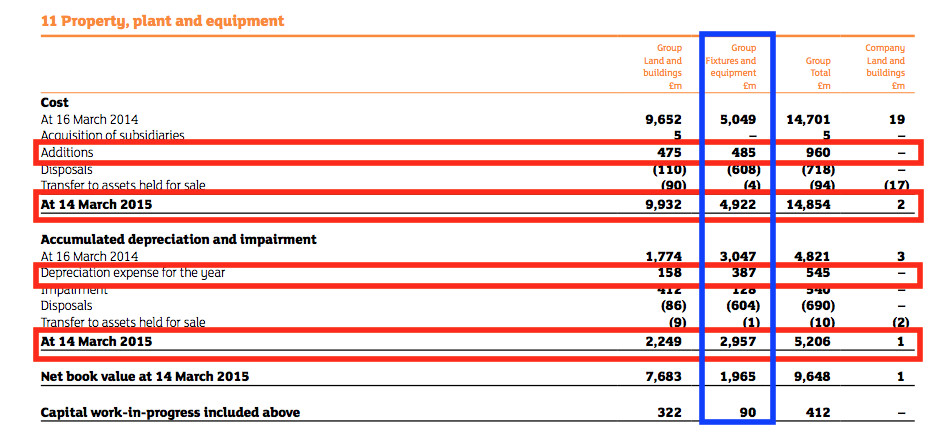
We are going to be looking at the assets of supermarkets to show you how to do some practical calculations. Below is a snapshot from Sainsbury's 2015 annual accounts. It shows what has been going on with its property, plant and equipment assets. These assets will include things such as shelving, tills, conveyor belts, fridges, freezers and ovens - not the supermarket buildings or the land they are built on.
I am going to concentrate on the fixtures and equipment as this is where the bulk of the company's depreciation expense and maintenance capex requirement comes from. In particular, I will be focusing on the following key numbers which I have highlighted on the screen shot:
- The original cost of the assets - in this case £4922 million.
- The additions (or capex) for the year of £485 million.
- The depreciation expense of £387 million.
- The cumulative amount of depreciation on the assets of £2957m.
These numbers can help you learn a lot about the condition of a company's assets; whether it is spending too little on them - and a big future capex bill is likely - and whether the depreciation charge and therefore a company's profits are prudently stated.
Let's start by calculating the rate of depreciation on the fixtures and equipment. This tells us by what percentage the asset is depreciated each year.
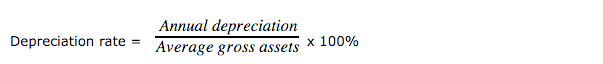
To calculate the average gross assets you take the starting value of £5049m, add it to the closing value of £4922m and divide by 2. This gives £4986m.
The depreciation rate is:
387/4986 = 7.76%
Some analysts use this answer to estimate the assumed life of the assets. You do this by calculating 1/7.76% to get an estimate of 12.9 years. The lower the depreciation rate, the longer the assumed life of the assets.
This figure of 7.76% is meaningless in isolation; you need to compare it with previous years and ideally with similar companies if you can. In the chart below, I've compared the historical and current depreciation rates of Sainsbury's with Tesco and Morrisons.
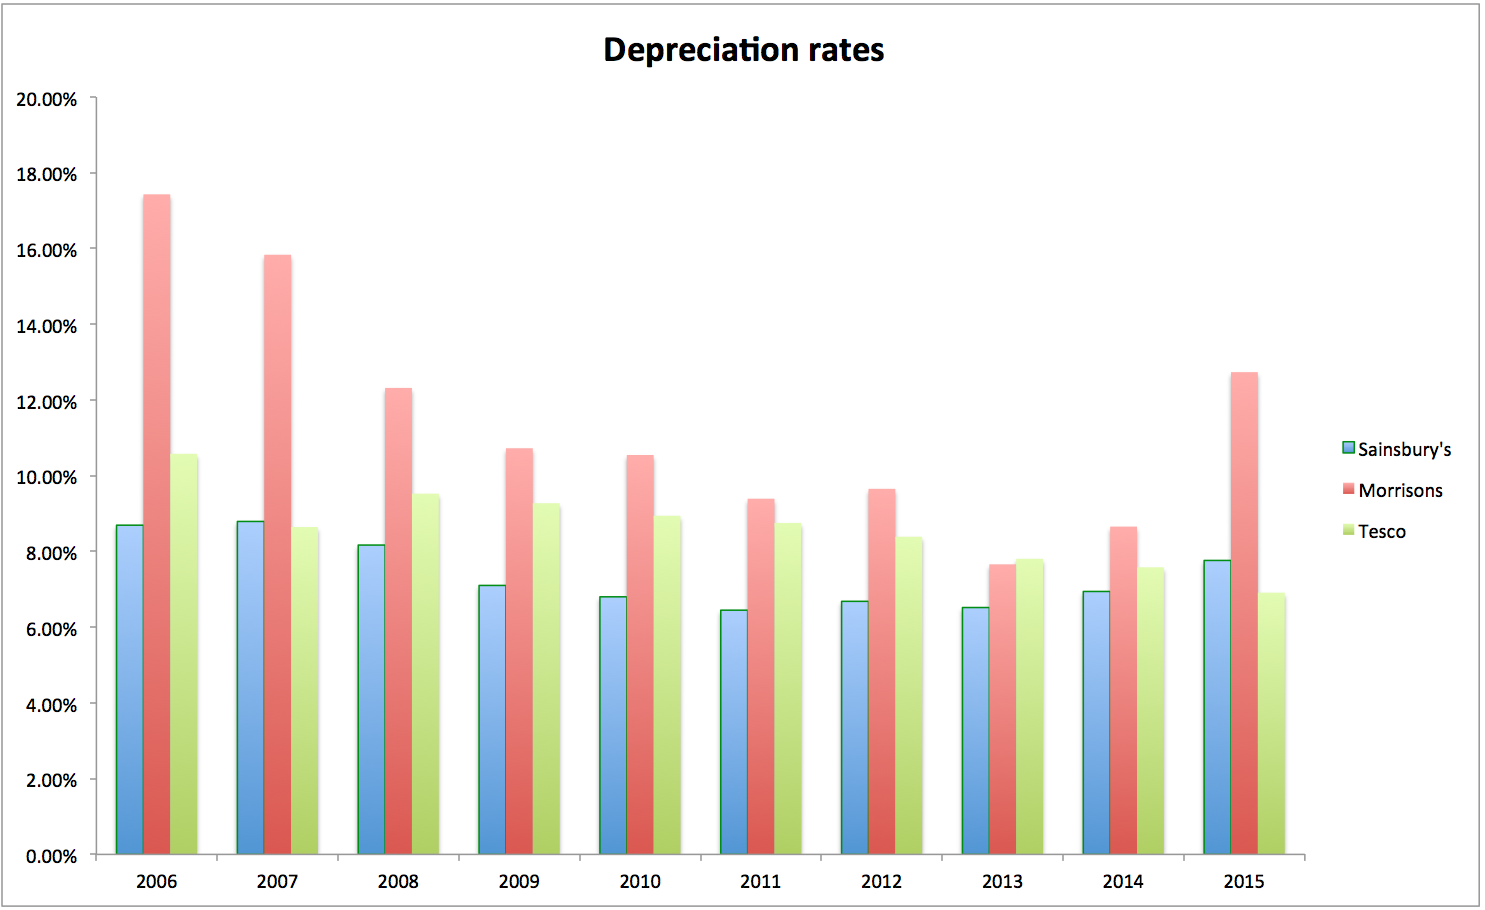
Sainsbury's is the first (blue) bar shown for each year. Its depreciation rate is similar to the range of rates seen for the last ten years although last year the rate increased. It currently has a higher depreciation rate than Tesco (the third/green bar in each set) - that is, it is depreciating its assets faster. Tesco's rate has steadily fallen over the last ten years and is now 6.81%.
The real outlier here is Morrisons (the middle/red bar). For years, Morrisons has had the most conservative depreciation policy - and probably the most conservatively stated profits - in the supermarket sector. What I mean here is that Morrisons was assuming a shorter asset life. In fact, Morrisons was probably over-depreciating. Its depreciation rate did fall significantly so that it wasn't much different from its peers but it rose sharply again last year.
The reason for the sharp rise was because Morrison had lots of assets that had been fully depreciated - fully written off. This caused the depreciation rate to fall as the gross assets figure in the calculation included assets where no depreciation was being charged at all. When these fell out at the end of 2014, Morrisons' depreciation leapt back up to 12.7%.
So what have we learned here?
We know that Sainsbury's and Tesco's depreciation rates are much lower than that of Morrisons. There are three main reasons why this might be the case:
- Their depreciation policies are less conservative and could be too low.
- They have a lot of fully depreciated assets.
- The company's mix of assets has shifted towards assets that have longer lives.
The first reason could be worrying as it means that profits may not be as they seem - they could be too high. The second is also a concern as a company's capital employed and therefore ROCE and CROCI ratios will be boosted by owning assets that are fully written off - the capital employed will be temporarily low and understated.
If a company has a lot of fully depreciated and worn out assets then most of them are going to need replacing. This means that there will be an increase in capex in the future. This will reduce future free cash flows, increase capital employed and lower profits as the depreciation charge increases. ROCE will fall as replacing assets is unlikely to cause profits to increase by much.
It is also possible that the company's assets could be more efficient and last longer. That would be a positive development.
How worn out are a company's assets?
You can estimate this from the following calculation. I am going to call it the worn out ratio.

This ratio is telling you how much cumulative depreciation has been charged as a percentage of the original asset costs. The higher the percentage, the more worn out the company's assets might be.
For Sainsbury's in 2015 the worn out ratio was 2957/4922 or 60%. Again for this ratio to have any meaning it has to be compared with an historical trend and ideally the ratios of similar companies.
What you ideally want to see in the chart below is the line staying flat or preferably sloping downwards. This might be a sign that a company is keeping its asset base reasonably well invested.
Sainsbury's ratio (the middle/blue line) is trending down. Morrisons' (red line) has fallen sharply as fully depreciated assets have been replaced. The company's previously high depreciation rate a decade ago suggested - probably incorrectly - that its assets were worn out when they were not (it was just over-depreciating).
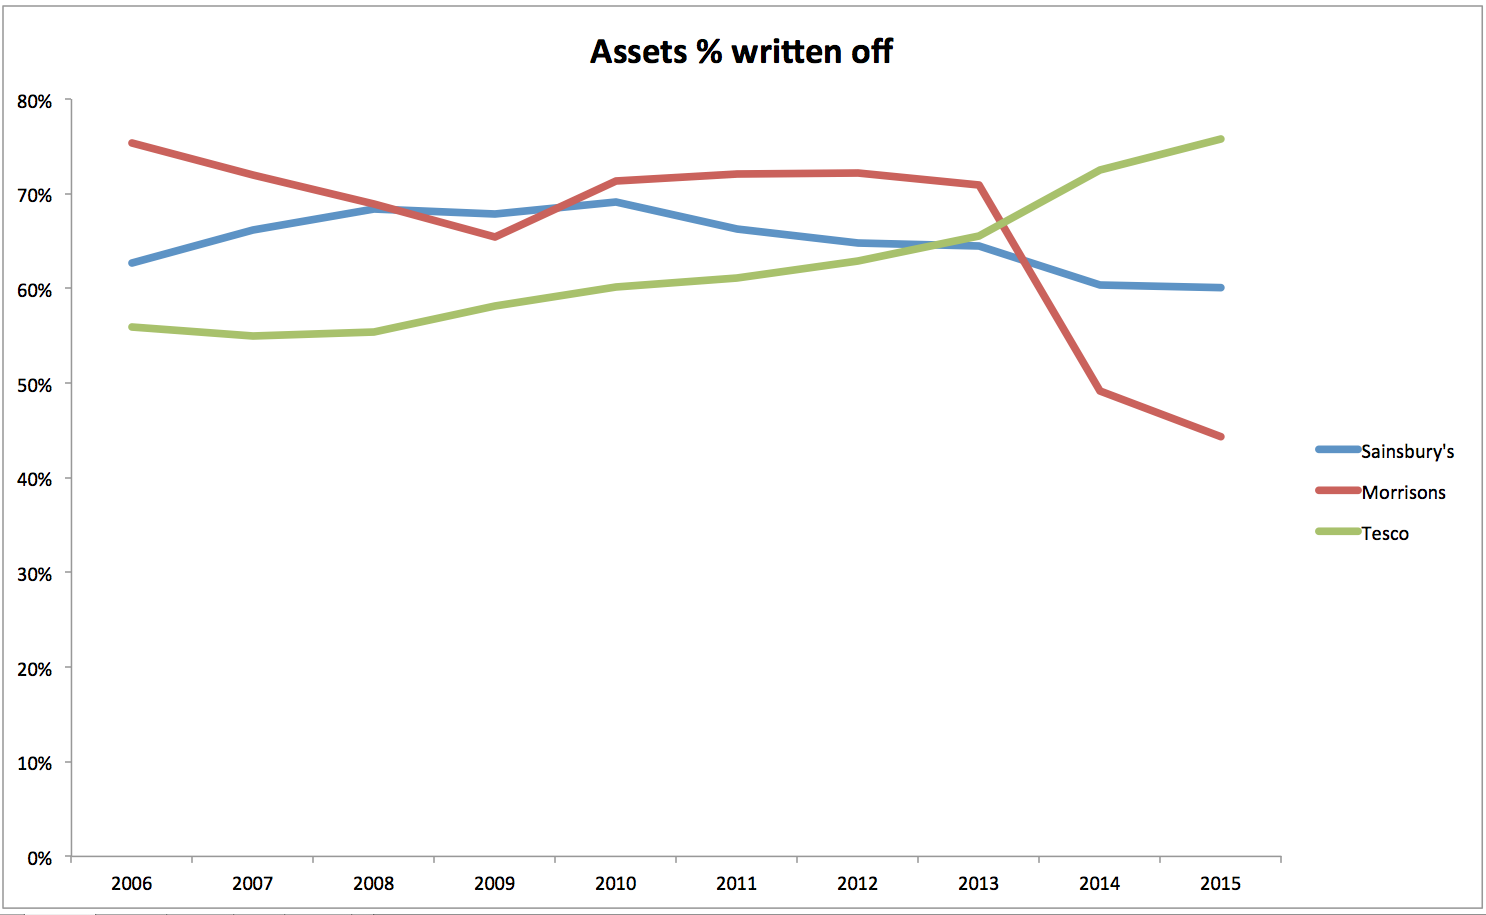
Tesco's ratio is probably the most concerning. It has the lowest depreciation rate and the highest worn out ratio. During the last ten years the ratio has jumped from 56% to over 75%. The ratio has jumped by over 10% in the last two years alone. This is not a good sign.
Estimating the average age of assets
You can estimate the average age of a company's assets from its accounts.

For Sainsbury's in 2015 the estimated average age was 2957/387 or 7.64 years.
The first/blue bars in the chart below show that the average age of Sainsbury's assets increased to over ten years at the end of the last decade and has since come down. This is an encouraging sign and might indicate that replacement costs might not be too onerous during the next few years. The same can be said for Morrisons (red/middle bars) which now appears to have a very young asset base for its fixtures and fittings.
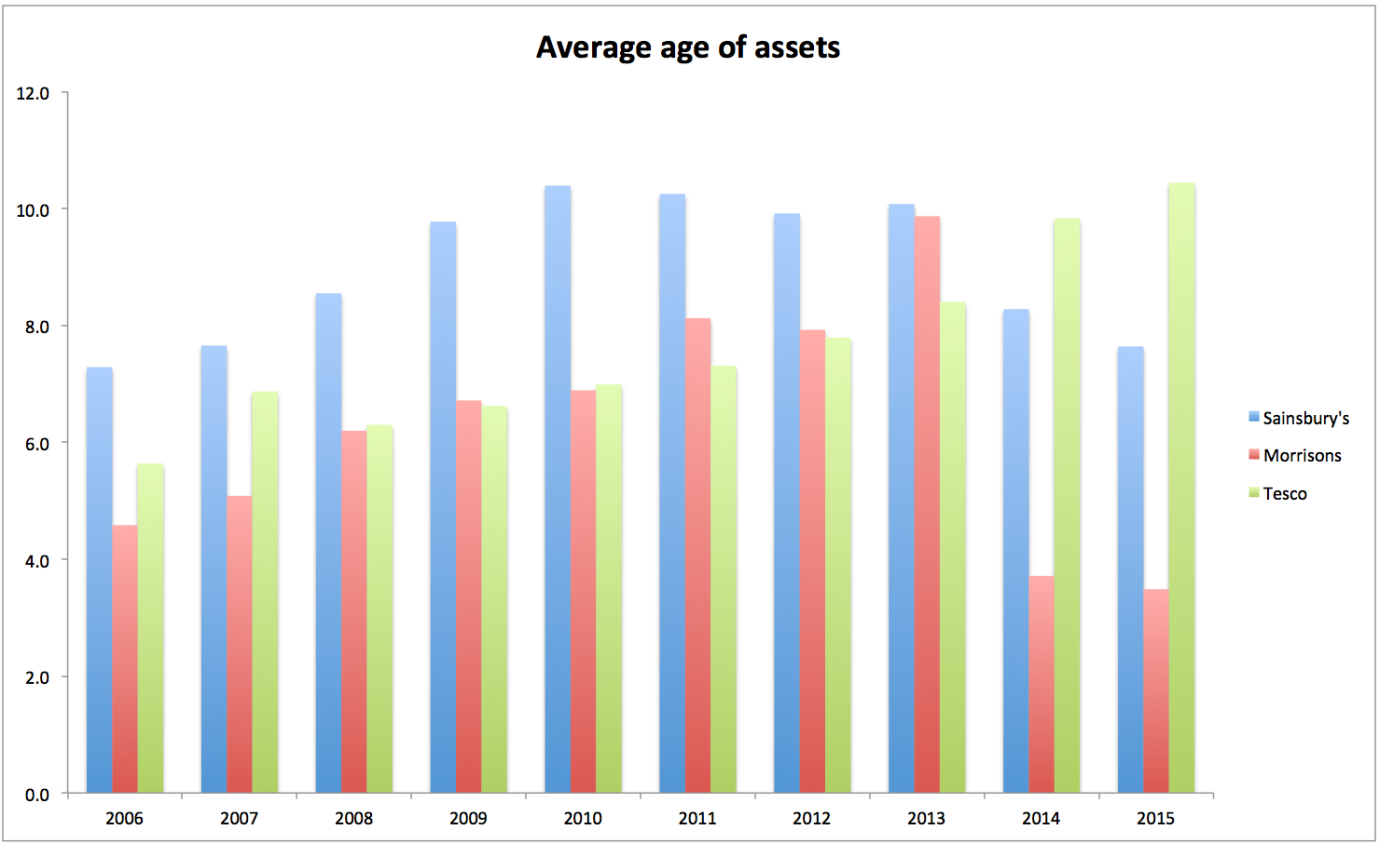
Again it is Tesco (green bars) which stands out. The average age of its assets has been increasing. This is not too surprising as the company has been in financial difficulties. One of the easiest ways to gain some breathing room is to cut back on investment but this can't be done for long before the business starts to suffer and a big capex bill arrives.
Has Tesco been under-investing?
Having crunched a few numbers it would seem to suggest that Morrisons has the most prudent depreciation policy and a well-invested asset base which looks young and not too worn out. Sainsbury's looks to be in a reasonable state as well.
An analysis of Tesco is more alarming:
- It has the lowest depreciation rate.
- Its assets look the most worn out.
- Its assets are getting older.
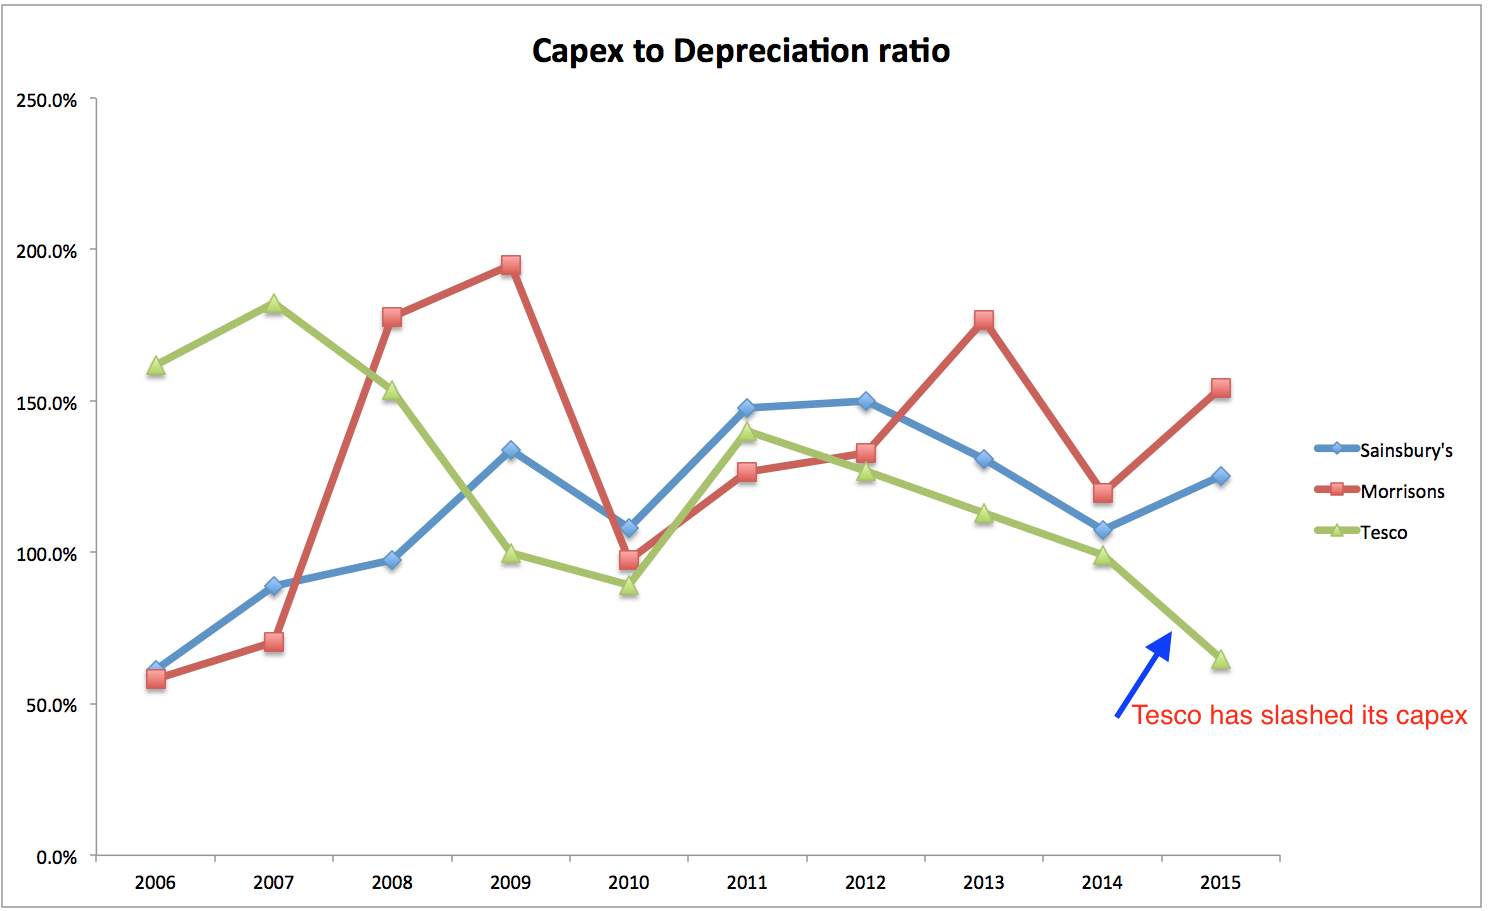
The chart above shows that Tesco has slashed its capex on plant, equipment, fixtures and fittings and has been spending much less on assets than its depreciation expense - which looks low compared with its peers.

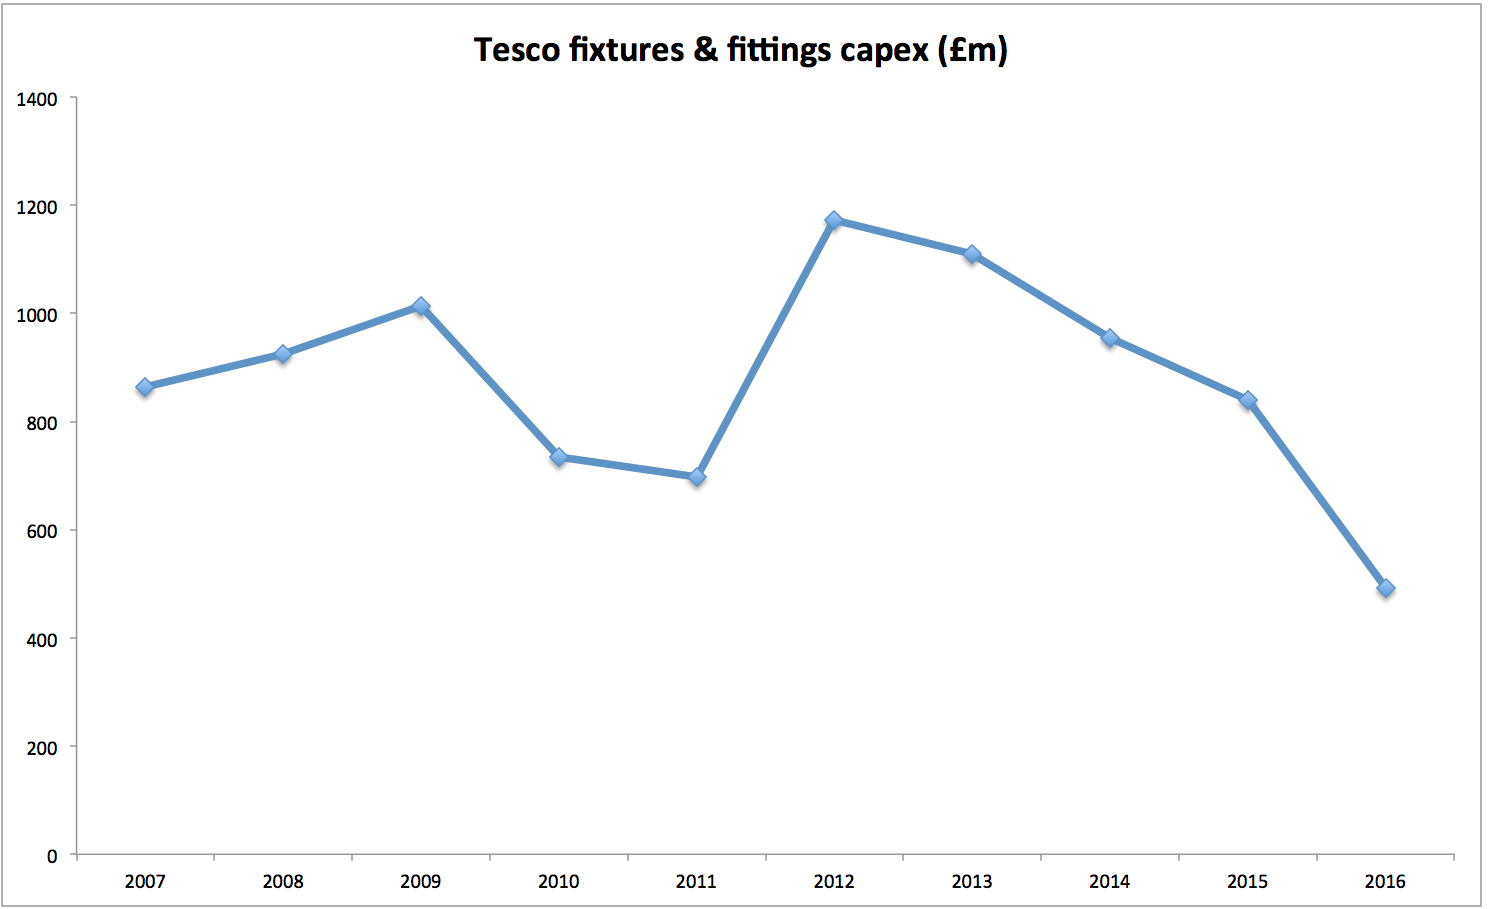
In 2015, Sainsbury's capex to depreciation ratio for fixtures and equipment was 125% (485/387). Morrisons' was 154% but Tesco's was only 65% compared to 99.2% in 2014/15. Its capex on fixtures and fittings fell by 41% or £257m last year to £493m compared with a depreciation charge on those assets of £759m.
This development could be a big red flag for investors. It is clear that Tesco has slashed investment in its stores to generate free cash flow (which was £1.1bn last year) and pay down its debts but it may be doing more damage to its long-term prospects by under-investing. Free cash flow in this case is a sign of financial weakness rather than strength.
Given the indicated age and condition of its assets it would not be surprising if capex has to increase significantly in a year or two. If Tesco's profitability does not improve markedly then its free cash flow could plunge and delay its ability to start paying meaningful dividends again.
To sum up
- The relationship between capex and depreciation is one of the most important in financial analysis, especially when looking at asset-intensive companies.
- Depreciation and capex are major determinants of company profits and free cash flow.
- Depreciation can be manipulated to boost profits in the short-term.
- Assets wear out and so the cash spent on them is hard to avoid in the long run.
- Company accounts allow you to gain a valuable insight into the state of a company's assets.
- The depreciation ratio can tell you if profits are prudently stated or not. It may also signal the existence of fully depreciated assets
- It is also possible to estimate how worn out assets are as well as their average age.
- Old, worn out assets overstate a company's profits as depreciation is too low. They also understate capital employed and flatter ROCE and free cash flow. They can therefore fool you into thinking that a company is better than it really is.
- Worn out and ageing assets will need to be replaced. A company skimping on capex today may face a big bill in the future which could lower profits, ROCE and free cash flow - which in turn could threaten dividend payments.
If you have found this article of interest, please feel free to share it with your friends and colleagues:
We welcome suggestions for future articles - please email me at analysis@sharescope.co.uk. You can also follow me on Twitter @PhilJOakley. If you'd like to know when a new article or chapter for the Step-by-Step Guide is published, send us your email address using the form at the top of the page. You don't need to be a subscriber.
This article is for educational purposes only. It is not a recommendation to buy or sell shares or other investments. Do your own research before buying or selling any investment or seek professional financial advice.

