Stock Watch: Reckitt Benckiser
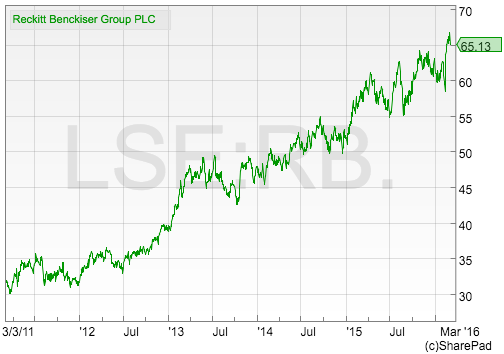
Reckitt Benckiser (RB) shares have performed extremely well during the last five years. A major reason for this is that companies such as RB with its portfolio of leading consumer brands have been increasingly seen as 'must have' investments with dependable profits and cash flows.
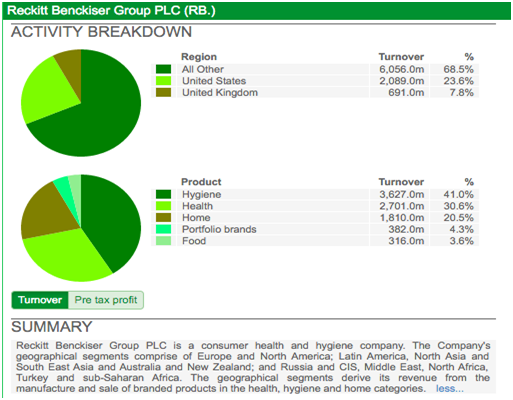
The company owns some of the best known healthcare, hygiene and home care brands in the world - the kind of products that are found in just about every supermarket and are bought by millions of shoppers. A few examples are: Dettol, Nurofen, Scholl, Veet, Finish, Durex, Airwick, Gaviscon and Calgon. Who wouldn't want to own a slice of those?
Want to learn how to analyse shares like a professional? Download our FREE guide.
Sign-up to our mailing list to receive a PDF of our Step-by-Step Guide to Investing.
Share this article with your friends and colleagues:
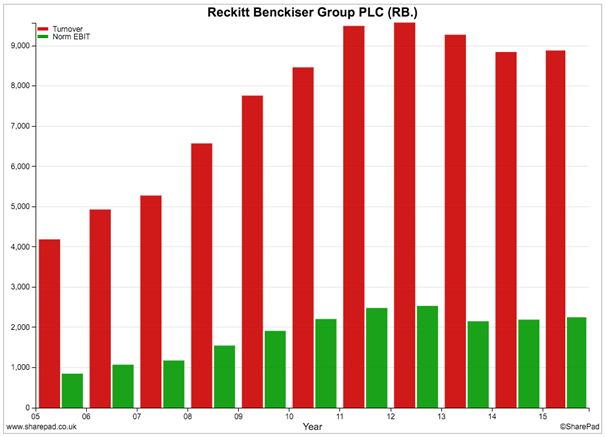
Turnover & profit history
RB has a pretty decent track record at growing its turnover and profits. Profit growth has stagnated recently due to tough markets, exchange rate effects and the demerger of its Pharmaceuticals business. Results in 2015 were on the up again.
Financial returns
As you can see from the chart below, RB has consistently generated high returns on the money that it invests in its business. This is a sign of a quality business.

Having said that, the trend in returns has been firmly downwards. ROCE (the second or green bars) was over 30% in 2007 and close to that in 2010. It is less than 20% now on a lease adjusted basis. This is still a good number but it is telling us that RB is not as profitable as it used to be.
Free cash flow returns (CROCI) are consistently above 10% which is a good sign. Again, as with ROCE, CROCI is substantially lower than it was at the end of the last decade.
Let's dig a little deeper and see what's been going on.
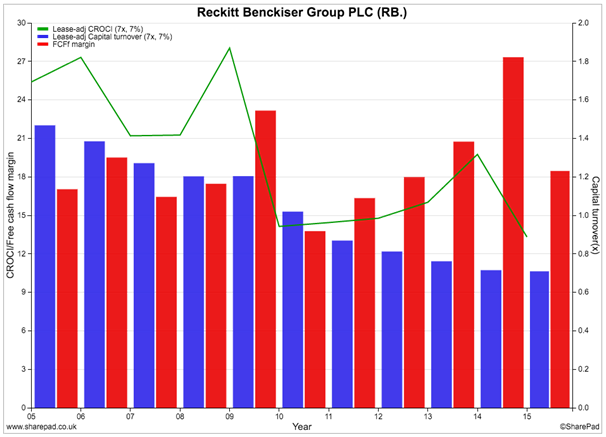
The two charts below show how RB is achieving its ROCE and CROCI numbers. It looks at the trend in profit and cash flow margins and capital turnover - how much sales the company generates per £1 of money invested. If you multiply a company's profit or cash flow margin by its capital turnover you will get its ROCE or CROCI.
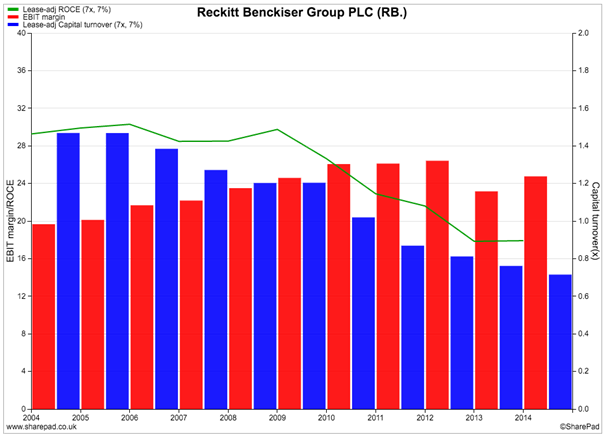
You can see that profit margins (the first or red bars) have held up quite well. Capital turnover though has fallen quite sharply to around half the levels it was a decade ago. The fall in capital turnover since 2010 has been quite dramatic and needs to be investigated further as the ratio is still falling.
One of the best ways to look at the trend in a ratio is to create a custom results table in SharePad as I've done below.
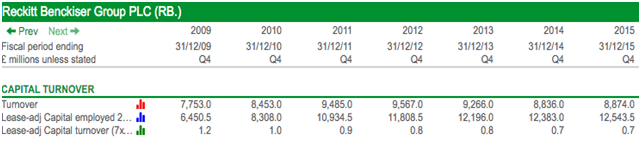
Here I've split out the two components of the capital turnover ratio - turnover and capital employed - as well as showing the ratio itself. Back in 2009 you can see that RB was generating around £1.20 in sales for every £1 invested. In 2015 that number had fallen to 70p.
There was a big rise in average capital employed in 2010 and 2011. You can usually find the reasons for this by studying the cash flow statement (see below). In RB's case there was nearly £3bn spent on acquisitions in 2010/11, a rise in capital expenditure, increases in working capital and higher rental expenses.
This heavy investment has changed the profitability profile of RB. The extra sales from it have been a lot lower than in the past and so ROCE and CROCI are increasingly reliant on the trend in profit and cash flow margins. It may also explain why RB is spending a lot of time and effort trying to improve its margins because increasing capital turnover might be too difficult.
Similar trends can be seen in the breakdown of CROCI. Free cash flow margins have been improving - with the exception of 2015 - to offset a declining capital turnover. CROCI had been improving for a while since 2010 suggesting that RB's cash flow performance had been better than its profits.
The trend in spending on acquisitions is highlighted in RB's cash flow statement below. You can also see a sharp drop in operating cash flow in 2015 as around £300m was lost from the demerger of the Pharmaceuticals business and there was a £202m outflow from creditors.
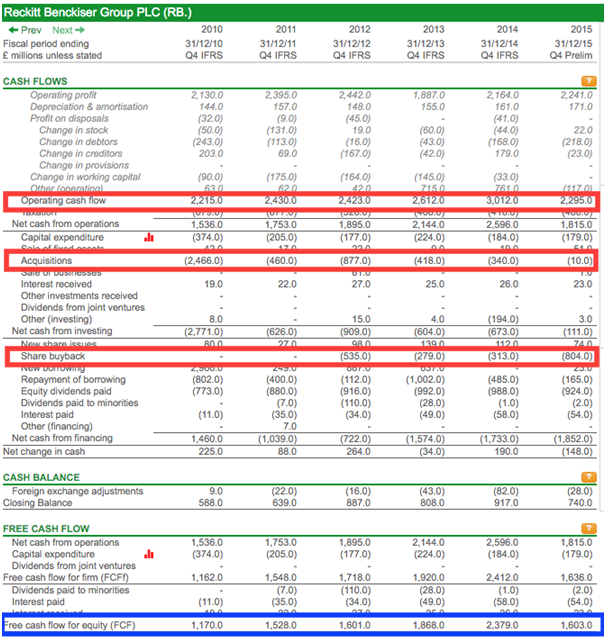
This fed through to the company's free cash flow performance highlighted in blue above. That said, RB is good at producing lots free cash flow.
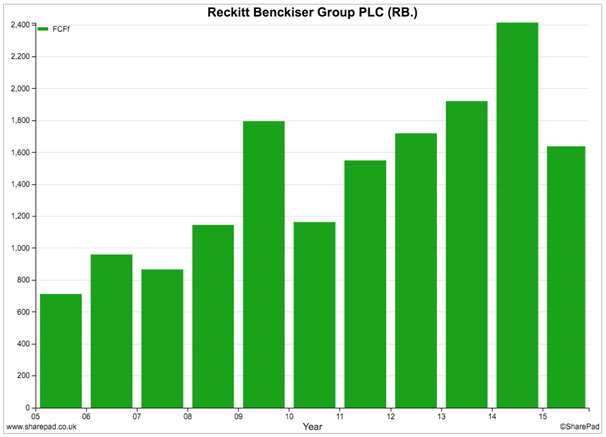
It is also good at turning its profits into cash. You can see that in most years the difference between free cash flow per share (the green bars) and earnings per share (EPS, the red bars) is not that big.
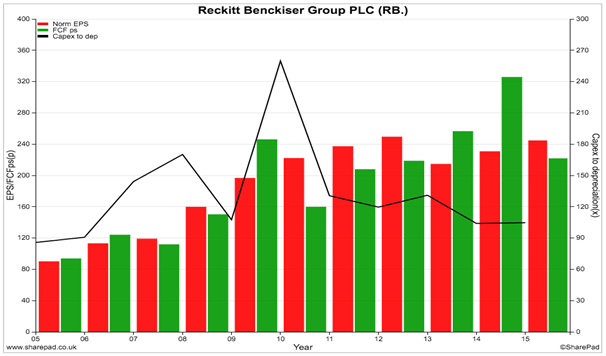
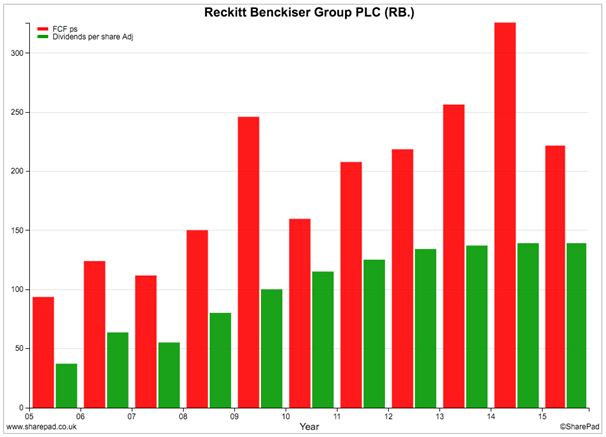
This free cash flow performance has helped RB keep on paying bigger dividends to shareholders in recent years. However, dividend growth was zero in 2015 following the demerger of the Pharmaceuticals business.
Dividends versus share buybacks
If you go back and look at RB's cash flow statement you will see that I have highlighted the amount of money spent on share buybacks in recent years. Between 2012 and 2015, it spent just over £1.9bn buying back shares. Over £800m was spent in 2015 and another £800m could be spent in 2016 according to the company.
When you see a company buying its own shares you need to go and check what is happening to them once they have been bought. Often the shares are cancelled. Sometimes though the company holds them as Treasury shares so that it has the option of issuing them again for things such as employee share save schemes or bonuses.
RB has not been cancelling its shares but instead has been holding them in treasury to be issued later on. This has reduced the number of shares in the EPS calculation and has helped boost the figure.
However, just over 30m shares (4% of the 736m shares that have been issued) are now held as treasury shares. These are shares that are likely to come back onto the stock market in the years ahead as bonus and share save plans mature.
If they do, RB will get some cash coming back into the business when share options are exercised but it looks as if it will have to keep on spending reasonable chunks of its free cash flow to keep on buying back shares to stop these extra shares diluting (reducing) EPS. This is money that could have been paid to shareholders as dividends and is often cited as a bad use of cash flow that doesn't make shareholders any richer.
The company's policy on dividends and buybacks was mentioned in its recent 2015 results press release:
"We intend to continue our current policy of paying an ordinary dividend equivalent to around 50% of adjusted net income. We also intend to continue our current share buyback policy which broadly maintains our current debt level in 2016, subject to future M&A activity."
In its 2014 annual report it made the following comment:
"We intend to continue our current policy of paying an ordinary dividend equivalent to around 50% of adjusted net income. In addition, we plan to supplement the current share buyback policy which broadly neutralizes incentive plan share issuance (c. £300m p.a.) with an additional up to £500m share buyback programme in 2015."
So it looks as if £300m is being spent on stopping the number of shares rising because of management bonuses. This equates to over 40p per share that could have ended up in shareholders' pockets.
SharePad's share buyback calculator estimates that £500m spent on buying back RB shares at the current share price will only yield an equivalent rate of return of 4.9% and therefore may not be a good use of cash. (See my article Are share buybacks good for your wealth?)
Financial position
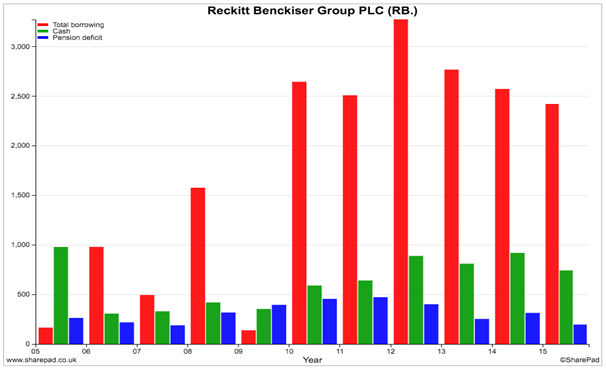
RB's finances are in good shape. Borrowings have fallen and the pension fund deficit does not appear to be a problem.
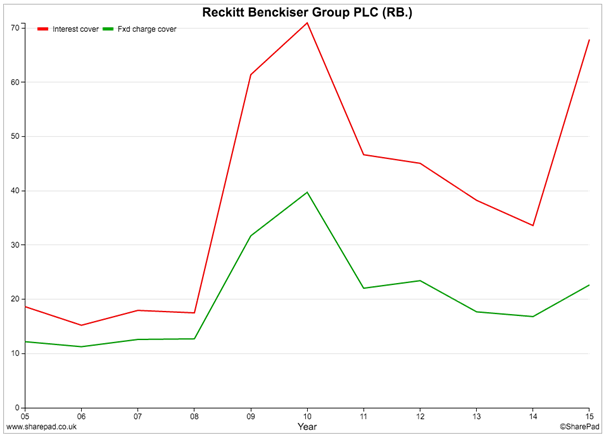
Interest cover and fixed charge cover ratios are also very healthy. There is nothing to worry about here.
Future prospects & valuation
RB is a very good business and this view is reflected in the valuation of its shares.
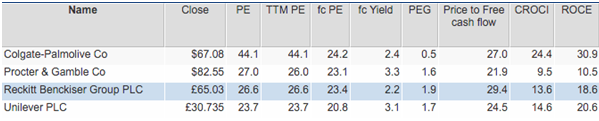
Along with other leading consumer goods companies such as Unilever, Procter & Gamble and Colgate-Palmolive its shares trade on a very high PE ratio and price to free cash flow ratio.
To justify a high valuation, companies have to deliver strong growth in profits and cash flows for many years to come. I've produced another results table in SharePad to look at what City analysts expect a bit more closely.
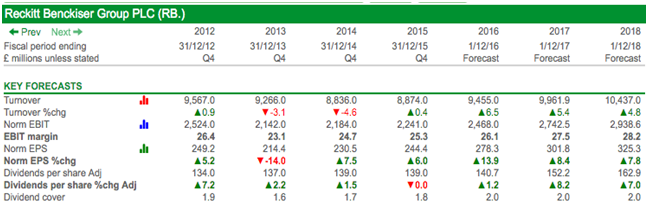
As you can see, analysts are expecting turnover growth of 5-6% and higher profit margins. This is expected to feed through to EPS and dividend growth and fits in with the company's recent outlook statement:
"In 2016, we expect that the macro environment will be tough, but remain confident that our strategic choices across Powerbrands and Powermarkets will enable RB to deliver another year of growth and margin expansion. We are targeting LFL (like-for-like) net revenue growth of +4-5%. For operating margin, we reiterate our medium term target of moderate margin expansion. We expect this to be supplemented in 2016 by part of the remaining Project Supercharge efficiencies.'
That's reasonable growth but whether it's good enough to sustain the current high valuation of the shares remains to be seen. Despite RB being an excellent business, could it be that investors are paying just a little bit too much for quality in this case?
There's no doubting that RB currently has a very credible strategy for growth.
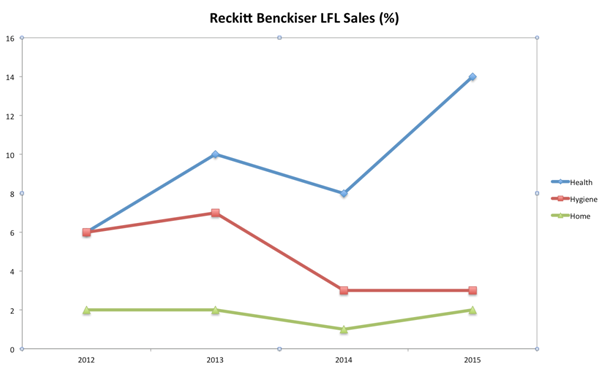
It has been focusing its attention on what it calls its power brands in target markets. As you can see from the chart above its health brands have been producing some very good rates of sales growth as new products have been introduced with great success with the likes of Scholl and Durex. Its Hygiene and Home brands have been growing at a much slower rate.
RB has been employing a virtuous earnings model. It has been selling new products which earn higher margins at the same time as cutting costs. The gains from these are being recycled into advertising spending on its top brands to drive more sales and profits and the process is repeated again.
This is very helpful in the short-run but even RB has admitted that the strong rates of growth seen from its Health brands have been exceptionally high and will slow down eventually. Longer-term, RB has been frequently tipped to either do a big acquisition of another big consumer brands company such as Colgate or be acquired itself. This is more likely if growth rates slow down.
To sum up
- RB appears to be a very good business.
- ROCE and CROCI are significantly lower than a decade ago.
- Profit margins have been rising but capital turnover has been falling.
- The company is a good generator of free cash flow and has high quality profits.
- It has a strong financial position.
- Lots of money has been spent on share buybacks to stop the number of shares rising from maturing company bonus plans.
- Buying back shares at the current share price doesn't look to be a good thing to do.
- The shares are trading at high multiples of profits and cash flow.
- Its Health brands are doing very well at the moment but growth will slow down.
- Hygiene and Health brands are finding it harder to grow.
- City analysts expect reasonable rather than stellar rates of sales and profits growth.
- RB may have to make a big acquisition to keep on growing or could be bought itself.
If you have found this article of interest, please feel free to share it with your friends and colleagues:
We welcome suggestions for future articles - please email me at analysis@sharescope.co.uk. You can also follow me on Twitter @PhilJOakley. If you'd like to know when a new article or chapter for the Step-by-Step Guide is published, send us your email address using the form at the top of the page. You don't need to be a subscriber.
This article is for educational purposes only. It is not a recommendation to buy or sell shares or other investments. Do your own research before buying or selling any investment or seek professional financial advice.

