Stock Watch: Associated British Foods
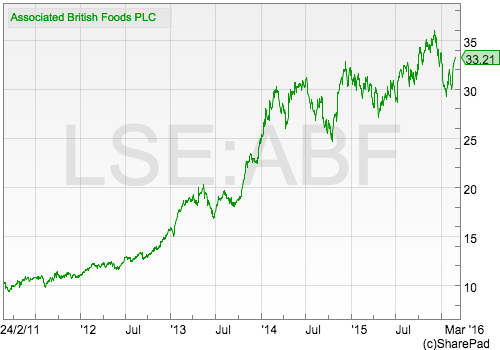
If you've been a long-term holder of the shares of AB Foods (ABF) then you will have plenty to smile about. The shares have more than trebled in value during the last five years. However, the last couple of years have been more of a rocky ride. The shares have been quite volatile and have struggled to make much progress.
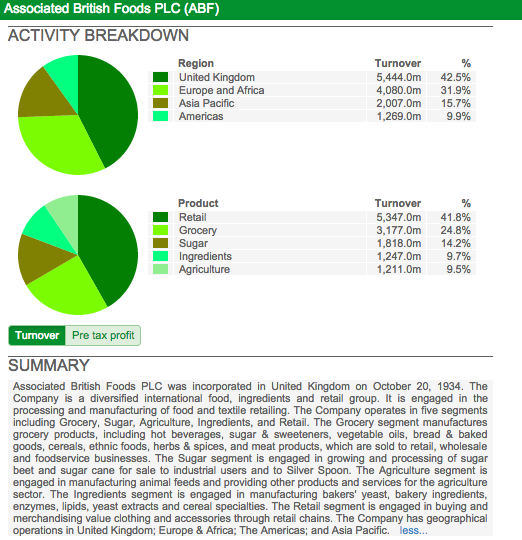
AB Foods contains a mixture of businesses. Primark, its chain of clothing shops, is the pick of the bunch. The company also owns some of the best known food brands that you will see on the shelves of your local supermarket - brands such as Twinings tea, Kingsmill bread, Ryvita, Jordans Cereals and Mazola cooking oils. It is also a big player in the world's sugar markets as well as selling animal feeds and food ingredients.
The breakdown of its turnover is shown in the screenshot form SharePad below. You can see from it that AB Foods gets more than half of its turnover from overseas.
As usual, I am going to use SharePad to see if I can understand why AB Foods' shares have performed so well over the long term and why they have been less stellar recently.
Want to learn how to analyse shares like a professional? Download our FREE guide.
Sign-up to our mailing list to receive a PDF of our Step-by-Step Guide to Investing.
Share this article with your friends and colleagues:
Financial Returns
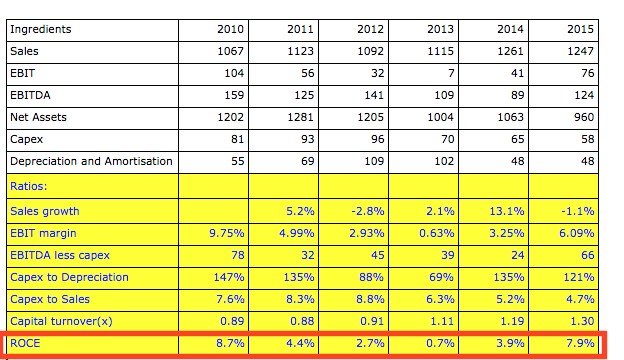
First, let's have a look at what's been happening to the company's profits.

What we can see is quite an interesting picture. From 2004 to 2010 the company struggled to grow its trading profits (EBIT). There was then a period of growth until 2013 and then a slight decline. This is not the kind of profit chart that I would expect given the stellar performance of the company's shares.
What about returns on investment?
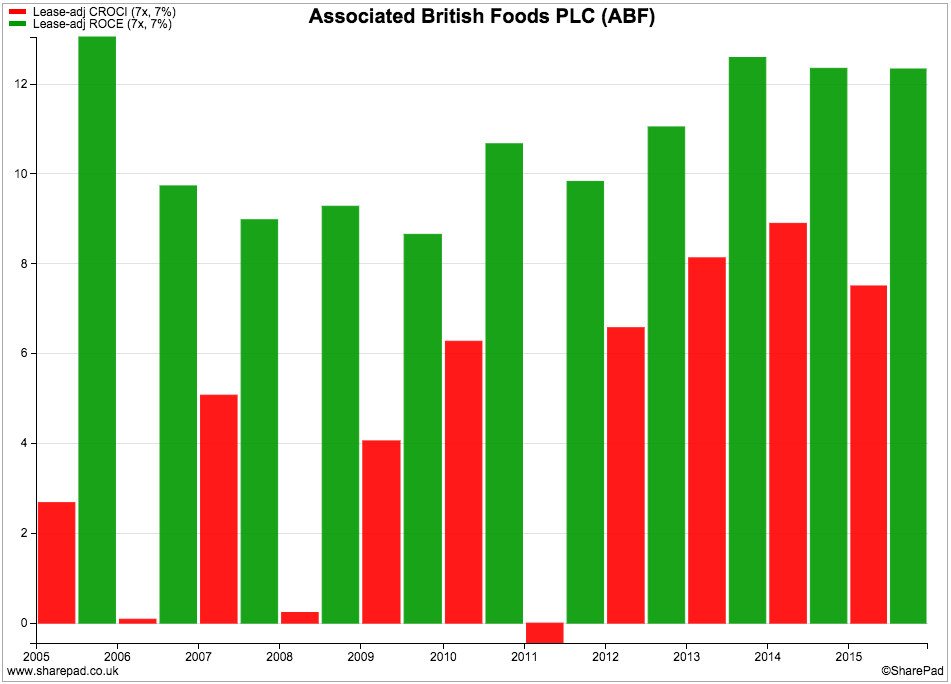
Return on capital employed (ROCE) on a lease-adjusted basis (the green bars) was just over 12% in 2015 - slightly lower than it was ten years ago. ROCE was trending downwards between 2005 and 2010 and has moved up again. Like the trend in EBIT it has declined slightly during the last couple of years.
12% is a respectable figure for ROCE but one that would suggest a solid rather than an outstanding company. Very good companies consistently generate ROCE of 15-20% or more.
CROCI (Cash return on capital invested) tells us the returns in terms of cash (rather than paper profit) - displayed here as red bars. Cash returns have been quite lumpy in the past and sometimes negative when spending on investment has been high. It did start to improve in 2012 but tailed off again in 2015. A consistent CROCI of more than 10% is my benchmark criteria for a good returns. AB Foods falls short here.
It is possible to drill down further and look at how a company's ROCE or CROCI is achieved. That's because of the following relationship:
ROCE (or CROCI) = profit (or cash flow) margins x capital turnover
A company's financial returns can rise and fall depending on its profit margins or its capital turnover.
Capital turnover is sales as a proportion of its capital employed. It's easier to think of it as the value of sales generated per £1 of capital (or assets) employed.
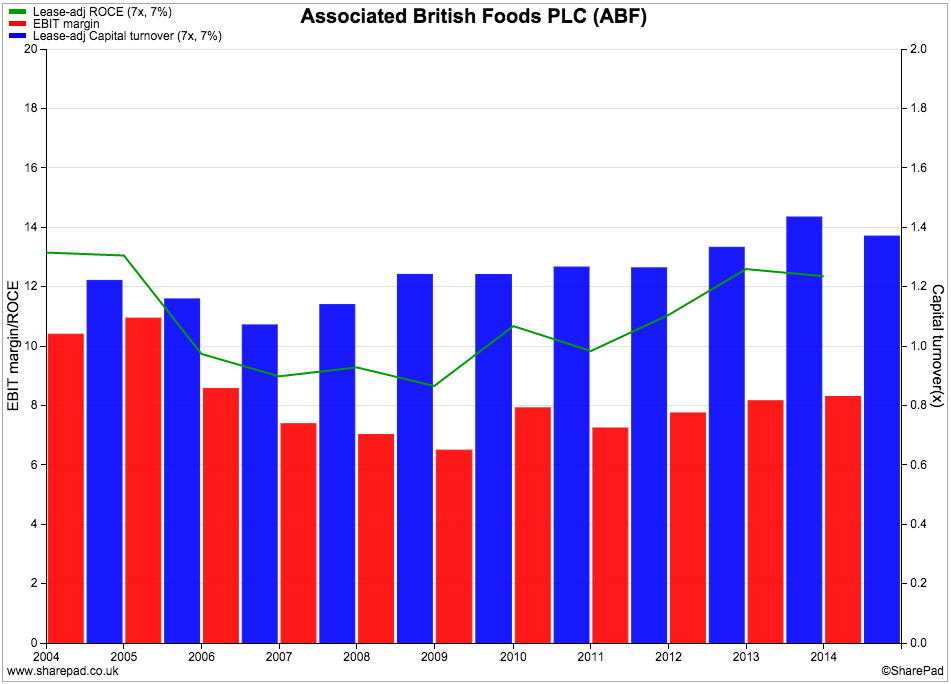
Let's look at ROCE first.
As we saw earlier, AB Food's ROCE hasn't really changed much for the last ten years after falling and then going up again. Profit margins are actually still lower than ten years ago falling - from over 10% to just over 8%. Capital turnover has improved from around £1.20 per £1 of capital employed to just under £1.40.
ABF's CROCI has improved as free cash flow margins and capital turnover have both increased.
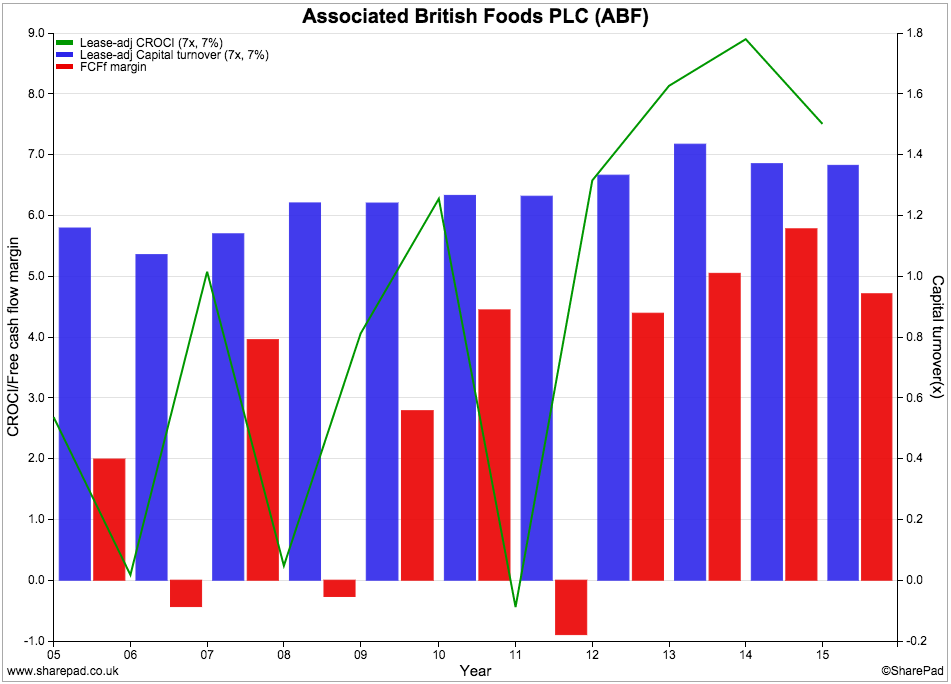
If ABF can improve its profit margins then both ROCE and CROCI have scope to increase. More on how this might happen in a short while.
If you want to get a good idea of what's going on with most companies, it pays to study their cash flow statement.
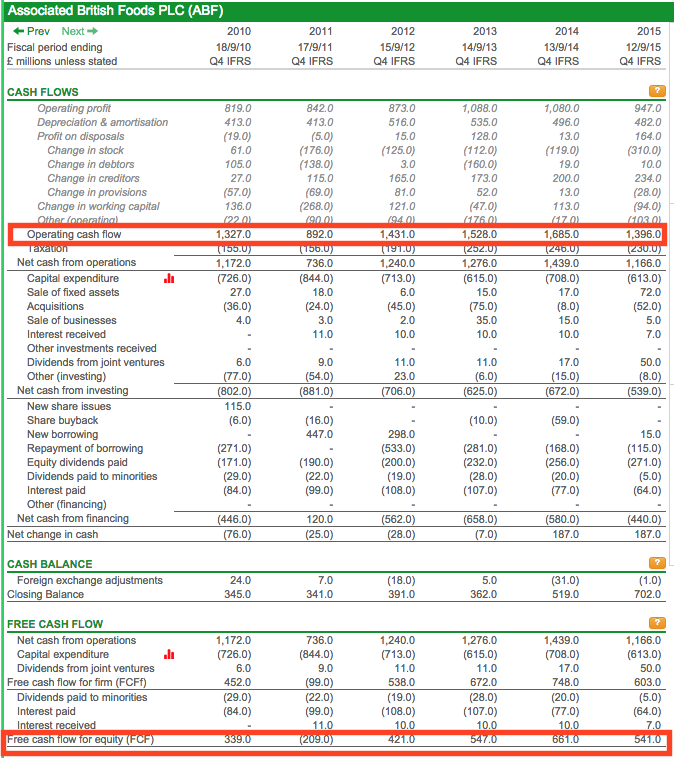
Here we can see that, as with profits, ABF's cash flow performance has stagnated in recent years. Look at the first section I have highlighted in red. Operating cash flow - the cash flowing into the company from selling stuff - was growing nicely between 2011 and 2014 but saw a sharp fall in 2015.
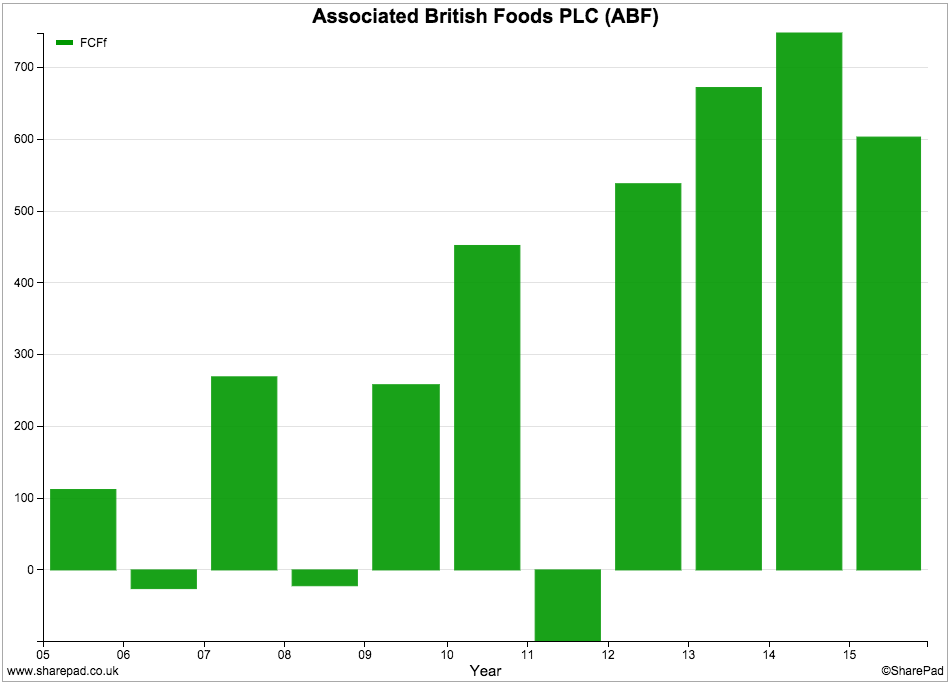
In the second highlighted section you can see that free cash flow performance has been slightly better. Capital expenditure (spending on new assets) has fallen quite sharply from nearly £850m in 2011 to just over £600m in 2015. This didn't stop free cash flow falling in 2015 but as you can see from the chart below, ABF is a much better free cash flow performer than it was five years ago.
If there's one theme that seems to be developing here it is that ABF's cash flow performance is much improved on a number of fronts. In the chart below you can see that during the last four years it has been much better at converting its earnings per share (red bars) into free cash flow per share (green bars).
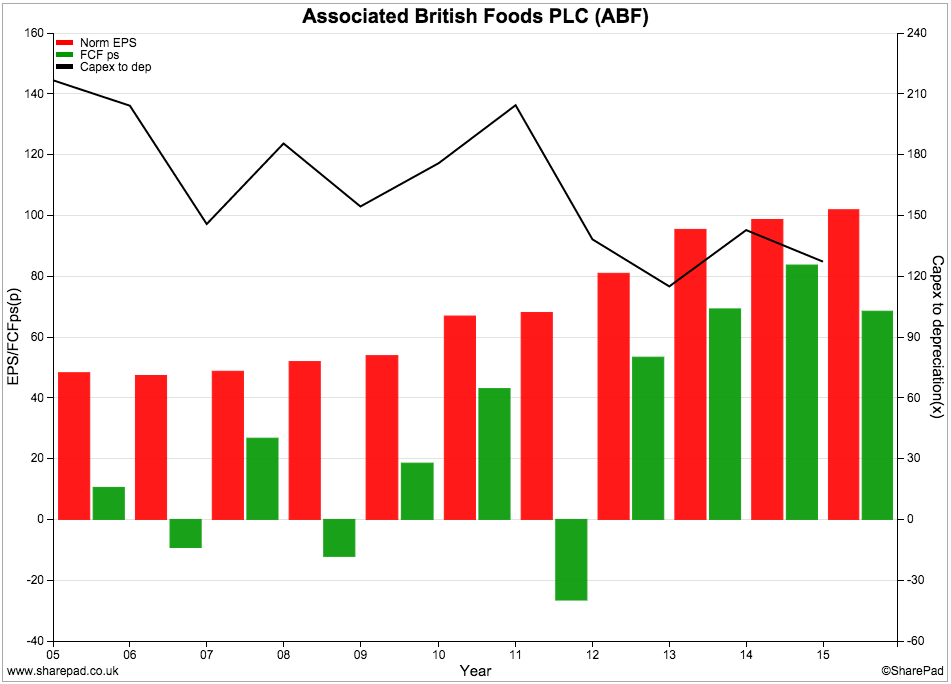
The black line also highlights the sharp fall in capital expenditure as the main driver of improved free cash flow. Not so long ago, ABF was spending more than twice its depreciation charge on new assets compared with around 120% in 2015. We'll see why when we look at the company's individual businesses shortly.
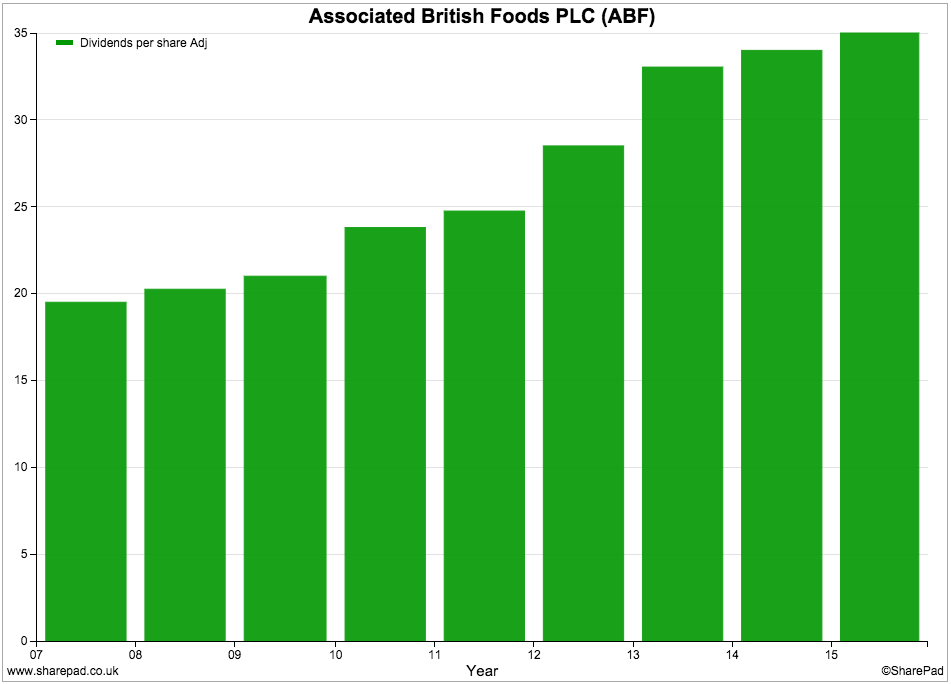
ABF's cash flow has allowed it to pay a rising dividend to its shareholders. That said, dividend growth was only 3% last year. Sometimes a low rate of dividend growth can be a warning that the outlook for a company's future profits growth is not too rosy. I'm not sure that's the case with ABF though.
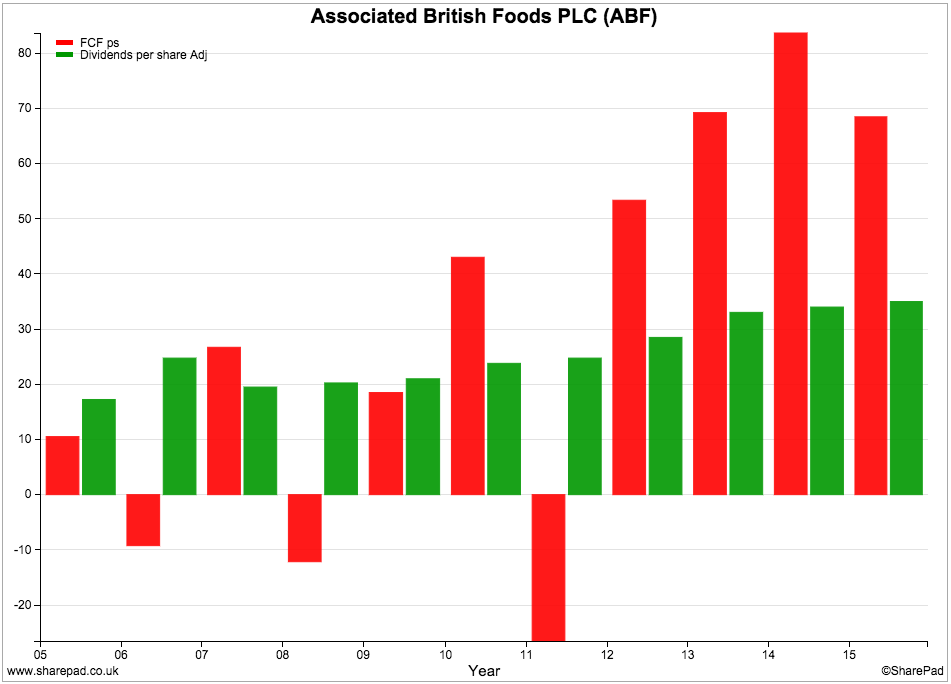
If you look at the chart below, you can see that the company's free cash flow per share (red bars) has been significantly more than its dividend per share in recent years. ABF could probably pay a much bigger dividend if it wanted to but has chosen to use its cash flow elsewhere.
Financial position
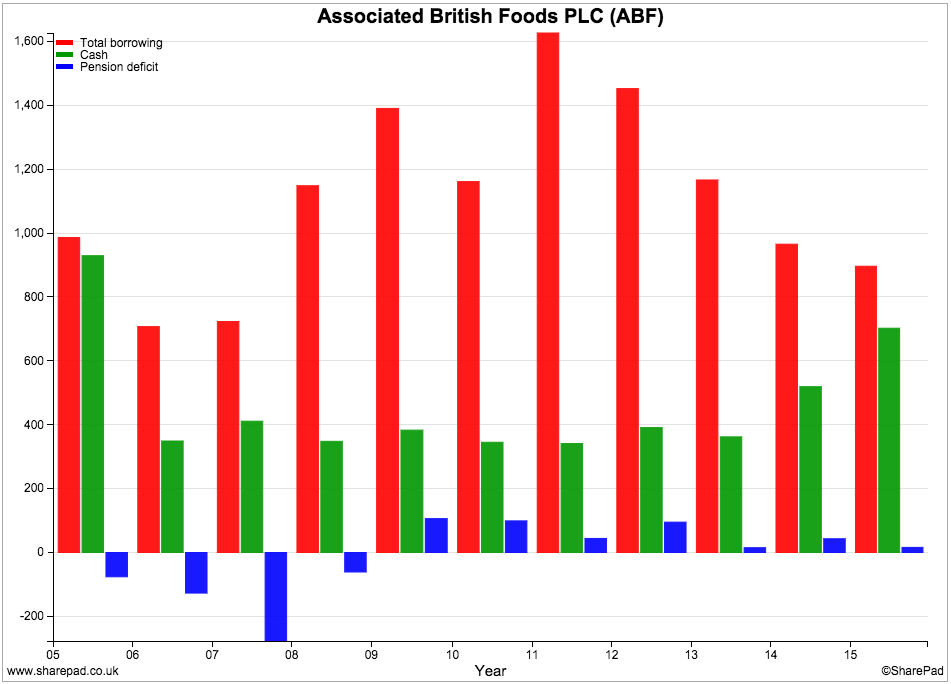
ABF has been using its free cash flow to pay off its debt. Total borrowings (red bars) were over £1.6bn in 2011 but have almost halved during the last four years. They have come down significantly again in the first half of its 2016 financial year as the company said in its trading update on 22nd February 2016:
"Net debt is expected to be some GBP0.4bn, substantially lower than at the same time last year reflecting good cash management in this year's first half and strong cash generation in the second half of last year."
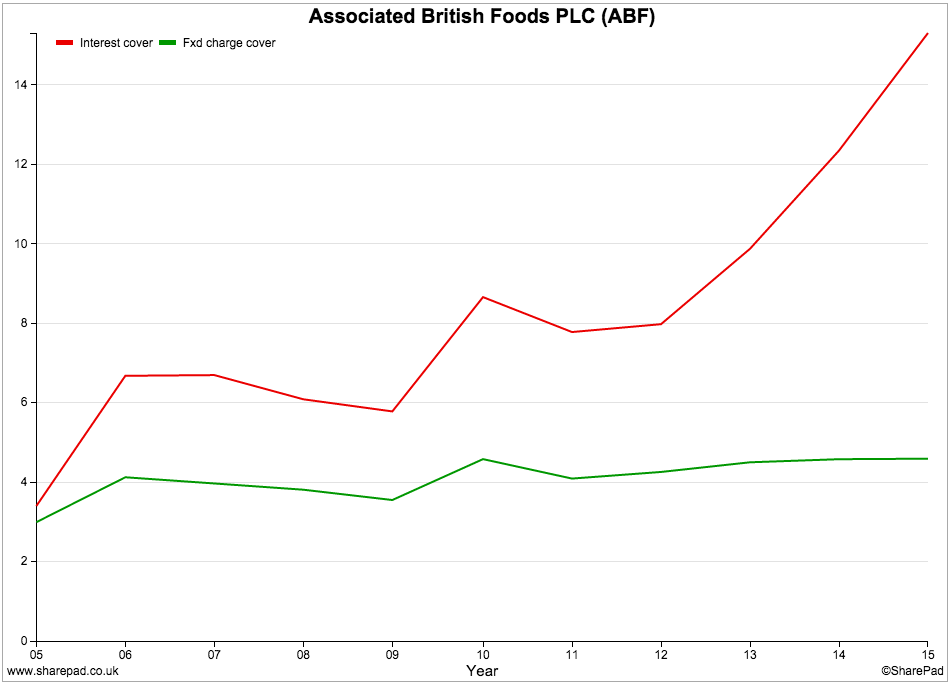
As a result, ABF's finances are in rude health. Fixed charge cover (how many times profits can pay rents and interest on borrowings) is over 4 times which is very comfortable. Interest cover is very high and is a good sign of financial strength. Both these ratios look likely to improve as debt levels continue to come down.
Primark is the jewel in the crown
Primark is by far ABF's best business. It has been a great hit with customers - offering good clothes at very cheap prices. Sales have almost doubled since 2010 as ABF has opened up lots of new shops in Europe and recently the USA.
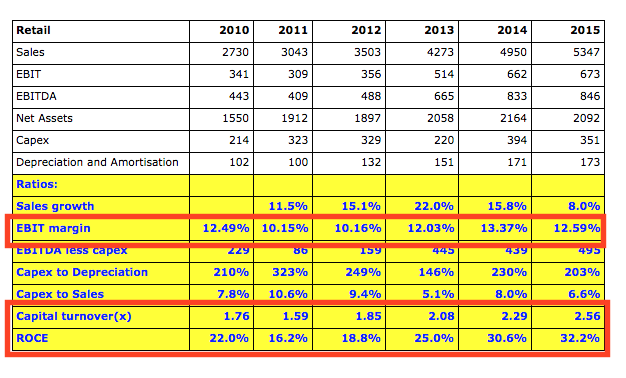
The financial performance of this business has been excellent. Profit margins are good, despite falling slightly in 2015. Capital turnover has also been rising which is a very good sign. ROCE is a very healthy 32%. However, some caution is needed here. Primark rents a lot of its shops which means that its assets are understated. I would expect the rent/lease-adjusted ROCE to be a lot lower.
Primark's success can be explained by a combination of factors. It has been good at getting more sales out of its existing shops most years and has boosted this with opening lots of new shops. When this is combined with a big focus on costs (it doesn't advertise for example) and efficient working practices the result has been a big growth in profits.
But can the good times keep on rolling?
The chart below shows two very important measure of a retail business.

Like-for-like (LFL) sales show the change in sales from shops open more than a year. As you can see LFL sales growth slowed dramatically in 2015. This might be a temporary blip due to the weather and issues in certain countries or it can be sign that the business could be running out of steam.
LFL sales figures also need to be treated with caution due to something known as the maturation effect. Often when a shop opens it will take more than a year to reach its potential sales levels. During the first year it is not included in a LFL sales calculation but it will be in year two when sales are still building up.
This can give a nice boost to LFL sales if a company is opening lots of new shops for a sustained period of time. When the number of new shops relative to the total number of shops starts slowing down then LFL sales can grind to a halt because there are now lots of mature shops.
I've no idea if this is happening at Primark but another measure - sales per square foot - has not made much progress either. Time will tell.
Grocery
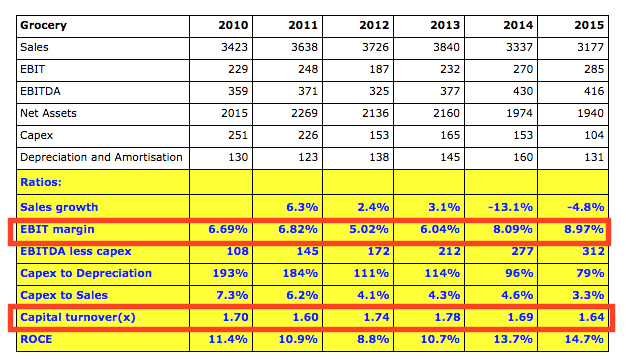
The Grocery business has made steady progress on the back of dependable brands such as Twinings tea. The falling price of food is a challenge though - UK bread prices are at an 8 year low - and this makes it hard for ABF to grow its sales. Profit margins have ticked up nicely in recent years and have been helped by improvements at George Weston Foods in Australia.
Sugar profits have collapsed
If you want to know the reason why ABF's profits have stagnated in recent years then look no further than its sugar division.
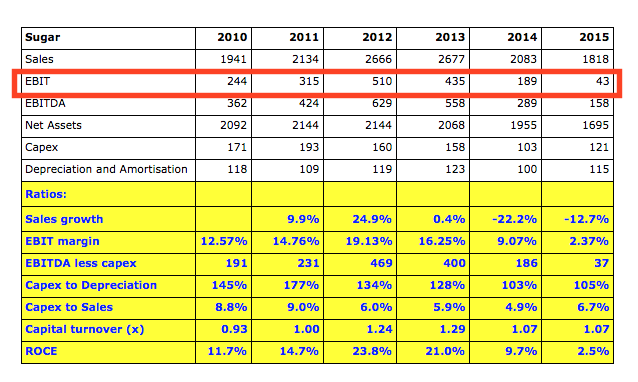
Profits have fallen from £510m in 2012 to just £43m in 2015. World sugar prices have collapsed as there is too much sugar on the market. Despite slashing costs, ABF has not been able to prevent the damage done by falling prices.
The future of this business is hard to predict. Stock levels in China and Europe have fallen slightly recently but with production quotas and minimum sugar beet prices ending in 2017 this market looks like it could be very rocky for some time to come.
Agriculture
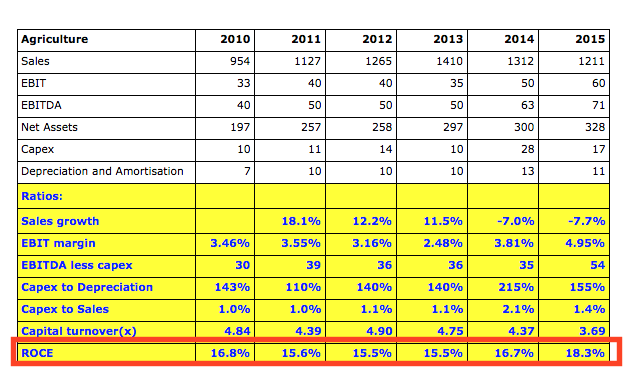
This is a solid business earning a respectable ROCE, although profit margins are low. Its animal feed ingredients business is doing well as is its business in China. Falling commodity prices are feeding through to lower sales however.
Ingredients
Like the Agriculture business, Food Ingredients are unlikely to make a big difference to ABF's overall profits. Profits have recovered in recent years but ROCE remains very modest.
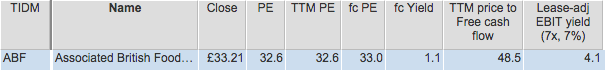
Valuation and future prospects
ABF shares look very expensive. They trade on a very high multiple of earnings (PE) and free cash flow (Price to FCF) and offer low EBIT and dividend yields. At the same time, profits are not expected to grow much, if at all, in 2016.
So how can ABF command such a high stock market valuation?
There's no doubt that Primark could be a very valuable business and that ABF has some attractive grocery brands. A turnaround in the sugar business could see a big jump in profits but that is not expected any time soon.
Shares with high valuations need high rates of profit growth to justify them in the long run. ABF looks as if it might have a tough job on its hands given the slowdown at Primark. There is always a possibility that someone will come along and pay a very high price for Primark.
Summary
- ABF's profits have stagnated in recent years due to the collapse in profits in its Sugar business.
- ROCE and CROCI are modest.
- Free cash flow performance has been improving.
- Spare cash has been used to reduce debts rather than pay bigger dividends.
- Its financial position is very strong.
- Primark is by far ABF's best business but growth looks to be slowing down.
- The Grocery business is making steady progress.
- Sugar profits are hard to predict; a recovery could be a long way off.
- The shares have very high valuations attached to them.
If you have found this article of interest, please feel free to share it with your friends and colleagues:
We welcome suggestions for future articles - please email me at analysis@sharescope.co.uk. You can also follow me on Twitter @PhilJOakley. If you'd like to know when a new article or chapter for the Step-by-Step Guide is published, send us your email address using the form at the top of the page. You don't need to be a subscriber.
This article is for educational purposes only. It is not a recommendation to buy or sell shares or other investments. Do your own research before buying or selling any investment or seek professional financial advice.

