The risks of owning expensive shares in a bear market
Benjamin Graham is one of the most admired investors of all time. His book, The Intelligent Investor, is a must read for all serious private investors. Many of the words of wisdom contained in this book are as relevant today as when the book was first published in 1949.
One of Graham's most famous quotes is that in the short run the stock market is a voting machine but in the long run it is a weighing machine. Put simply, the short-term movements in share prices are driven by the forces of greed and fear. In the long run it is the company's profits and cash flows that will win out.
In recent days we have witnessed real fear in the world's stock markets. Concerns about the growth prospects of the world economy and whether some big banks might be in trouble have seen almost panic levels of selling. The voting machine is back in business in a big way.
I've no idea what the future will bring. However, what has been very clear in recent days is that what the market can give to investors with a sharp rise in a share price can be taken away very quickly when prices fall. Investors have switched their attentions away from thinking about how much money a share might make them and are now worrying about how much money they could potentially lose.
Since the bottom of the last bear market in March 2009, shares have been seen by many as a one-way bet. Non-existent rates of interest on bank accounts and bonds have seen huge amounts of money pour into the stock market. Many shares have given fabulous gains to people and seen their valuations soar to levels which now make them look very expensive using lots of different yardsticks.
Are the shares still too highly-priced? Could more pain be on the way?
Want to learn how to analyse shares like a professional? Download our FREE guide.
Sign-up to our mailing list to receive a PDF of our Step-by-Step Guide to Investing.
Share this article with your friends and colleagues:
Share prices and the total return from owning shares
It's always a good idea to keep reminding yourself that there are only two ways that you can make money from shares. The share price can go up and you can receive dividends from the company. That's it.
Share price growth is driven by changes in company profits and the valuation the stock market puts on those profits such as a PE ratio. One of the big dangers that face investors is when share price changes are mainly driven by changes to the PE ratio which then leads to that PE ratio becoming too high. By this I mean that it cannot be justified by its likely future profits (the weighing machine bit that Ben Graham was going on about).
High PE ratios tell you that people are expecting strong profits growth in the future. This is what can make buying and owning shares with high PE ratios very risky. If the expected growth in profits never happens or enough people think that they won't happen then sentiment towards shares can change very quickly and the PE can go a lot lower leaving investors with heavy losses. This is known in professional investing circles as PE multiple compression and is arguably a major risk facing some shares today.
Some expensive looking shares in the FTSE 350 index
Despite some big recent share price falls, there are still plenty of shares out there trading on very high valuations as measured by PE ratios. A list of some of them taken from SharePad is shown in the table below.
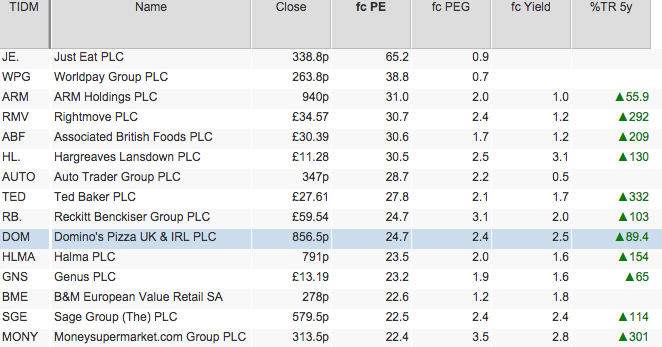
Prices on 9th February 2016
The table shows the forecast PE ratios, the forecast price earnings growth (PEG) ratio and forecast dividend yield. The final column shows the total returns (change in share price plus dividends received) from the shares during the last five years.
As you can see, there are some very punchy PE ratios in this list. Some of the shares such as Rightmove, Moneysupermarket.com and Ted Baker have delivered stellar returns to their shareholders over the last five years.
When you own or are looking to buy shares like these you need to think very carefully about them. The high PE ratio is telling you that expectations for future growth are high. Buying shares with high PE ratios is like paying for something in advance. You then have to hope that you get what you paid for.
But how do you know whether those expectations are too high? It is possible to make money from buying shares with high valuations as long as big profit increases keep rolling in and people think they will keep on doing so. This is the essence of momentum investing but momentum can move down as well as up.
The truth is that you don't know. However, there are a number of safety checks that you can do very quickly in SharePad to see if you are potentially playing with fire.
One inescapable truth of investing in shares is that the price that you pay for them has a big say in how much money you ultimately make during your ownership. Paying too much is how most investors lose money.
They get sucked in by the past performance of the company and its share price and believe that the shares are a buy at any price. History is littered with so many examples of how this ends badly. The late 1990s dot-com boom is probably the best and most recent one.
Before you buy any share, you should spend a lot of time thinking about its valuation and studying it closely. Fortunately, services like SharePad and ShareScope make this a lot easier than it would otherwise be.
There are lots of different ways to value a company but in this article I'm just going to give you a few quick and simple things to consider when you come across shares with high valuations. You can then decide whether you want to do any more research.
PEG ratios
Jim Slater first introduced us to the world of the PEG ratio. Here the PE ratio of the share is divided by the growth rate of a company's earnings per share (EPS). Slater reasoned that if you can buy shares where the PE ratio is less than the EPS growth rate - a PEG of less than one - then the shares were attractively priced. Slater himself used to try and buy shares with a PEG of 0.66 or less.
If we return to our list of high PE shares above then you will also see a column added from SharePad for the forecast PEG (fc PEG). This takes the forecast PE ratio and divides it by the forecast EPS growth from City analysts. You will see that most of the shares have PEG ratios of more than 1 and some a lot more than that indicating that they are not bargains on this measure.
PEG ratios can be useful but you need to use them with care. Do you believe analysts' EPS forecasts? I used to be a professional analyst in the City and can tell you that forecasting is very difficult.
Many companies themselves don't really know how much money they will make in the future. They will have a plan and a budget but don't know when the next recession is coming or when a new competitor will show up.
Therefore trying to justify a share's high PE based on forecast EPS growth still doesn't get you away from the risk of losing money from buying and owning these shares. You might get lucky if the good times keep rolling but you will be cruelly exposed to big losses if they don't.
Dividend yields
Dividends are the other part of your return from owning a share. It is not surprising that shares with high PEs will also have low dividend yields as well - because the share price is high in relation to the dividend paid.
The great thing about dividends is that they cannot be taken away from you once they have paid. Whereas a share price gain can disappear in an instant. Dividends can ease some of the pain if share prices fall. If a company is paying a reasonable dividend and can grow it then long-term investors might still have a satisfactory result from the shares.
Returning to our list, it is difficult to make such an argument for many of the shares. Hargreaves Lansdown has a reasonable yield of 3.1% but is paying out most of its profits to achieve that. Other richly valued companies such as WorldPay and Just Eat aren't expected to pay a dividend at all. Investors are completely reliant on further share price gains to make money. Will profits keep growing? Will the PE ratio stay high?
Studying valuation history - changes in PE from bull market top to bear market bottom
As well as looking at a company's current valuation, it is always a good idea to look at its valuation history. Ask yourself whether a share looks cheap or expensive compared with its historical levels.
| Company | Share price 6/3/09 | Trailing EPS then | Trailing PE then | fc PE |
|---|---|---|---|---|
| Associated British Foods PLC | 621.5 | 51.9 | 12 | 30.7 |
| Hargreaves Lansdown PLC | 202 | 9 | 22.4 | 30.5 |
| ARM Holdings PLC | 90 | 3.5 | 25.7 | 30.4 |
| Rightmove PLC | 225 | 22.3 | 10.1 | 30 |
| Ted Baker PLC | 314.5 | 34.1 | 9.2 | 28.6 |
| Reckitt Benckiser Group PLC | 25.07 | 1.595 | 15.7 | 24.9 |
| Domino's Pizza UK & IRL PLC | 201.75 | 11 | 18.3 | 24.5 |
| Genus PLC | 562.5 | 33.6 | 16.7 | 24.3 |
| Halma PLC | 149.25 | 12.7 | 11.8 | 23.5 |
| Sage Group (The) PLC | 177.1 | 13.3 | 13.3 | 22.3 |
This is a task that SharePad excels at. SharePad has financial data and daily share prices going back over twenty years for companies that have been around that long. This means that you can do very detailed studies of a share's valuation history.
What I've done in the table above is to calculate the trailing PE ratio (share price divided by last reported annual normalised EPS) at the top of the last bull market in 2007 and the bottom of the last bear market back in March 2009. The PEs can be compared with each other and the current forecast PE. By doing this I can gauge how much valuations have changed.
Let's start with the top of the last bull market.
Top of Bull Market June 2007
| Company | Share price 15/06/2007 | Trailing EPS then | Trailing PE then | fc PE |
|---|---|---|---|---|
| Associated British Foods PLC | 943.5 | 47.3 | 19.9 | 30.6 |
| Hargreaves Lansdown PLC | 203 | 10 | 20.3 | 30.5 |
| ARM Holdings PLC | 146 | 3 | 48.7 | 31 |
| Rightmove PLC | 609 | 8.2 | 74.3 | 30.7 |
| Ted Baker PLC | 546.5 | 33.8 | 16.2 | 27.8 |
| Reckitt Benckiser Group PLC | 27.91 | 1.129 | 24.7 | 24.7 |
| Domino's Pizza UK & IRL PLC | 280 | 6 | 46.7 | 24.7 |
| Genus PLC | 705 | 19.2 | 36.7 | 23.2 |
| Halma PLC | 232.75 | 11.6 | 20.1 | 23.5 |
| Sage Group (The) PLC | 263.25 | 12.2 | 21.6 | 22.5 |
The same shares with high PE ratios today had high - sometimes very high - PE ratios at the top of the last bull market in 2007.
AB Foods, Hargreaves Lansdown, Ted Baker, Halma and Sage Group have higher forecast PEs in February 2016 than they had at the top of the last bull market. ARM, Rightmove, Genus and Domino's Pizza are less richly valued.
Now look at what happened from June 2007 to March 2009 in the table below.
Bottom of Bear Market March 2009
| Company | Share price 06/03/2009 | Trailing EPS then | Trailing PE then | fc PE |
|---|---|---|---|---|
| Associated British Foods PLC | 621.5 | 51.9 | 12 | 30.7 |
| Hargreaves Lansdown PLC | 202 | 9 | 22.4 | 30.5 |
| ARM Holdings PLC | 90 | 3.5 | 25.7 | 30.4 |
| Rightmove PLC | 225 | 22.3 | 10.1 | 30 |
| Ted Baker PLC | 314.5 | 34.1 | 9.2 | 28.6 |
| Reckitt Benckiser Group PLC | 25.07 | 1.595 | 15.7 | 24.9 |
| Domino's Pizza UK & IRL PLC | 201.75 | 11 | 18.3 | 24.5 |
| Genus PLC | 562.5 | 33.6 | 16.7 | 24.3 |
| Halma PLC | 149.25 | 12.7 | 11.8 | 23.5 |
| Sage Group (The) PLC | 177.1 | 13.3 | 13.3 | 22.3 |
What is particularly startling is the fall in PE ratios attached to the shares.
| Company | Price change | PE change (pts) | PE change % | EPS change |
|---|---|---|---|---|
| Associated British Foods PLC | -34.13% | -8 | -40.00% | 9.73% |
| Hargreaves Lansdown PLC | -0.49% | 2.1 | 10.60% | -10.00% |
| ARM Holdings PLC | -38.36% | -23 | -47.20% | 16.67% |
| Rightmove PLC | -63.05% | -64.2 | -86.40% | 171.95% |
| Ted Baker PLC | -42.45% | -6.9 | -43.00% | 0.89% |
| Reckitt Benckiser Group PLC | -10.18% | -9 | -36.40% | 41.28% |
| Domino's Pizza UK & IRL PLC | -27.95% | -28.3 | -60.70% | 83.33% |
| Genus PLC | -20.21% | -20 | -54.40% | 75.00% |
| Halma PLC | -35.88% | -8.3 | -41.40% | 9.48% |
| Sage Group (The) PLC | -32.73% | -8.3 | -38.30% | 9.02% |
All the companies except Hargreaves Lansdown grew their EPS between the top and bottom of the market ranges. Despite growing profits, the damage to their share prices came though the significant reduction in the PE ratio attached to them. This is what PE multiple compression can do to highly priced shares.
However, with the exception of Rightmove, all the shares listed above fell by less than the 48.6% fall in the FTSE All Share index over the same period. Could this indicate that growth companies with high PEs are more resilient?
I am not too sure about this. It is worth remembering that the All Share Index back in 2007 was heavily weighted towards the valuations of banks and financial companies that were hammered by an unprecedented financial crisis. The losses seen by high PE companies in an absolute sense were still very bruising.
That said, the fact that many of the companies had grown their profits limited the damage to their share prices. The real carnage occurs when you get a fall in earnings and PE ratio at the same time. If that happens, you can end up with eye-watering losses.
Since the dark days of 2009 there has been a big recovery in share prices. This has been accompanied by large increases in the PE ratios as well. Associated British Foods, Ted Baker and Rightmove stand out here. Expensive shares such as Hargreaves Lansdown ARM Holdings have just become more expensive.
Are these kind of increases really justified? One way to try and answer this question is to do a quick check on how these businesses have performed since then.
Business performance since 2009
| Company | CROCI then | CROCI now | EPS then | EPS then | EPS growth |
|---|---|---|---|---|---|
| Associated British Foods PLC | 0.20% | 7.50% | 51.9 | 101.9 | 96.34% |
| Hargreaves Lansdown PLC | 53.50% | 66.90% | 9 | 34.5 | 283.33% |
| ARM Holdings PLC | 12.10% | 19.10% | 3.5 | 22.7 | 548.57% |
| Rightmove PLC | 95.00% | 679.10% | 22.3 | 105 | 370.85% |
| Ted Baker PLC | 4.10% | 5.80% | 34.1 | 87.2 | 155.72% |
| Reckitt Benckiser Group PLC | 21.30% | 20.30% | 159.5 | 216.8 | 35.92% |
| Domino's Pizza UK & IRL PLC | 11.50% | 26.30% | 11 | 29.1 | 164.55% |
| Genus PLC | 3.90% | 4.80% | 33.6 | 75.3 | 124.11% |
| Halma PLC | 11.80% | 13.60% | 12.7 | 27.7 | 118.11% |
| Sage Group (The) PLC | 13.20% | 20.00% | 13.3 | 24 | 80.45% |
CROCI is adjusted for leases (7x rental expense and 7% interest rate assumed)
Two quick checks of business performance you can look at are the change in the cash flow returns on capital invested (CROCI) and the growth in EPS.
All but one of the companies has seen an improvement in CROCI. There have also been some stellar increases in EPS. For many of these companies, the reasonably high rates of CROCI indicate that they are very good businesses (above 20% is very good).
So throw together high quality businesses producing strong growth in profits and it is not unreasonable to expect the share price and PE ratio to be higher than they were at the bottom of a bear market - providing they weren't already high in the first place.
But bear in mind that the stock market is always looking forwards not back into the past. High PE ratios today can only be justified if high rates of profit growth and high CROCIs can continue in the year ahead. Growth is key and that is what a lot of people are worried about at the moment.
The bottom line is that none of us really know whether or not this will happen. The trouble is that the high PE ratios assume it will. This is the risk that investors face from buying and owning shares with high valuations. If the next few years turn out to be less rosy then there will be more pain to come in the stock market.
To sum up
- Remember that shares are priced on expectations of future profits.
- Sentiment drives short term share prices. This means that shares are often undervalued and overvalued compared with their potential future profits and cash flows.
- High valuations can be justified if profits growth stays high.
- High valuations equal high expectations. Disappointment can lead to big losses.
- PEG ratios can help identify cheap growth shares, but basing investment decisions on analysts' forecasts can be risky.
- Dividends can lower the risks of high valuations.
- It pays to study a share's valuation history and a company's past business performance.
If you have found this article of interest, please feel free to share it with your friends and colleagues:
We welcome suggestions for future articles - please email me at analysis@sharescope.co.uk. You can also follow me on Twitter @PhilJOakley. If you'd like to know when a new article or chapter for the Step-by-Step Guide is published, send us your email address using the form at the top of the page. You don't need to be a subscriber.
This article is for educational purposes only. It is not a recommendation to buy or sell shares or other investments. Do your own research before buying or selling any investment or seek professional financial advice.

