Stock Watch: PayPoint
If you've been using ShareScope or SharePad recently to trawl for cheap looking shares then there's a good chance that payment technology company PayPoint (LSE:PAY) might have made it on to your list. The shares look attractive on a number of filters such as dividend yield and Joel Greenblatt's Magic Formula (click here to read more about this strategy).
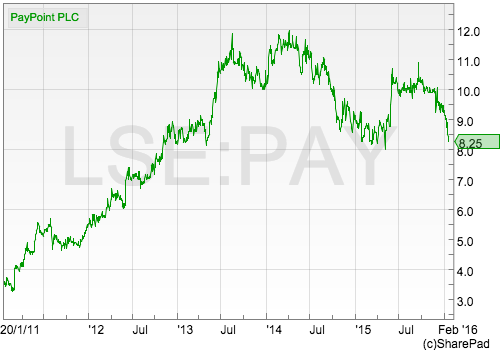
Up until quite recently the company has been well-liked by investors. However, during the last six months the shares have not fared well and have fallen in price a little bit more than the stock market as a whole.
So what's been going on? It's time to open up SharePad and have a look.
Want to learn how to analyse shares like a professional? Download our FREE guide.
Sign-up to our mailing list to receive a PDF of our Step-by-Step Guide to Investing.
Share this article with your friends and colleagues:
A closer look at PayPoint
PayPoint passes a lot of tests which suggest that it has the makings of a good investment.
Above all else, its business is fairly easy to understand. The PayPoint logo is a common sight outside thousands of convenience stores and local shops in the UK and Ireland. It also has a business in Romania.
Inside these shops is a PayPoint terminal which allows customers to do lots of things such as pay utility bills, pay council house rents, buy lottery tickets, top up the credit on a mobile phone and send money to other people. The terminal also helps retailers process debit and credit card transactions. In return, PayPoint gets a small slice of the money spent. When millions of these small slices are added up, PayPoint has been able to build up a very profitable business.
If we have a look at some key financial ratios in SharePad then PayPoint looks as if it is a very good business. I'd go as far to say that PayPoint has many of the desirable characteristics that many investors would love to see from the shares in their portfolios.
The first check I always do when looking at a company is to see what kind of bang it is getting for its buck - its return on capital employed or ROCE. PayPoint passes this test with flying colours.

Like most technology companies, PayPoint doesn't require a huge amount of investment in assets compared to the size of its profits. This means that it is capable of making very high returns on investment. ROCE (the first or green bar) is well over 40% which is excellent. That said, the trend in ROCE has been moving steadily downwards compared with ten years ago but has stabilised in recent years.
Even more important is an ability to generate free cash flow and earn high cash flow returns (for more on the CROCI measure click here). Again PayPoint scores well. Not many companies have a consistent CROCI of over 30%. This is a sign of a very good business indeed.

As well as looking at returns on investment, I also think that it's a good idea to look at profit and cash flow margins (how much turnover gets turned into profits and cash) as well. Companies with high profit margins can withstand a few setbacks in their trading activities a lot better than those with low margins. This makes these types of companies generally safer investments - providing new competition doesn't try to grab a slice of those profits.
Here PayPoint scores well too. Cash flow margins (free cash flow to the firm as a percentage of turnover) are around 14%, whereas profit (EBIT) margins are more than 20%. Both measures have been trending upwards which is an encouraging sign.
Now look at the chart below. PayPoint also converts a very large chunk of its after tax profits (earnings per share) - the first or green bars - into free cash flow (the second or red bars). Investors should generally take comfort when a company's profits turn into free cash flow as it is a sign that the quality of profits is high.

PayPoint's high levels of profitability and free cash flow in recent years have seen it pay out bigger dividends to its shareholders.
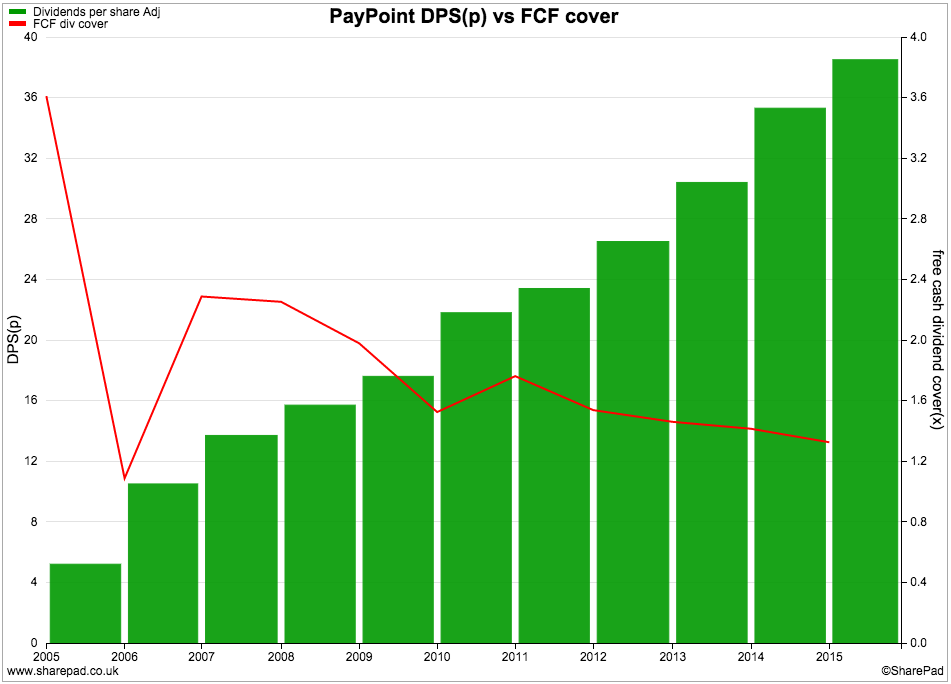
That said, the cost of the dividend is taking up a bigger chunk of the company's free cash flow. Free cash flow dividend cover (free cash flow per share divided by the dividend per share) has been trending down in recent years and needs to be watched closely. The current trailing twelve month (TTM) dividend per share of just over 40p doesn't look under threat just now, but perhaps the rate of growth will slow down.

PayPoint's finances are in very good shape. It has no borrowings, virtually no hidden debt and has net cash balances of over £40m.
So PayPoint is making high returns on capital, has lots of free cash flow and what looks like a squeaky-clean balance sheet. So why are its shares falling and underperforming the stock market?
Can PayPoint grow its profits and cash flows?
It seems that some professional investors and analysts are becoming concerned about PayPoint's ability to keep on growing. Based on the company's finances it would seem that this concern might be justified.
Most people spend their time looking at growth in profits or earnings per share. I find it more useful to look at the trends in a company's cash flow as this approach is often more revealing.
Let's take a look at what's going on with PayPoint's recent cash flow performance.
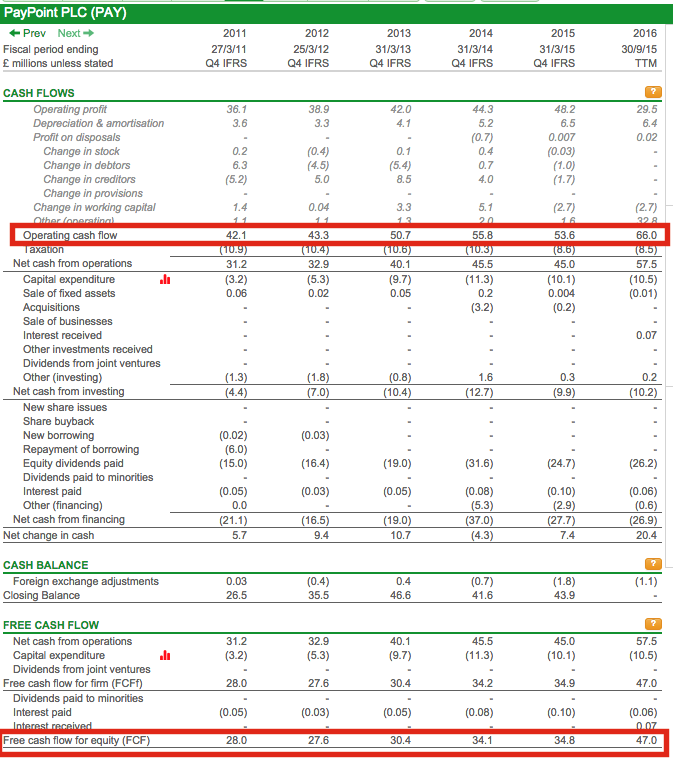
I pay particular attention to a company's operating cash flow - what it is getting from selling its goods and services - and its free cash flow - what's left over for investors.
Operating cash flow and free cash flow barely changed from 2014 to 2015. However, the TTM figures show a big increase in both - around £13m. Surely this is a good thing?
Maybe not. A closer look at PayPoint's half year results, published November 2015 (below), shows that cash flow has been mainly boosted by a reduction in trade creditors (part of something called working capital) not from profits.
Have a look at how PayPoint's trading cash flow came about during the first six months of its current financial year. You can easily do this by looking in the news section in SharePad as shown below.

What you can see is that the company's operating cash flows before changes in working capital have barely budged at £25.4m. But there has been a £14.5m improvement in payables from a £9.3m outflow in 2014 to a £5.3m inflow in 2015. This is welcome but should not be seen as sustainable an improvement in cash flow as one which comes from higher profits. Without it, there is no cash flow growth at PayPoint.
PayPoint doesn't split out its profits between the UK and Romanian businesses in a full segmental profits note in its accounts. However, it does provide an analysis of its revenue in its key business areas. I've had a look at these in more detail and added a ratio of my own (net revenue as a % of transaction value)
Bills & General
| Bills & General (£m) | 2010 | 2011 | 2012 | 2013 | 2014 | 2015 | TTM |
|---|---|---|---|---|---|---|---|
| No. transactions (m) | 339,801 | 350,970 | 383,332 | 432,793 | 445,597 | 459,018 | 461,209 |
| Transaction value (TV) | 5,925,249 | 6,198,171 | 6,757,902 | 7,751,965 | 8,306,601 | 8,485,736 | 8,570,272 |
| Revenue | 58,564 | 57,889 | 64,001 | 79,783 | 85,341 | 89,229 | 88,951 |
| Net revenue | 33,586 | 33,806 | 37,390 | 48,104 | 54,000 | 58,954 | 59,253 |
| Net rev as % of TV | 0.57% | 0.55% | 0.55% | 0.62% | 0.65% | 0.69% | 0.69% |
The Bills & General segment is the biggest part of PayPoint's business. A large chunk of revenue comes from cash payments for gas and electricity prepayment meters. Energy companies are installing more of these which might be good news for PayPoint.
That said, the move to smart meters by 2020 is opening up different ways for prepayment customers to pay their bills in ways other than cash in their local shop. PayPoint has developed a new service to cater for this which seems to be going down well with energy companies.
PayPoint's net revenue - after commissions and other costs are paid to shop owners - is nudging up very slowly in this segment as growth in Romania hasn't been strong enough to offset a sluggish period in the UK. PayPoint has been successful in getting a bigger slice of net revenue from transactions though - probably by paying less commission to retailers.
Top ups
| Top ups (£m) | 2010 | 2011 | 2012 | 2013 | 2014 | 2015 | TTM |
|---|---|---|---|---|---|---|---|
| No. transactions (m) | 128,887 | 117,670 | 125,163 | 118,270 | 97,465 | 89,482 | 85,329 |
| Transaction value (TV) | 1,166,507 | 1,114,809 | 1,071,947 | 1,006,234 | 866,321 | 821,049 | 792,375 |
| Revenue | 108,508 | 98,843 | 94,450 | 80,390 | 73,680 | 69,978 | 66,263 |
| Net revenue | 24,272 | 22,683 | 22,756 | 21,885 | 22,543 | 23,154 | 22,541 |
| Net rev as % of TV | 2.08% | 2.03% | 2.12% | 2.17% | 2.60% | 2.82% | 2.84% |
This business seems to be in decline as the number of transactions made in PayPoint shops continues to fall. Pre-paid mobile phones are being used less by people as mobile phone operators offer cheaper contracts to customers these days. PayPoint seems to be growing its share of net revenue but the absolute level of income coming into the company has gone down.
Retail Services
Retail Services (money transfer, credit and debit card transactions, SIM Cards and parcels) is faring a little better as there is some growth.
| Retail Services (£m) | 2010 | 2011 | 2012 | 2013 | 2014 | 2015 | TTM |
|---|---|---|---|---|---|---|---|
| No. transactions | 38,901 | 48,425 | 60,493 | 73,785 | 92,308 | 118,849 | 130,810 |
| Transaction value (TV) | 377,271 | 394,727 | 426,527 | 522,929 | 667,303 | 874,449 | 986,171 |
| Revenue | 16,168 | 19,602 | 23,659 | 27,707 | 35,883 | 42,294 | 45,112 |
| Net revenue | 8,684 | 10,827 | 13,844 | 16,817 | 22,105 | 26,507 | 28,611 |
| Net rev as % of TV | 2.30% | 2.74% | 3.25% | 3.22% | 3.31% | 3.03% | 2.90% |
Overall though, PayPoint's net revenue growth across its core business is struggling to grow.
The company has tried to capture the growth in internet and mobile payments over the last few years but has not been able to make this business profitable and has decided to sell it.
It has also formed a joint venture with the parcels company Yodel (called Collect +) to exploit the rapid growth in click and collect services from retailers such as Amazon and John Lewis. PayPoint retailers are a convenient local place to collect parcels and return unwanted ones and has grown strongly.
The business is making a small profit but PayPoint's problem is that Yodel wants to charge more money to shift parcels around the country which will lower the profits of Collect +. It is by no means certain that this business will create a lot of extra value for PayPoint's shareholders.
PayPoint is hoping that its new terminal will help retailers with other parts of their business (such as stock control) which in turn will allow it to get more of them on board as customers. That said, PayPoint remains vulnerable to increased competition in payments from services such as Apple Pay and online services. The risk for shareholders is that a new rival product could see its customers go elsewhere.
Perhaps PayPoint will enter another developing market like Romania where cash still accounts for a lot of personal spending transactions. This might provide the company with a source of future profit and cash flow growth.
Are PayPoint shares cheap or expensive?

PayPoint's valuation based on multiples such as PE or Price to Free cash flow don't look overly expensive. The dividend yield of 6% looks tempting but dividend cover is low.
The PEG ratio of 1.9 might be suggesting that the shares are quite expensive - less than 1.0 might be seen as cheap - given the low rates of expected profit growth.
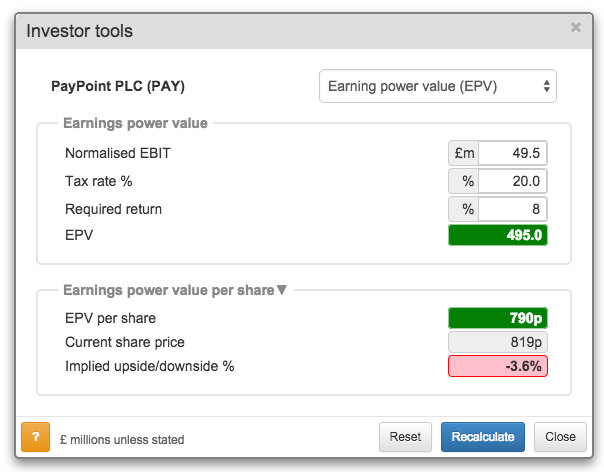
Assuming no future profit growth, PayPoint's earnings power value (based on profits staying the same forever - is suggesting that the shares are worth 790p each which is not too far from the current share price.
To sum up
- PayPoint has many hallmarks of an excellent business.
- It has high ROCE and CROCI.
- Its financial position is very strong.
- It is struggling to grow its sustainable profits and cash flow.
- Growth in Romania is not enough to offset a sluggish performance in the UK.
- The dividend is taking up a larger slice of free cash flow.
- Dividend growth may slow down after 2016.
- The company might be vulnerable to increased competition in payments technology.
- The shares don't look expensive but might not be cheap if profits and cash flow cannot grow.
If you have found this article of interest, please feel free to share it with your friends and colleagues:
We welcome suggestions for future articles - please email me at analysis@sharescope.co.uk. You can also follow me on Twitter @PhilJOakley. If you'd like to know when a new article or chapter for the Step-by-Step Guide is published, send us your email address using the form at the top of the page. You don't need to be a subscriber.
This article is for educational purposes only. It is not a recommendation to buy or sell shares or other investments. Do your own research before buying or selling any investment or seek professional financial advice.

