There's more to SharePad than just shares - Market Overview
We've just added a great new feature to SharePad. It's called the Market Overview and it can be accessed by clicking on the Market button on the Main toolbar. It enables you to group together the data you want to keep an eye on: global indices, commodities, foreign exchange, benchmark bonds and economic data as well as risers and fallers in major indices, portfolios and watchlists. The choice is yours.
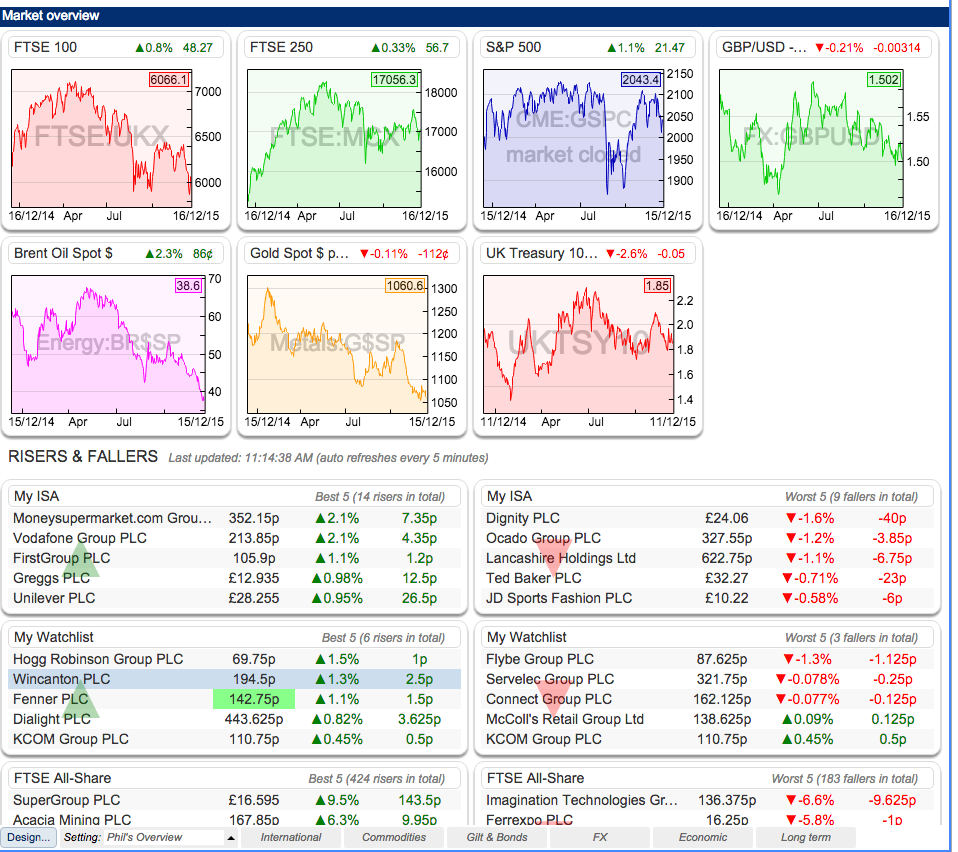
If you are like me and often wonder what's going on in the markets whilst doing some research or checking your portfolio then this page is for you. It will allow you to get a really good overview of what's going on in your investing universe in a matter of seconds rather than having to trawl through lots of data or visit other financial websites. It's all here in SharePad.
SharePad is not just about shares. It is packed full of lots of other useful information on global stock market indices, bonds, commodities, exchange rates and economic data. You have always had all this data in SharePad but now you can create a view with all the data that is important to you in one easily accessible place.
So, no matter what you are doing in SharePad, the price of the FTSE 100, the oil price, the Sterling/Dollar exchange rate, bond yields - or whatever other key items you are interested in - are just a single click away. And a single click will take you back to where you were.
We've provided a number of pre-configured market overviews (called settings) which I've covered below. However, you can customise any of these settings or create your own and I'll cover this later on.
We've added four of the default market overviews to the Settings toolbar at the foot of the market overview and you can access more via the Setting menu:
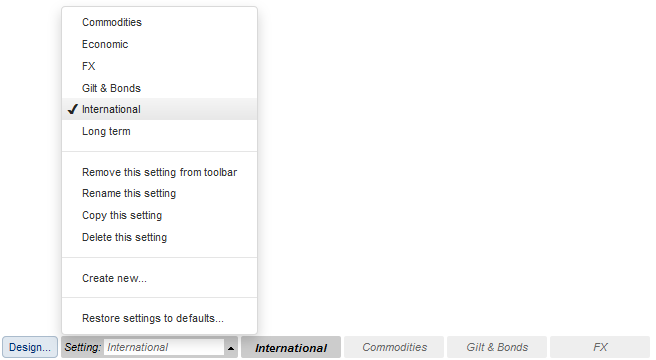
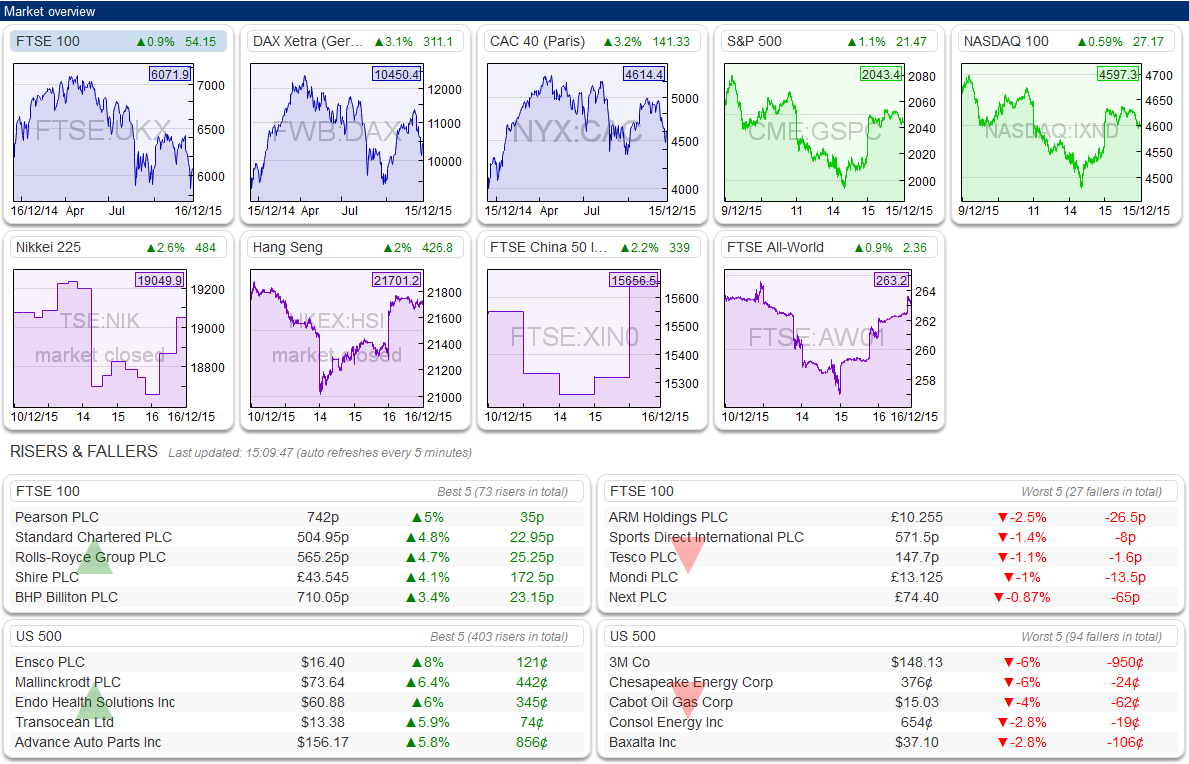
International
This setting provides charts for a number of key global indices and the top risers and fallers in the FTSE 100 and S&P 500.
Commodities
I am just showing you a snapshot here as we have lots of data on commodities.

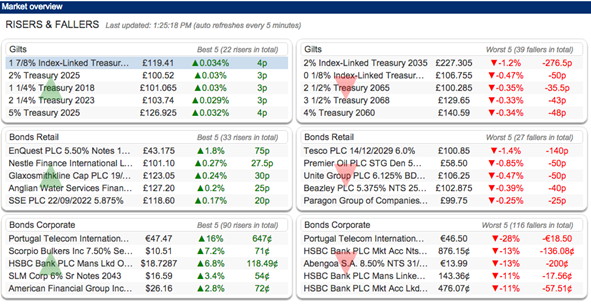
Gilts & Bonds
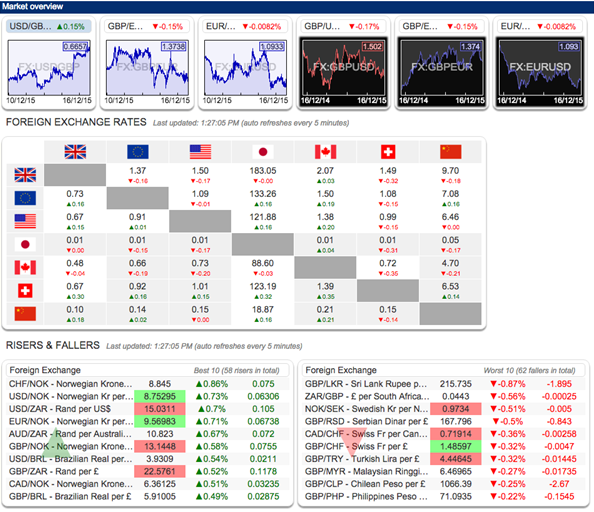
FX (Exchange rates)
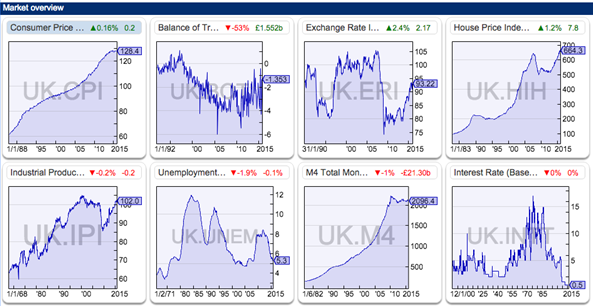
Economic data
This setting provides a wide range of economic data for the UK and other major economies. Here is a snapshot:
Want to learn how to analyse shares like a professional? Download our FREE guide.
Sign-up to our mailing list to receive a PDF of our Step-by-Step Guide to Investing.
Share this article with your friends and colleagues:
How to design your own market overview page
You can customise any of the existing settings or create new ones from scratch.
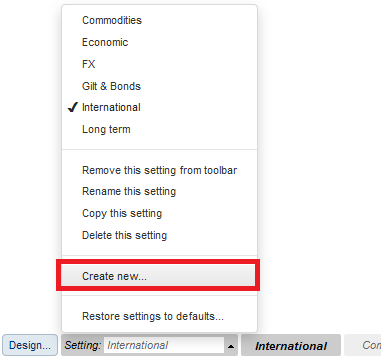
To create a new market overview setting, click on the Setting menu and select Create new:
You'll be asked to enter a name for the new setting and then a blank setting will be loaded.
To customise a new or existing market overview setting, click on the Design button in the bottom left hand corner of the view. You will then see a box that looks something like this:
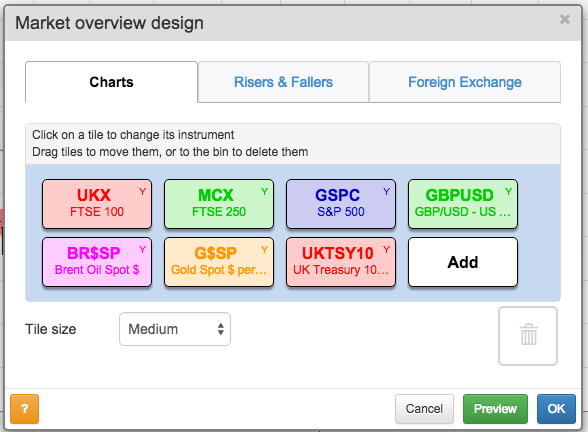
There are tabs for selecting the charts, the risers and fallers, and the foreign exchange rates.
Add new charts by pressing the Add button. I've chosen seven data charts that I am interested in but can add as many as I want. You have masses of data to choose from. If you want to get rid of a chart, just drag the tile to the dustbin icon on the right.
You can also set the tile size to suit the size of your screen.
Once you have chosen a tile you can customise it further. With the FTSE 100 tile - and all other chart tiles - in my overview page, I have the choice of data period I want to see. It can be daily, weekly, monthly, the last year, the last ten years or the entire history we have.
Click on a tile to see the options:
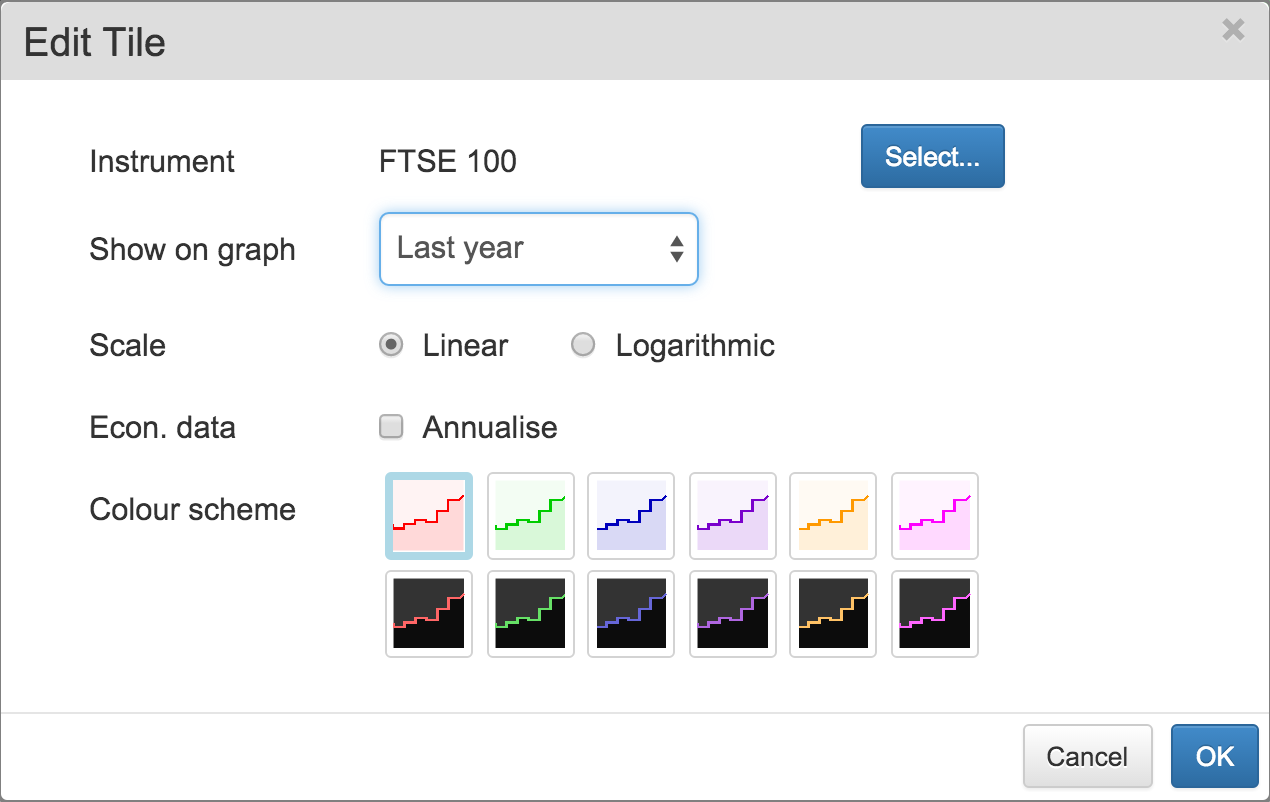
We also give you a choice of colours so you can design your page how you want it to look.
You can then choose which, if any, list you can display risers and fallers for.
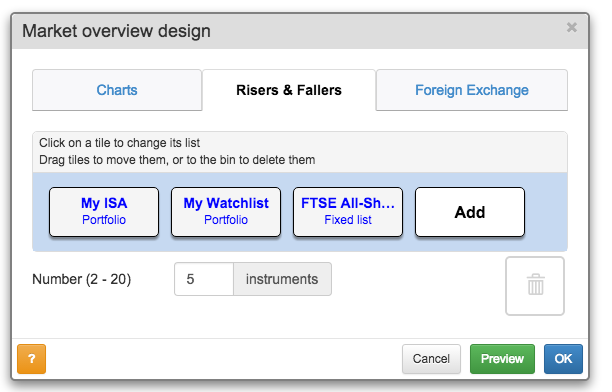
You can choose to show up to the top 20 risers and fallers for any list or portfolio. Here I've chosen to see the top 5 for my portfolio (by the way, this is not my real ISA portfolio), a watchlist of shares and the FTSE-All Share Index. Again, as with the charts above you can choose any data set you want. For example, you might want to see which exchange rates or commodities are rising and falling. Click on a tile to choose the list or portfolio.
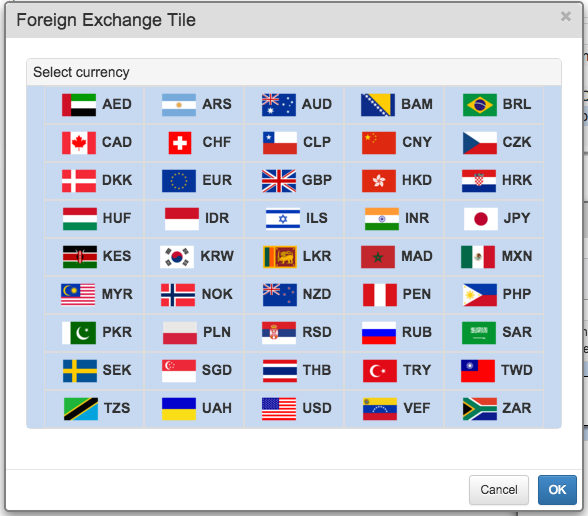
If you are interested in foreign exchange rates you can add these too - in a matrix. There are 45 different currencies to choose from.
Once you have built your market overview, SharePad will save it for you on the Setting menu.
Things you can do with the extra data in SharePad
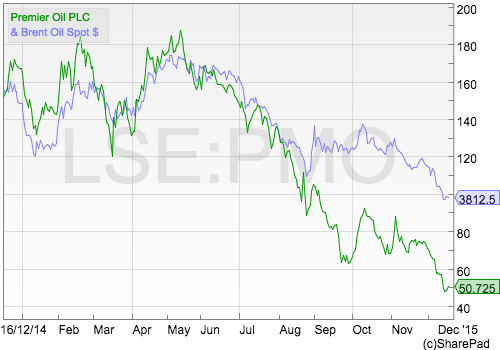
Having all this extra data can help you when you are researching certain types of company. For example, you can draw charts showing the relationship between share prices and commodity prices as I have done with Premier Oil below.
Similarly you could plot a house building company's share price against the UK house price index or a mining company share price against the price of specific commodity. To do this, click the Add menu in the Chart view and select Additional charts.
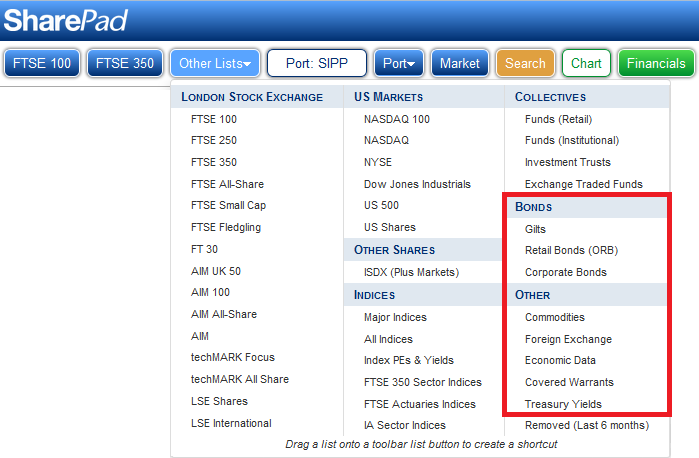
All these data sets are available as fixed lists in SharePad - simply click on the Other lists button on the main toolbar to find them. This way you can view performance data and the full chart history for any instrument.
If you have found this article of interest, please feel free to share it with your friends and colleagues:
We welcome suggestions for future articles - please email me at analysis@sharescope.co.uk. You can also follow me on Twitter @PhilJOakley. If you'd like to know when a new article or chapter for the Step-by-Step Guide is published, send us your email address using the form at the top of the page. You don't need to be a subscriber.
This article is for educational purposes only. It is not a recommendation to buy or sell shares or other investments. Do your own research before buying or selling any investment or seek professional financial advice.

