When cash flow isn't cash flow - when it's called EBITDA
There used to be a time when being an investor seemed to be a very simple affair. The key measure of a company's profitability was its earnings per share (EPS) whilst a yardstick of how cheap or expensive its shares were was the price to earnings (PE) ratio - how many times the latest EPS would go into the current share price.
Things started to change in the 1980s. This was the era when very big companies were bought with huge amounts of debt in a process known as a leveraged buyout or LBO for short. The private equity companies who were doing these LBOs said that most investors were doing the wrong thing looking at EPS and PE ratios. Instead, they said you should be looking at something called EBITDA (pronounced eee-bit-dah).
To them, EBITDA was a better measure of profitability than EPS. Even better still, it was a proxy for a company's cash flow and allowed them to work out how much debt they could use to buy a company before it buckled under the strain.
EBITDA was then championed by Wall Street and the City during the boom in tech shares during the late 1990s and early 2000s. It is still used extensively by companies and stockbrokers today who talk about it in their annual reports and research.
I agree with the private equity firms that EPS and PE ratios have many drawbacks for investors. But EBITDA has just as many if not more.
In this article, I am going to take a closer look at EBITDA, the problems with it, when it is useful and what you should be looking at instead. It's quite an advanced subject - probably more suited to those of you with a reasonable understanding of company finances.
Want to learn how to analyse shares like a professional? Download our FREE guide.
Sign-up to our mailing list to receive a PDF of our Step-by-Step Guide to Investing.
Share this article with your friends and colleagues:
What is EBITDA and why is it popular?
EBITDA is short for earnings before interest, taxation, depreciation and amortisation. It is very straightforward to calculate. You take a company's operating profits or EBIT (which includes profits from joint ventures and investments) and add to it the depreciation and amortisation expense for the year.
You can find this number in the notes to a company's financial statements or disclosed on a cash flow statement. SharePad and ShareScope provide this number for you.
Here are four reasons why stockbrokers and companies talk a lot about EBITDA:
EBITDA makes it easier to compare the profits of different companies
One of the major problems with EPS is that it is very sensitive to different ways of calculating depreciation, whether a company is financed with debt or shareholder's equity, and the rate of tax it pays on profits. EBITDA avoids this problem.
Take a look at the two companies shown in the table below to see what I mean.
| £m | The Supermarket | The Grocer |
|---|---|---|
| Borrowings | 250 | 0 |
| Shareholders' Equity | 250 | 500 |
| Capital employed (money invested) | 500 | 500 |
| Turnover | 500 | 500 |
| Depreciation & Amortisation | -50 | -50 |
| Other operating costs | -400 | -400 |
| EBIT | 50 | 50 |
| Interest @ 10% | -25 | 0 |
| Profit before tax | 25 | 50 |
| Taxation @ 20% | -5 | -10 |
| Profit after tax | 20 | 40 |
The Supermarket and The Grocer are two privately owned food stores in the same town. They have identical assets, turnover and EBIT. The only difference between them is that The Supermarket finances half its assets with a bank loan whereas The Grocer has no borrowings at all.
Yet looking at profits after tax, you could easily be forgiven for thinking that The Grocer is a much better company because it makes twice as much as The Supermarket. You might also think that this would make The Grocer a more valuable business. Not so.
Let's say The Grocer sells itself to a rival company. The buyer pays an enterprise value (a value for all its assets) of £800m. The Supermarket sees this and starts thinking about how much it might be worth.
The owners of The Supermarket are a little old fashioned when it comes to financial matters which means they can get confused easily. They work out that the £800m paid for the Grocer equates to 20 times post-tax profits - a PE of 20.
Ignoring the fact that The Grocer has no debt and the £800m paid is for all the assets - it's an enterprise value - The Supermarket reckons that it could pocket £400m from selling up (20 x £20m) because its post-tax profits are half those of The Grocer's.
Then they think they can be a little bit clever and boost profits so they can sell out at a higher price. If they cut their depreciation charge by £10m (by assuming that their assets can last longer), post-tax profits would go up to £28m which would mean that the equity would be worth £560m (20x £28m) - an extra £160m. This won't happen because the buyer is looking at the company's EBITDA which won't be affected by this.
Remember, these businesses are identical except for the way they are financed. Even with a reduction in depreciation by The Supermarket (shown in the middle column in the table below) they would both still have the same EBITDA - £100m. They should both be worth the same amount; they should have the same enterprise value (EV). The Supermarket is making the same mistake that many investors make when trying to compare businesses.
| £m | The Supermarket | The Supermarket (adj) | The Grocer |
|---|---|---|---|
| EBIT | 50 | 60 | 50 |
| Add Dep &Am | 50 | 40 | 50 |
| EBITDA | 100 | 100 | 100 |
They are letting the fact that a company has debt and a different depreciation policy confuse them. The company with debt will pay interest on that debt which means that it will have lower post-tax profits than an identical company with the same EBITDA but no debt. That doesn't mean that the value of its assets are worth less. That's like saying that two identical houses next door to each other should sell for different prices because one has a mortgage secured against it and the other doesn't.
The buyer of a company - just like the buyer of a house - is paying for all the assets. This means that they are paying for the shareholders' equity and also taking on any debts and other liabilities at the same time. They are focusing on the company's enterprise value and looking at what they might get back in return.
By ignoring the differences in financing, tax and depreciation and concentrating on EBITDA instead, The Supermarket should be asking £800m for its business too - an EV/EBITDA valuation of 8 times.
The debt will make a difference to the actual returns for the shareholders. Because the value of The Supermarket includes a debt liability of £250m, the buyer will want to deduct this from the cash handed over to the owners. So whereas the owners of The Grocer would receive the full £800m (because it is debt-free), the owners of The Supermarket would receive £800m minus £250m - £550m.
| £m | The Supermarket | The Grocer |
|---|---|---|
| EBIT | 50 | 50 |
| Add Dep &Am | 50 | 50 |
| EBITDA | 100 | 100 |
| Price paid/Assumed (8x EBITDA) | 800 | 800 |
| EV/EBITDA paid | 8 | 8 |
| Take away debt | -250 | 0 |
| Money left over for shareholders | 550 | 800 |
EBITDA makes companies look more profitable
EBITDA is popular because it is usually a bigger number than EBIT or post-tax profits. It makes a company look more profitable and it is not really surprising that companies want to get people to focus on this.
Let's look at the example of Vodafone (LSE:VOD) - a company which talks about EBITDA a lot. For Vodafone, its EBITDA is a much bigger number than its EBIT. So when it comes to talk about its profit margins it will often focus on EBITDA margins instead of EBIT margins.
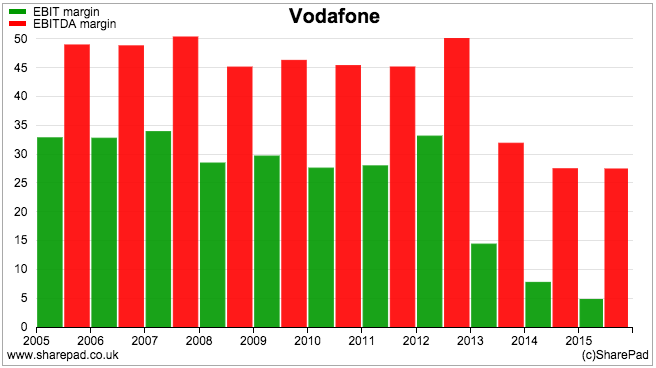
As you can see, Vodafone's EBIT margins are much smaller than its EBITDA margins. I'll have more to say on this shortly.
EBITDA makes companies look safer
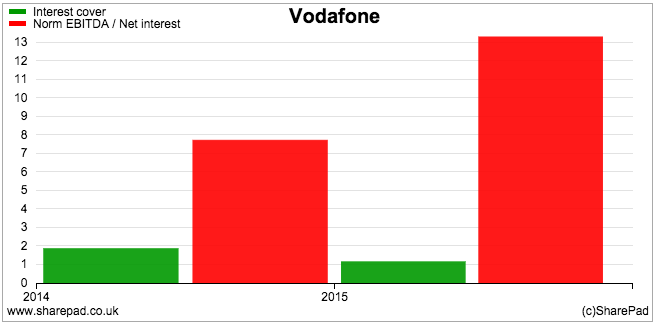
One of the key checks of how safe a company is as an investment is looking at its ability to pay the interest on its debts. This is usually done by calculating its interest cover (EBIT divided by interest paid) and looking at how many times current profits can cover the interest bill. By using EBITDA instead of EBIT to calculate this ratio you can make the interest cover number bigger - sometimes a lot bigger - which results in a company looking a lot safer.
Let's look at Vodafone again. As you can see, EBITDA interest cover makes you think that the company can very comfortably pay the interest on its debt. The more conventional calculation based on EBIT suggests that this is more of a challenge.
EBITDA makes companies look cheaper
The comparison of enterprise value to EBITDA (EV/EBITDA) is a very popular valuation measure. I prefer to look at EVs because they give a much cleaner valuation of a business and are not distorted by how a company is financed (to read more on this topic click here).
I don't compare EV with EBITDA much - if ever - but lots of people do. It is very popular amongst stockbroking analysts and the financial media because it can make shares look cheaper compared with other measures such as the PE ratio. The best example of this was during the boom in technology shares during the late 1990s. At the time, many technology and internet companies had no post-tax profits so couldn't be valued using a PE ratio but some of them did have some EBITDA which gave analysts a way to value the shares.
Many investors value shares based on a multiple of their profits. By doing this their mindsets are hardwired to think that the lower the multiple, the cheaper the share. EV/EBITDA multiples are usually lower than PE ratios and can make you think that a share is very cheap. Sometimes this might be true but often it is not.
For example, let's say you are looking at buying shares in oil company Royal Dutch Shell (LSE:RDSB). According to SharePad, the shares trade on a forecast PE ratio of 15.3 times and an EV/EBITDA ratio of 3.3 times. Which number makes you feel better?
The problems with EBITDA
To some, EBITDA is the holy grail of investing numbers. It makes the analysis of company profits and valuations seem quite simple. Unfortunately, EBITDA is one of the most flawed and abused numbers in finance. Here's why.
EBITDA is not the same as cash flow
Depreciation is an expense charged against a company's income. Its purpose is to match the cost of tangible fixed assets such as buildings or machines against the revenues they produce over their useful lives.
Say a company buys a piece of equipment for £1m which will last ten years and will be worth nothing at the end of its life. It will charge £100,000 of depreciation against its revenues for the cost of this machine for the next ten years. This will reduce the company's profits (EBIT) by the same amount.
This depreciation is not a flow of cash. The cash flow is the £1m used to buy the equipment in the first place. The supporters of EBITDA therefore argue that this depreciation has to be added back to EBIT to get a more realistic view of a company's profits. Some say that EBITDA is a good proxy for a company's trading cash flow.
However, at the end of ten years the equipment will have to be replaced. Depreciation can therefore be seen as an estimate - sometimes not a very good one - of the amount of money that needs to be set aside each year to eventually buy a new piece of equipment (although in the real world the amount needed is often more than this as the price of new equipment tend to be more expensive than prices ten or more years ago). In financial jargon this is known as maintenance or "stay in business capex", a subject I've written about a lot in recent weeks.
If a company does not replace its assets then it will find it hard to make any money at all eventually. Depreciation is therefore a real cost to a business and is not money that can be used to pay interest on debts or dividends to shareholders for very long.
The important thing to consider when looking at any measure of profit or cash flow, particularly when it is also used to value a company is that it has to reflect an amount of money that is left over to pay lenders and shareholders. A company that doesn't replace its assets will eventually stop making money which means that EBITDA is a bad measure of company profits and cash flow.
Another serious problem of EBITDA is that it doesn't take into account a company's working capital needs. Working capital is the money that a company needs to operate on a day-to-day basis. Some companies need more of it than others. That's because they might need to hold lots of stock to meet customer orders, pay for things in advance and sell goods to customers on credit. All this can be a drain on a company's cash resources, so it might need to invest cash in the business so that it can pay its daily running costs. This is cash that can't be paid out to investors.
On top of working capital, a company might be making top up payments to its final salary pension scheme to help plug a deficit. It also might be spending cash on restructuring the company. The cash spent here is not reflected in EBITDA. But it is used to calculate a company's operating cash flow which is a much more meaningful number.
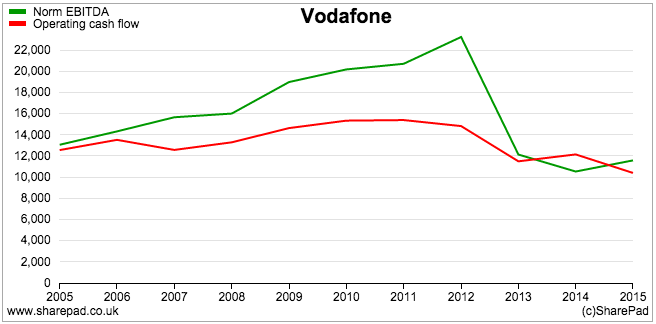
As you can see, there have been significant differences between Vodafone's EBITDA and operating cash flow during the last ten years (although they are now fairly similar).
When EBITDA can be useful
Despite its many flaws there are times when EBITDA can be quite a useful number for investors.
In times of financial distress
EBITDA can be useful when a company's profits have fallen substantially and have even turned into losses. This can lead you to think that a company might not be able to pay the interest on its debts. If a company has a large depreciation expense, it may be able to stop replacing its assets for a short time - say a couple of years - and free up cash to pay its interest bill.
Take the example of the fictional company Metal Basher below. It has lots of assets and so has a big depreciation expense. When times are good is makes a reasonable profit of £500m and has no problem paying the interest on its debts.
| Metal Basher plc (£m) | Good Times | Bad Times |
|---|---|---|
| EBIT | 500 | -500 |
| Depreciation & Amortisation | 700 | 700 |
| EBITDA | 1200 | 200 |
| Interest paid | 125 | 125 |
| Interest cover (x) | 4 | N/a |
| EBITDA interest cover(x) | 9.6 | 1.6 |
Then it suffers a nasty change of fortunes and loses £500m. Calculating its interest cover might suggest that this company is heading for bankruptcy. However, if it cuts back its spending the EBITDA number is telling us that it might just be able to pay its interest bill whilst it tries to restore the business to profitability. It must do this quickly as not replacing assets could reduce the future profitability of the business.
Working out how capital-intensive a business is
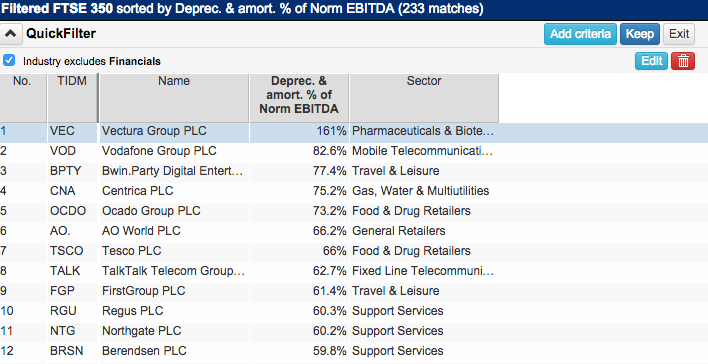
One of the things I do use EBITDA for is to work out how much money a company might have to plough back into its business. To do this, I break up EBITDA and look at how much of it is made up from EBIT and how much comes from depreciation and amortisation (DA). The bigger the proportion of depreciation and amortisation, the more capital intensive a business is likely to be.
Generally, I want to avoid businesses that have high maintenance capex requirements as they tend to produce lower returns on capital (ROCE) and less free cash flow. High percentages of depreciation and amortisation may also be a sign of low profitability, another thing that I might want to avoid. You can easily run a screen for this in SharePad as shown below.
Forget about EBITDA - focus on cash profits instead
Create a custom results table in SharePad as shown below. Then export it to a spreadsheet.
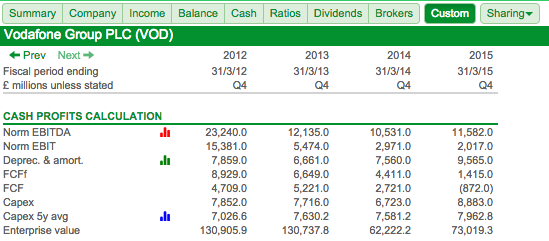
You can then have a go at working out a company's real cash profits and then see how its valuation stacks up on that measure rather than using EBITDA which might give you a misleading answer. To work out cash profits you need some estimate of "stay in business capex" (click here for more on this subject). There is no right answer unless the company tells you what it spent in its annual report (a few companies are quite helpful in this respect). I have used five year average capex figures as an estimate of this which SharePad has calculated for me.
Based on the numbers taken from SharePad, I have then performed the following calculations.
| Vodafone plc | 2012 | 2013 | 2014 | 2015 |
|---|---|---|---|---|
| EBITDA less capex | 15388 | 4419 | 3808 | 2699 |
| % of EBIT | 100.05% | 80.73% | 128.17% | 133.81% |
| EBITDA less 5yr average capex | 16213.4 | 4504.8 | 2949.8 | 3619.2 |
% of EBIT | 105.41% | 82.29% | 99.29% | 179.43% |
FCFF | 8929 | 6649 | 4411 | 1415 |
| add back capex | 7852 | 7716 | 6723 | 8883 |
| less Capex 5y avg | -7026.6 | -7630.2 | -7581.2 | -7962.8 |
| Adjusted FCFF | 9754.4 | 6734.8 | 3552.8 | 2335.2 |
Valuations: | ||||
| EV/EBITDA | 5.6 | 10.8 | 5.9 | 6.3 |
| EV/EBIT | 8.5 | 23.9 | 20.9 | 36.2 |
| EV/EBITDA - Capex | 8.5 | 29.6 | 16.3 | 27.1 |
| EV/EBITDA - Capex 5y avf | 8.1 | 29 | 21.1 | 20.2 |
| EV/FCFF | 14.7 | 19.7 | 14.1 | 51.6 |
| EV/FCFF (adj) | 13.4 | 19.4 | 17.5 | 31.3 |
EBITDA less capex is a good starting point for working out a company's cash trading profits. However, this measure does ignore movements in working capital and the payment of tax. Free cash flow to the Firm (FCFF) takes both into account. This makes it a very good number for weighing up a company.
I have adjusted FCFF for five year average capex to give me an estimate of Vodafone's after tax, cash based trading profits. If I compare this with its enterprise value (EV) then what I have effectively created is a debt-adjusted cash PE ratio.
So if you think Vodafone shares are cheap because they have an EV/EBITDA ratio of 6.3 times you might want to think again. The EV/FCFF (adj) of 31.3 is saying that they are very expensive.
Summary
- EBITDA is a simple but flawed measure.
- EBITDA is not the same as cash flow.
- It makes company profits seem bigger and valuations cheaper.
- It is useful in times of financial distress.
- It can help you work out how capital intensive a company is.
- Cash profits and Free cash flow are much better alternatives.
If you have found this article of interest, please feel free to share it with your friends and colleagues:
We welcome suggestions for future articles - please email me at analysis@sharescope.co.uk. You can also follow me on Twitter @PhilJOakley. If you'd like to know when a new article or chapter for the Step-by-Step Guide is published, send us your email address using the form at the top of the page. You don't need to be a subscriber.
This article is for educational purposes only. It is not a recommendation to buy or sell shares or other investments. Do your own research before buying or selling any investment or seek professional financial advice.

