How to be a better investor with trailing twelve month (TTM) data
If you want to make good investment decisions then it is vital that you study a company's financial history. I am a firm believer that it is only by gaining a good understanding about how a company has performed in the past that you can form any kind of sensible view about how it might perform in the future.
ShareScope and SharePad are designed to help make this task easier and faster. In this article, I am going to tell you about a very useful addition we have made to our data and how it can help you on the road to better investment results.
Want to learn how to analyse shares like a professional? Download our FREE guide.
Sign-up to our mailing list to receive a PDF of our Step-by-Step Guide to Investing.
Share this article with your friends and colleagues:
Why we've added TTM data
To get the most out of any financial analysis it is important that you use the most up to date information you can get your hands on. Most companies report their financial performance twice a year (half year and full year results) and some do this every three months (known as quarterly reporting). But an appraisal of how companies are doing and what their shares might be worth is usually based on its annual results, not what it has done in the last three, six or nine months.
This can cause a few difficulties for investors as you only get to see a company's annual results once a year. Let's say that a company's financial year ends in May. It might not report its annual results to the stock exchange until the end of July or early August. So looking at the company on an early July morning in 2015 you might come to the conclusion that your last annual financial information will be from May 2014. In other words it is fourteen months out of date. The good news is that it doesn't have to be this way.
You might be able to look at some forecasts from professional analysts but these aren't always reliable or available for some companies. Fortunately, there is a better way to get more up to date financial information that isn't based on guesswork. It's called trailing twelve month data or TTM for short.
We've just added this feature to SharePad and will be soon bringing it to ShareScope users as well. It is a very simple but very powerful way to learn a little bit more about a company. It's also something that for some reason lots of investors don't seem to bother with. They should.
How to calculate TTM numbers
A company's financial performance can change fast. For example it may be growing rapidly. When an economy goes into recession some companies' sales and profits can fall at an alarming rate. Sometimes companies make big purchases of other businesses which can dramatically change how it looks to investors.
If you just wait for the next set of annual results then you might miss an important change. By calculating the TTM numbers you will be able to pick up a lot more information which will allow you to make better investment decisions. Working a company's TTM numbers is relatively straightforward as I'll show you.
| Fast Growth(£m) | H1 2014 | H2 2014 | FY 2014 | H1 2015 | TTM |
|---|---|---|---|---|---|
| Turnover | 480 | 520 | 1000 | 600 | 1120 |
| EBIT | 96 | 104 | 200 | 120 | 224 |
| Net interest | -7 | -8 | -15 | -8 | -16 |
| Profit before tax | 89 | 96 | 185 | 112 | 208 |
| Tax | -17.8 | -19.2 | -37 | -22.4 | -41.6 |
| Profit after tax | 71.2 | 76.8 | 148 | 89.6 | 166.4 |
| Shares in issue(m) | 100 | 100 | 100 | 100 | 100 |
| EPS(p) | 71.2 | 76.8 | 148 | 89.6 | 166.4 |
Fast Growth, a software company, has just reported its financial results for the first six months of 2015 (its half year). It has a great new product that is flying off the shelves and sales and profits (earnings before interest and tax or EBIT) are 25% higher than a year ago. Reported with these half year numbers is last year's half year figures and the full year results for 2014. By taking away last year's half year profits from its full year profits you get the profit figures for the second half of the year. This allows us to work out the TTM numbers.
To get the TTM numbers we simply add this year's half year results to last year's full year results and take away last year's half year results. Or put another way, we are adding last year's second half results to this year's first half results.
TTM = (H1 2015) + (FY 2014) - (H1 2014)
The same principle applies to quarterly results too. If a company has just reported its third quarter results (sometimes referred to as Q3 results) then to get the TTM figures you do the following calculation:
TTM = (Q3 2015) + (Q2 2015) + (Q1 2015) + (Q4 2014)
These calculations only need to be done for income and cash flow statements which show what has happened over a period of time. You don't need to do this for balance sheets which show a company's financial position at one point in time. The latest balance sheet is therefore the most up to date one.
Remember, SharePad does all these calculations for you.
Why TTM numbers are useful
I am a big fan of TTM numbers. When I was a professional analyst I was surprised as to how little they were used by investors. I'll freely admit that I didn't start using them much until relatively late on in my career. When I did though I found them to be an extremely useful analysis tool.
As a private investor, I think they are probably more valuable than analysts' forecasts, primarily for the reason that you are dealing with something that is factual rather than a prediction that may or may not be any good.
In short, I see four really useful ways that TTM numbers can help investors:
- Providing a more up to date picture of a company's performance and its finances. This is especially useful if profits are moving up or down quickly and can allow you to spot a change in fortunes.
- For analysing seasonal business such as travel companies or retailers where most of the sales and profits are made in just a few months of the year.
- Looking at smaller companies that are not covered by professional analysts.
- Comparing the latest annual profits with analysts' forecasts. This might be helpful in spotting whether those forecasts are too high or too low which might in turn help you buy or sell a share before lots of people figure this out.
A more up to date view of a company
Let's go back to the example of Fast Growth for a minute and assume that this company isn't followed by professional analysts so you have no forecasts that estimate its full year profits for 2015. Let's also assume that its shares are currently changing hands for 2960p. Given the last reported earnings per share (EPS) in May 2014 of 148p the shares are valued at a trailing PE ratio of 20 times (2960p/148p). Some people might quite reasonably come to the conclusion that the shares look too expensive at this price.
However, the TTM EPS is 166.4p which reflects the strong growth in profits during the first six months of 2015. This reduces the PE to 17.8 times and makes the shares look less expensive. If the company can keep the strong profit growth going then Fast Growth might be undervalued and worth buying.
A seasonal business
Let's now take a look at a company where profits are seasonal.
easyJet (LSE:EZJ) is a very successful airline business but it makes most of its money in the spring and summer months - from March to September - when its planes are full of holidaymakers. During the quieter autumn and winter months it doesn't make much money at all. In fact, in previous years it has actually lost money during this period.
So when the company reported its half year results to March 2015 and it made a small profit compared with a loss in the period a year earlier, investors were happy. But they wouldn't have known anything about its TTM performance on reading the results statement.
Let's have a look and see what's going on.
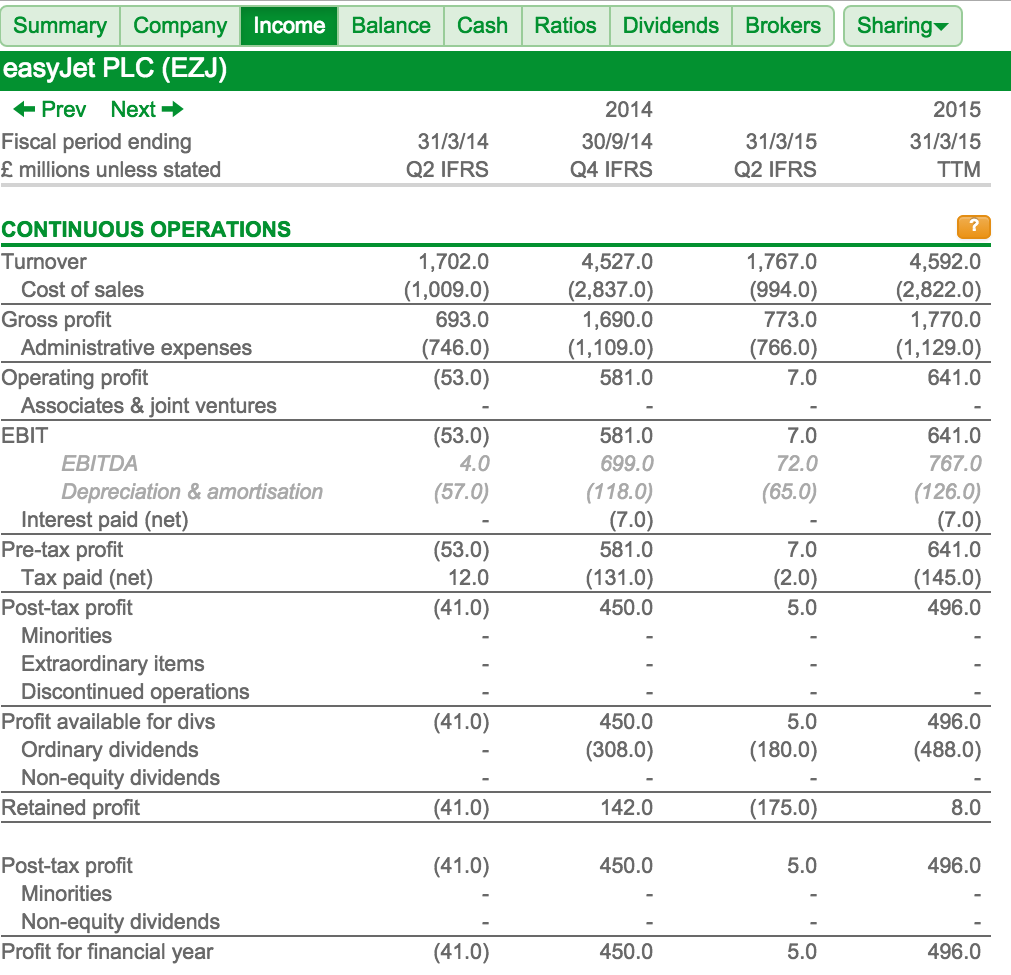
Here we can compare the last annual results from September 2014 (30/9/14) with the TTM numbers to March 2015. It makes for very encouraging reading. What we can see is that annual sales have increased by £65m from £4527m to £4592m and that most of that extra turnover has ended up as extra profit. EBIT has increased by £60m from £581m to £641m.
We can also look at easyJet's financial ratios on a TTM basis to see if they are getting better or worse. This is where TTM numbers can give you a real insight into whether a company is changing. You can't easily do this by looking at quarterly or half year numbers alone.
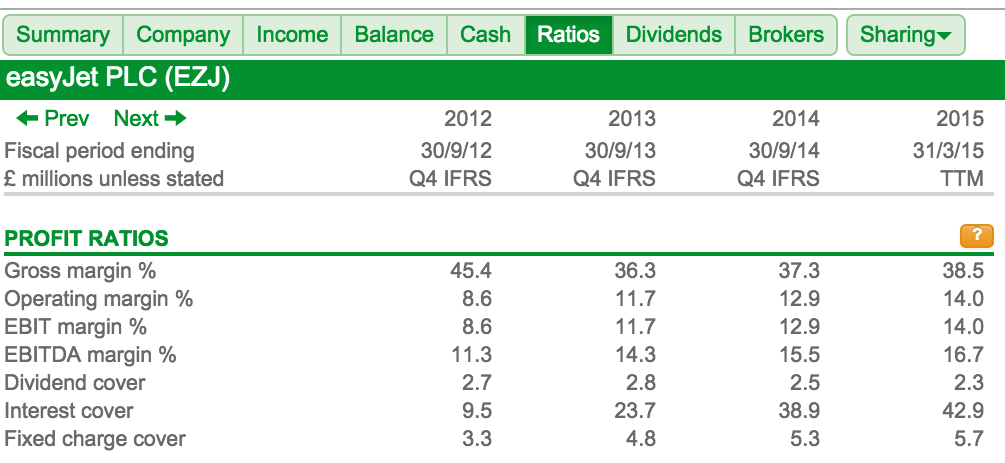
Here are easyJet's profit ratios for the last four years. Its profit margins are going up nicely with TTM margins higher than last year and continuing the recent trend of higher margins. Fixed charge cover - a key ratio of financial strength for an airline that leases its aircraft - is a very comfortable 5.7 times and is on an improving trend.
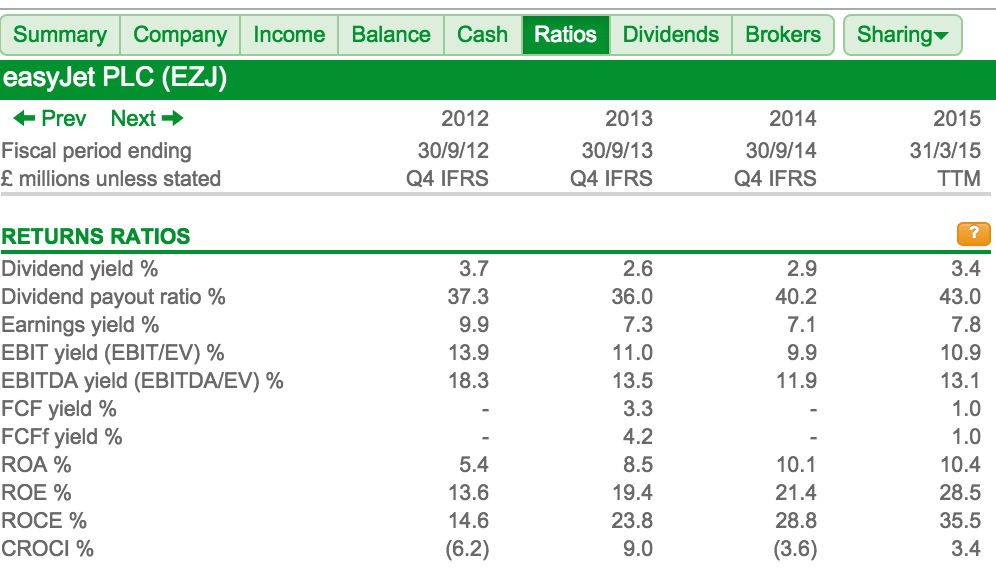
ROCE of 35.5% is also higher although this does ignore the fact that aircraft are rented rather than owned. This tends to give a much higher ROCE because the rented aircraft are not on easyJet's balance sheet) but an increasing ROCE is an encouraging sign.
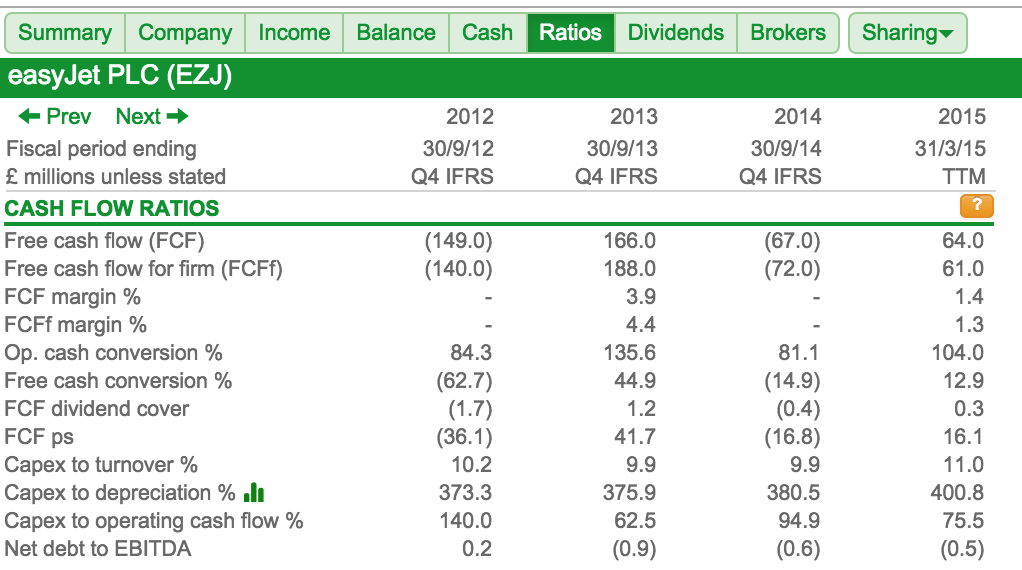
One potential negative aspect of easyJet's performance is its poor free cash flow. This is explained by very high capital expenditures compared with depreciation. This ratio is rising and is now over 400%. This needs to be investigated. A potential investor in easyJet shares needs to know why this number is so high. Is the company investing heavily for future growth or are its profits overstated? (to read more on this subject click here).
Comparing TTM numbers with analyst forecasts
A real strength of using TTM numbers comes from comparing them with what analysts are forecasting for the next financial year.
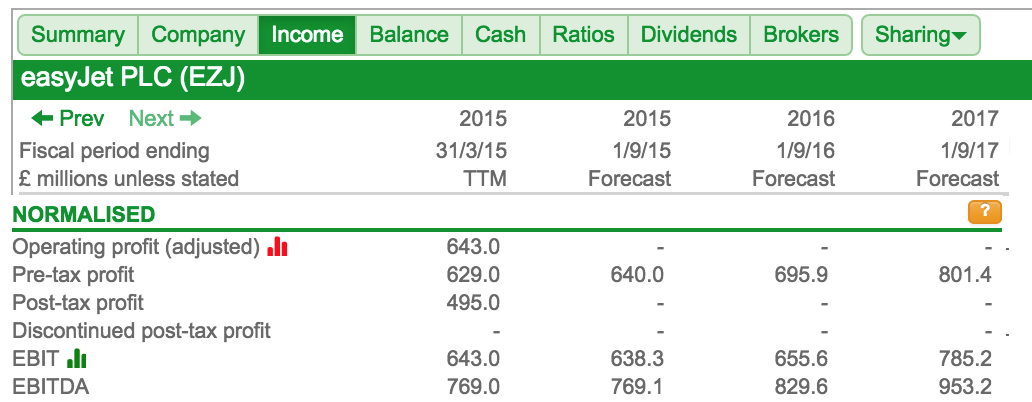
The TTM numbers are normalised (adjusted for one-off gains and losses) in the table above and can be slightly different from the numbers shown in the income statement above.
If a normalised TTM profit number is higher - or even slightly less - than the consensus analyst forecast (the forecast number quoted in SharePad and ShareScope) then it may be that the forecast number is too low. It could also mean that profits are on a downwards trends and are expected to fall. Mining companies are a good example where this is currently the case. You need to investigate the reason for the difference.
Here with easyJet the TTM pre-tax profit figure of £629m is very close to the 2015 forecast of £640m. This begs the question as to whether the forecasts could be too low and should be a key part of any research into the company. Has the company said something in its results statement that suggests that profits growth is slowing or that a future event will be a drag on profits? If not, then if the annual pre-tax profit is already £629m then it could be possible to beat £640m with another favourable six month's trading performance. We can see that the EBIT and EBITDA forecasts have already been met on a TTM basis.
Screening on TTM numbers
You can now run filters in SharePad on TTM numbers which should give you even better results than using the last reported annual numbers.
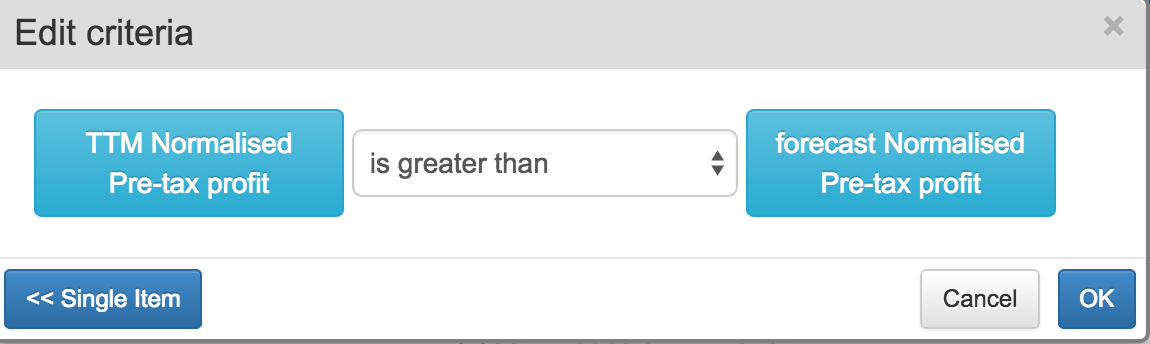
One potentially useful filter is to look for companies where the TTM profits are higher than analysts' forecasts (note that TTM profits are usually lower than forecasts if profits are on an upwards trend) as a way of spotting potential forecast upgrades. Such upgrades often see the related share price of a company go up.
If you can buy in before this is recognised by the herd then you could be on to a profitable investment. You probably won't find many examples where this is the case though, most of the time it will be because profits are expected to fall.
However, as an unconventional way of looking for possible investment ideas I think this is worth looking at. If you can find just one or two potential shares where analysts may have been slow in recognising upwards profit momentum it will have been a worthwhile exercise.
You can do this by combining items in a filter in SharePad as shown below:
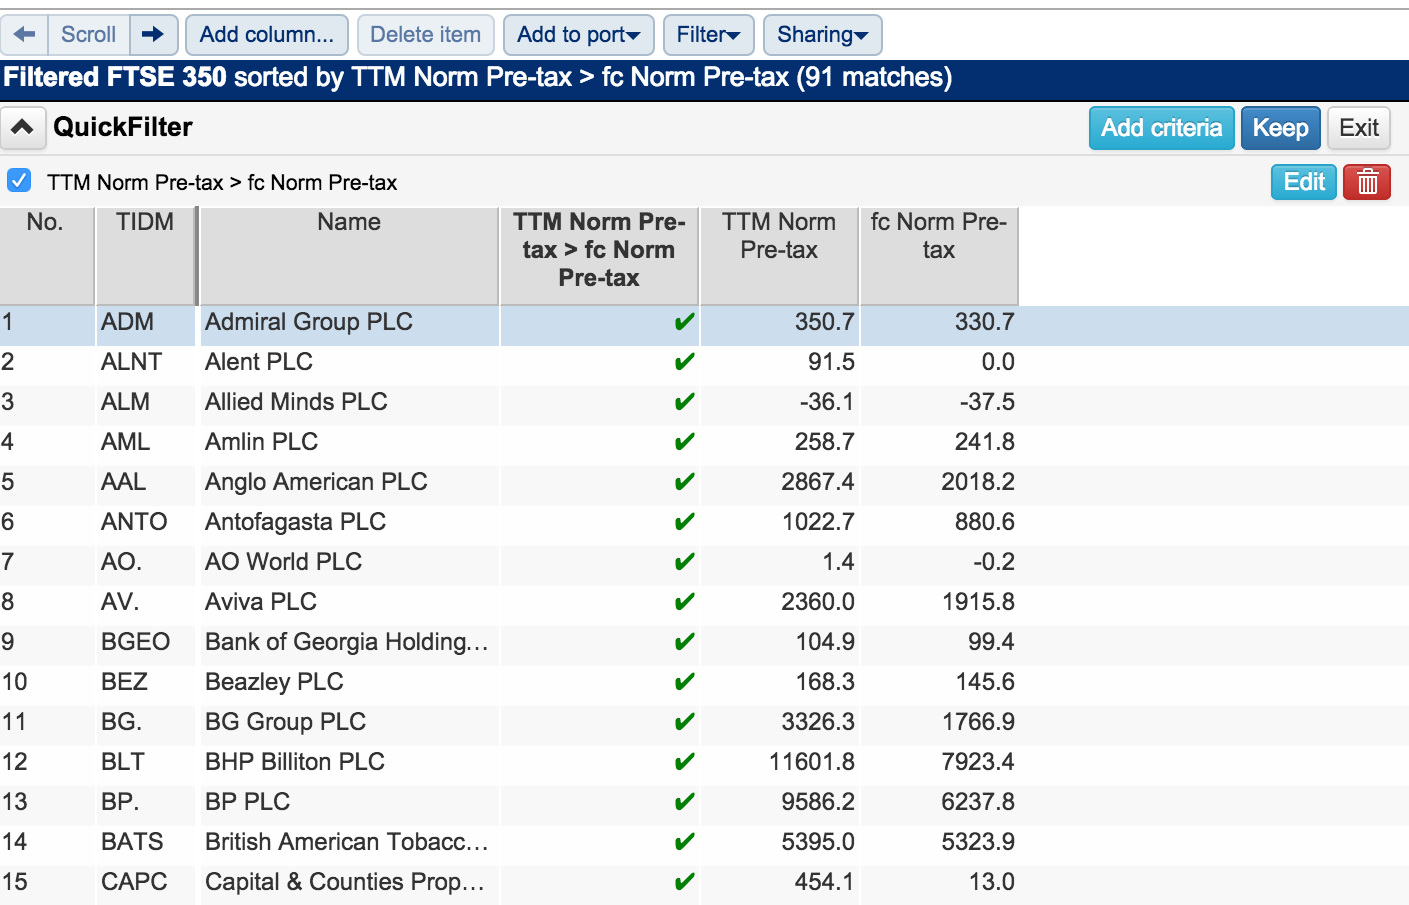
SharePad currently finds 91 companies in the FTSE 350 index where this is the case. This is over one quarter of all the shares in the index and is probably more than I would normally expect. You won't be surprised to find the list stuffed full of oil and mining companies where lower commodity prices are eating into profits in a big way. For these companies this probably means that the TTM numbers still contain a chunk of profits from when trading conditions were more favourable and therefore explain why they are higher than current forecasts (which might factor in a longer period of weaker profits). But could there be an undiscovered gem in there?
If you want to learn anything more about TTM numbers or any help with using them then please get in touch by emailing me at analysis@sharescope.co.uk.
If you have found this article of interest, please feel free to share it with your friends and colleagues:
We welcome suggestions for future articles - please email me at analysis@sharescope.co.uk. You can also follow me on Twitter @PhilJOakley. If you'd like to know when a new article or chapter for the Step-by-Step Guide is published, send us your email address using the form at the top of the page. You don't need to be a subscriber.
This article is for educational purposes only. It is not a recommendation to buy or sell shares or other investments. Do your own research before buying or selling any investment or seek professional financial advice.

