How to use asset values to pick shares
Last week I looked at some of the issues associated with low p/e investing as a way of finding cheap shares. I showed you some alternative tools that ShareScope has that could possibly help you to avoid buying shares that might have looked cheap but weren't actually bargains.
This week I am going to continue with the cheap share theme but turn the focus to company assets rather than profits. Once again I'll show you some ShareScope tools that can put you on the right track to becoming a smarter investor.
Want to learn how to analyse shares like a professional? Download our FREE guide.
Sign-up to our mailing list to receive a PDF of our Step-by-Step Guide to Investing.
Why look at asset values?
It's understandable why investors spend a lot of time looking at profits and cash flows when they are researching a company. However, many value investors have become successful by examining a company's assets.
They spend a lot of time studying balance sheets, looking at a company's assets such as land, buildings, stocks of goods and money owed by customers (trade debtors) as well as liabilities such as borrowings, outstanding bills (trade creditors) and pension schemes. Take away the value of liabilities from the value of assets and you get what is known as a net asset value (NAV).
One of the rules of accounting is that this NAV figure must equal the value of the shareholders' equity in a business. It can also be seen as an estimate of what shareholders might receive if the company was closed down and everything was sold off. In practice though, this is rarely the case. Assets and liabilities may be worth more or less than their balance sheet values.
Some investors are more trusting in asset values than profits. They reason that there's less scope to manipulate them and that there may be some hidden, alternative value that doesn't show up in the income statement.
One of the main reasons to look at asset values is that it can be a good way to look at companies that might be temporarily going through a hard time and not making any profits. Looking at NAV might still help you find an undervalued share whereas a p/e ratio or dividend yield wouldn't.
You can look for possible cheap shares by compare the share price of a company with its net asset value (sometimes referred to as book value) per share. If you can buy a share at a big discount to its book value (a price to NAV a lot less than 1) then it might be possible to make money from it when business conditions improve. History tells us that this can be a very profitable investment strategy.
So do you just have to start up ShareScope and look for shares trading at a big discount to NAV? Not quite. This is your starting point. But like lots of things when it comes to investing it pays to be a bit smarter and do a little bit more work.
Enter the F-Score
The good news here is that ShareScope can help you in this respect. It does so by calculating what is known as an F-Score for each company.
Back in 2002, Chicago University accounting professor Joseph Piotroski took a closer look at the strategy of buying shares with a low price to book value. What he found out was that the investment results were not as good as they could have been.
This was because of lot of companies with low price to book values were financially distressed and continued to see a deterioration in their finances. What Piotroski found was that the shares of these companies with weak finances detracted from the performance of those in better financial health and reduced the returns of a low price to book value portfolio.
So Piotroski set about finding out whether he could filter out the bad companies by setting some important tests of their finances. He used the information contained in a company's financial statements to devise 9 tests of financial strength. If the company passed the test it was awarded one point. If it failed then it scored zero. The results from all 9 tests were added together to give what is known as an F-Score. High F-Scores (7-9) are seen as a sign of improving financial condition.
Piotroski looked at shares between 1976 and 1996 and found that if he combined shares with low price to book values and high F scores (improving finances) the annual average returns of an investor could be enhanced by 7.5% per year compared with just using valuations alone. A strategy of buying expected winners (high F scores) and selling expected losers (low F scores) over the same time period generated average annual returns of 23%.
Piotroski also found that his strategy worked best with small and medium sized companies, with low trading volumes and with few or no stock market analysts following them. He argued that, for these types of company, the stock market took a long time to fully reflect historical financial information in their share prices. This was not the case for bigger companies which are more closely followed by professional investors.
The nine tests that make up the F-Score
Piotroski focuses on three key areas of a company's financial performance: its profitability, its financial leverage and liquidity and its operating efficiency. I'll explain what all these mean in a minute.
If at all possible you want a company you are considering investing in to be profitable and to be able to generate some cash flow from its trading activities. This highlights that it is capable of generating some funds from its own resources and not reliant on more loans or money from shareholders.
Piotroski devised four tests of a company's profitability. Each test passed scores 1 point towards the F Score:
- A positive return on assets (net income/total assets).
- An improving return on assets compared with the previous year. This indicates that the business is improving.
- Positive cash flow from operations.
- Cash flow from operations greater than net income. It is harder to fudge cash flow than profits. Improving cash flow is a good sign.
In addition, Piotroski focused on the ability of a company to meet its financial obligations. If debt increases, liquidity declines or money from external sources is needed this is seen as a bad sign and the shares of such companies should be avoided.
One point is awarded for passing each of the following three tests:
- Change in leverage. This is measured by looking at the change in the ratio of long-term debt to average total assets. A reduction in leverage is a good sign. Increases in borrowings may show an inability to generate funds internally from profits.
- Change in liquidity. Here, we are looking at the ability of a company to turn assets such as stock and debtors into cash to pay some of its bills. This is measured by changes in the current ratio (current assets divided by current liabilities) during the last year. A higher current ratio is seen as desirable.
- Any issues of fresh equity (new shares). This can be a bad sign as it shows that a company cannot generate its own finances. Issuing equity when a share price is depressed is also a warning sign.
Finally, Piotroski looked at a company's operating efficiency and screened for improvements in the following two ratios:
- Change in gross margin (gross profits/turnover). Higher profits are better than lower ones.
- Change in asset turnover (Sales/Total Assets). An improvement here shows that a company is getting more out of its asset base and becoming more financially productive.
Using ShareScope to find possible shares to invest in
I've run a screen in ShareScope to look for shares in the FTSE All Share index and the AIM 100. I've asked for shares which have a price to book value (price to NAV) of between 0.25 and 1.
Once I've done this, I then add a column for the Piotroski F-Score. In the table below, you'll see a selection of shares from ShareScope which meet the price to NAV criteria and have a F-Score of 6 or more.
| Name | Sector | Close (p) | Capital (£m) | Price to NAV | Piotroski F-score | Price to NTAV |
|---|---|---|---|---|---|---|
| Hunting PLC | Oil Equipment, Services & Distribution | 537.5 | 798 | 0.95 | 8 | 2.09 |
| Sportech PLC | Travel & Leisure | 50 | 102.5 | 0.73 | 8 | -1.83 |
| Trinity Mirror PLC | Media | 148.25 | 382 | 0.67 | 8 | -3.43 |
| Vodafone Group PLC | Mobile Telecommunications | 223.6 | 59273.7 | 0.84 | 8 | 2.45 |
| BHP Billiton PLC | Mining | 1413.5 | 29854.1 | 0.64 | 7 | 0.69 |
| Ferrexpo PLC | Industrial Metals & Mining | 66.2 | 389.7 | 0.38 | 7 | 0.4 |
| TT electronics PLC | Electronic & Electrical Equipment | 103.25 | 164.2 | 0.81 | 7 | 1.37 |
| Quindell PLC | Software & Computer Services | 45.5 | 198.5 | 0.26 | 7 | 0.46 |
| Young & Co's Brewery PLC | Travel & Leisure | 760 | 448.7 | 0.58 | 7 | 0.62 |
| AGA Rangemaster Group PLC | Household Goods & Home Construction | 124 | 85.9 | 0.71 | 6 | 2.88 |
| Anglo American PLC | Mining | 1223 | 17081.2 | 0.88 | 6 | 1.01 |
| BP PLC | Oil & Gas Producers | 405.95 | 74015.4 | 0.96 | 6 | 1.31 |
| Communisis PLC | Support Services | 53 | 105.5 | 0.73 | 6 | -2.54 |
| Daejan Holdings PLC | Real Estate Investment & Services | 5395 | 879.1 | 0.79 | 6 | 0.79 |
| Exillon Energy PLC | Oil & Gas Producers | 137.5 | 222.1 | 0.64 | 6 | 0.64 |
| Huntsworth PLC | Media | 46.75 | 151.9 | 0.59 | 6 | -4.27 |
| Low & Bonar PLC | Construction & Materials | 51.5 | 168.8 | 0.9 | 6 | 2.35 |
| Management Consulting Group PLC | Support Services | 16.75 | 83.1 | 0.39 | 6 | -1.49 |
| Millennium & Copthorne Hotels PLC | Travel & Leisure | 562.5 | 1826.3 | 0.8 | 6 | 0.8 |
| Raven Russia Ltd | Real Estate Investment & Services | 54 | 393.9 | 0.75 | 6 | 0.76 |
| Royal Dutch Shell PLC | Oil & Gas Producers | 2154.5 | 134082.8 | 0.49 | 6 | 0.5 |
| Sainsbury (J) PLC | Food & Drug Retailers | 231.6 | 4433.1 | 0.74 | 6 | 0.77 |
| Town Centre Securities PLC | Real Estate Investment Trusts | 275 | 146.2 | 0.89 | 6 | 0.89 |
Prices taken on 10th December 2014
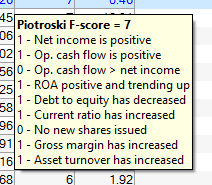
A very useful feature within ShareScope is that you can point your cursor over the F-Score calculation and it will tell you how the company concerned scored on each of the 9 tests as shown below.
Things to consider
- Remember, any screen is the start of an investment process not the end. It's not a signal that a share should be bought or sold. It's essential that you do your own research before you make any decision. Remember the companies that screen for a low price to book value are probably included because they are unpopular for one reason or another. Is the market right or has it treated the company too harshly?
- Check out whether the book values of these companies are reliable and based on meaningful tangible assets instead of lots of goodwill or intangible assets. I've included a column showing price to net tangible assets (Price/NTAV per share) above. For example, Trinity Mirror has a P/NAV of 0.67 but a P/TNAV of -3.73 (because it has negative tangible net assets). You have to work out whether the intangible assets should have a big value or not.
- Do the shares stack up on other measures of value? For instance, if the company has profits does it have a low or modest p/e ratio?
- Which tests are the most important? The F-Score doesn't place any extra importance on any of its nine tests. So a company may pass 8 of them but fail on a vital measure such as positive cash flow. That might be enough to put you off investing in the company.
Phil Oakley

