Stock Watch: Howden Joinery Group (Howdens)

Howden Joinery Group is the parent company for Howdens. Howdens was established in 1995 with 14 depots by its current chief executive Matthew Ingle when the business was part of the MFI Group. MFI was sold off in 2006 but the company (it was known as Galiform back then) was responsible for some significant onerous lease liabilities when MFI went into administration in 2008. These problems have now been sorted out.
Howdens makes and supplies kitchen and joinery products to small builders through a nationwide depot network. Up until a couple of years ago Howden shares had performed strongly but they have struggled to make much headway since then.
In this article, I am going to take a closer look at this company and see what the future might bring for its investors.
Want to learn how to analyse shares like a professional? Download our FREE guide.
Sign-up to our mailing list to receive a PDF of our Step-by-Step Guide to Investing.
Share this article with your friends and colleagues:
The business
The company is a fine example in how to communicate with investors. Its annual reports and presentations are extremely detailed and open about how its business works and the opportunities and risks involved. I'd go as far to say that they are probably one of the best - if not the best - I have come across in my 20 years of investing.
Howdens is primarily a UK business. It does have 24 depots spread across France, Belgium and recently Holland but as far as the value of the business and its immediate prospects are concerned is virtually all tied up with its UK operations.
The company is a vertically integrated supplier of kitchen and joinery equipment. It manufactures kitchen cabinets and worktops at two sites (Howden in Yorkshire and Runcorn in Cheshire). It has its own brand of kitchen appliances called Lamona (ovens, hobs, extractors, dishwashers, fridges, washing machines, sinks and taps) and buys in other kitchen equipment from third parties.
By manufacturing its own cabinets and worktops, Howdens can supply its customers more cheaply than using third parties. This in-house production gives it a significant cost advantage over its competitors.
The company also has its own in-house logistics operation of warehouses and trucks which deliver to a nationwide network of 650 depots. This allows it to have a very tight grip on its supply chain - another competitive advantage.
Howdens does not sell directly to the general public. It sells to small builders. Each depot is managed as a separate local business. The depot manager has complete discretion on stock levels and pricing (with a confidential discounting policy) to adjust to local business conditions. All depot employees have a proportion of their pay based on the profit of the depot which incentivises them to grow the business and offer high levels of customer service.
Howdens' mission statement is to help local small builders make money. It aims to do this by having high local stock availability of quality products which are built to last and don't break. This is complemented by an in-house kitchen design service offered to the builders' end customers.
By competing on product quality and high levels of customer service, Howdens aims to build up a loyal customer base with high level of repeat business. Most of its sales are made on credit with builders typically given 8 weeks to settle their invoices.
Depot economics
Howdens depot economics look to be very attractive. The company will tend to rent premises on out of town industrial estates in areas where there is an attractive potential market of small builder customers.
Each depot is around 10,000 square feet which costs around £5.50-£6.00 per square foot in rent per year. The fit out costs are typically around £300,000 with only 10% of the space dedicated to showrooms and kitchen design. The bulk of the depot is used as cheap storage space in order to give high levels of stock availability to customers.
This approach is a lot cheaper than having high street showrooms and all the extra overheads that come with them and is another source of competitive advantage for Howdens which allows it to offer competitive prices.
Depots require around £650,000 of annual sales to breakeven which tends to take around two years to achieve. Sales and profitability then tend to continue maturing for another five years.
This seven year maturation process for a depot can give Howdens an important source of underlying sales and profit growth. Given the scale of the depot opening programme in recent years around quarter of its depots are still maturing which is a nice situation to be in.
Business performance
As you can see from the table below, the number of depots and sales has grown significantly over the last decade. There has been a big push on new openings during the last five years.
One of the key sources of growth is growing the number of trade credit accounts per depots. Howdens has been good at doing this. Note the big jump in 2016. Is this a cause for concern? Does it signal that the company is having to offer more generous credit terms in order to maintain and grow sales? Or is it a genuine sign of depot managers' ability to grow the underlying business?
As an outsider it's difficult to know but the scale of the jump in credit accounts per depot in just one year is big. If I was going to buy shares in Howden - or already owned some - I'd want some reassurance on this.
| Year | Depots | Sales (3m) | Sales per depot (£m) | Credit Accs | Accs per depot | LFL Sales |
|---|---|---|---|---|---|---|
| 2007 | 436 | 768.4 | 1.88 | 180000 | 413 | 8.9 |
| 2008 | 454 | 782.9 | 1.76 | 178000 | 392 | -3.1 |
| 2009 | 462 | 756.4 | 1.65 | 185000 | 400 | -4.6 |
| 2010 | 489 | 795.1 | 1.67 | 200000 | 409 | 3.6 |
| 2011 | 509 | 838.7 | 1.68 | 250000 | 491 | 3.1 |
| 2012 | 529 | 872.5 | 1.68 | 270000 | 510 | 1.9 |
| 2013 | 559 | 940.7 | 1.73 | 290000 | 519 | 5.6 |
| 2014 | 589 | 1075.5 | 1.87 | 330000 | 560 | 10.8 |
| 2015 | 623 | 1203.8 | 1.99 | 360000 | 578 | 9.2 |
| 2016 | 642 | 1281.7 | 2.03 | 450000 | 701 | 4.2 |
You can also see that Howdens has been good at growing like-for-like sales in recent years. 2013-15 saw very strong rates of growth. Given that backdrop, it should not be really surprising to have seen LFL sales moderate in 2016 but does it signal more of a serious slowdown? I'll have more to say on this important matter later on.
Average sales per depot have passed the previous peak from 2007 (in nominal terms) and have improved significantly during the last couple of years.
One characteristic that the table above does not show is that Howdens is a very seasonal business. It peak trading period is in October and November. Around 60% of sales and 70% of trading profits are made in the second half of its financial year (July-December).
How recession resilient is Howdens?
People tend to buy new kitchens when they are feeling confident about their financial position. The purchase of a kitchen tends to be financed out of savings or by borrowing money. Access to credit is a key driver of the market with large kitchens (such as those related to home extensions) often being financed with additional mortgage borrowing.
A decline in the economy and the housing market is therefore a significant risk to Howdens sales and profit prospects. However, if the experience of the 2008-09 recession was anything to go by then Howdens' business model seems to have a high degree of resilience built into it.
LFL sales fell significantly in both 2008 and 2009 but profits held up well (when the end of the contract to supply its former business MFI is stripped out). The company stopped opening new depots from May 2008 and took £35m of stock out of the business. This helped it sell stock at the prices and margins it wanted to rather than being forced into fire sales of stock at depressed prices.
The recovery from the recession saw the company start opening depots again in 2009 and taking market share.
When the UK economy and housing market turns down again, it seems reasonable to expect that the current management team - who were in place during the last recession - will take similar actions to protect profits.
Financial performance
Howden's business performance and strong growth has translated into some very impressive financial performance numbers.
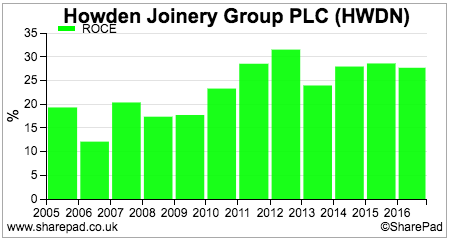
Return on capital employed (ROCE) has been excellent. The chart above takes into account a capitalised value of off balance sheet lease liabilities (c£500m in 2016) and ROCE was still over 27% in 2016.
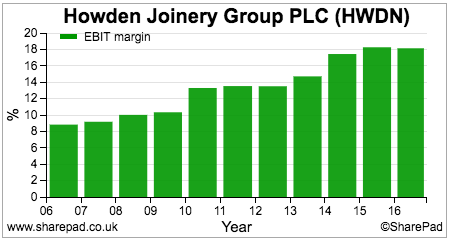
Profit margins are high and have been increasing. As I've said before, I like companies with high profit margins for two main reasons. First and foremost they can be a sign that a company has a business with an economic moat - a business model that is hard to copy and compete with.
High margins also offer the investor a large amount protection from financial problems in the event of a temporary profit setback. Businesses with low profit margins can get into trouble and even start losing money when times get tough. This risk is low with Howden.
Where Howden does not shape up as well is on its cash flow performance.
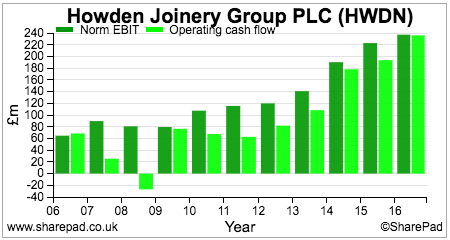
The business carries high levels of stock (inventories) in order to provide high levels of customer service whilst also making the vast majority of its sales on credit. This makes the business very working capital intensive when sales are growing. This is shown by the fact that operating profits don't tend to fully convert into operating cash flow, although the company did do a good job in this respect in 2016.
The weakish cash conversion at the operating or trading level flows through to the post tax or shareholder level. The company has a poor track record of converting profits (EPS) into free cash flow. This has increased in recent years due to increasing rates of investment in the business in the form of new depot fit outs, new warehousing and an upgrade to manufacturing plants.
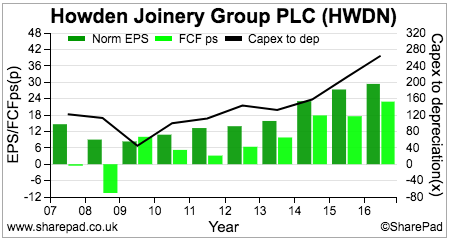
The company's cash conversion should not in any way be seen as a sign of profit manipulation in my view. It is just a result of the nature of the business and how it finances its growth.
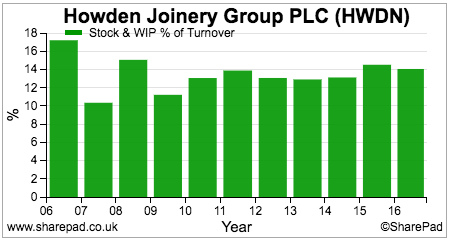
If stock levels and trade debtors as a percentage of sales were increasing significantly then I would be more concerned. They are not. Stock levels have been relatively consistent, as shown in the chart below, but have increased since 2014.
The one issue of stock performance that does need watching is the write down of stock values. These are not yet big enough to worry about but these have reduced profits by around £7m during the last couple of years
Stock levels in retail and manufacturing businesses need to be watched closely. They can be a source of profit manipulation and also a sign of possible impending trouble.
What I am going to describe is quite advanced financial analysis but hopefully something that some readers will find useful.
| Howden Inventory analysis | 2011 | 2012 | 2013 | 2014 | 2015 | 2016 |
|---|---|---|---|---|---|---|
| Raw materials | 3.7 | 3 | 3.4 | 4.2 | 5 | 5 |
| Work in progress (WIP) | 2.8 | 2.6 | 2.7 | 4.1 | 4.5 | 4.2 |
| Finished Goods | 123.5 | 121 | 129.3 | 147.2 | 184.4 | 196.9 |
| Gross value of inventories | 130 | 126.6 | 135.4 | 155.5 | 193.9 | 206.1 |
| Allowance against carrying value | -11.5 | -10.7 | -12 | -12.4 | -16.8 | -22.4 |
| Balance sheet value | 118.5 | 115.9 | 123.4 | 143.1 | 177.1 | 183.7 |
Analysis: | 2011 | 2012 | 2013 | 2014 | 2015 | 2016 |
| Sales | 853.8 | 887.1 | 956.5 | 1090.8 | 1220.2 | 1307.3 |
| Gross stocks as % of sales | 15.23% | 14.27% | 14.16% | 14.26% | 15.89% | 15.77% |
| Stocks as % of sales | 13.88% | 13.07% | 12.90% | 13.12% | 14.51% | 14.05% |
| Finished goods as % of sales | 14.46% | 13.64% | 13.52% | 13.49% | 15.11% | 15.06% |
| Allowances as % of gross value | 8.85% | 8.45% | 8.86% | 7.97% | 8.66% | 10.87% |
SharePad calculates the ratio of stocks to turnover which is very useful. You should be wary of a rising ratio as it may be a sign that demand for a company's products is softening and that stock values will have to be written down which will reduce profits. Overheads can be allocated to stock values and increases in stock levels can be a way of shifting expenses away from the income statement to the balance sheet to boost or preserve profits.
However, as with many things in financial analysis the devil is in the detail. A bit of digging can give you some valuable extra information about a company which might come in handy.
Above is the breakdown of Howden Joinery Group's balance sheet inventory/stock position. The year end values of raw materials, work in progress and finished goods are added together before an allowance for impairment (loss of value) is taken away to get the inventory value that is disclosed on the balance sheet.
Stocks have to be shown on the balance sheet at the lower of cost or net realisable value (NRV). If the value of stock falls below cost then the balance sheet value is written down and the reduction in value is charged as an expense against revenues and reduces profits.
What we can see with Howden is that the allowance against carrying value (the write down in value) as a percentage of the gross value of stocks increased significantly in 2016. Nearly 11% of the value of stocks has been impaired. Could this be a sign that the demand for some of Howdens' products is softening and this is requiring a reduction in value of stocks?
This reduction in value has depressed year end stock levels and makes the stock to sales ratio lower than it would be. We can see that excluding the value of impaired stocks, the stock to sales ratio has increased from 14.3% to 15.8% since 2014.
The other ratio worth calculating is the value of finished goods as a percentage of sales. A rise in this ratio can be a sign of a slowdown in sales ahead or poor inventory management. This ratio has stepped up from 2014 and is at its highest level since 2008.
I think this trend is worth keeping an eye on. It could of course be perfectly innocent. This is because the ratio is comparing a year end balance sheet value with a year's sales. If a company is building up stocks in advance of opening a new depot then the ratio could rise temporarily and might not be the sign of anything concerning going on.
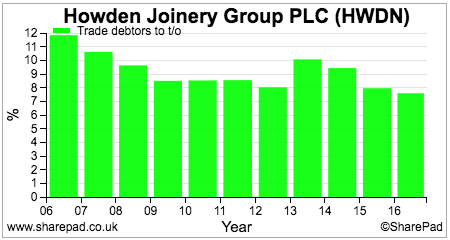
Trade debtors as a percentage of sales have been coming down which is a good sign of credit control. This also provides some reassurance that the big increase in credit accounts per depot is not artificially boosting sales.
The company has a good track record on bad debts. The provision for bad debts barely changed in 2016 at £8.7m and is comfortably less than 1% of sales. Invoices overdue fell slightly to £18.9m (1.4% of sales) but these have not been written off or reduced profits as the company believes that the credit quality remains intact for now. The company did expense £5m for bad debts in 2016 compared with £4.7m in 2015.
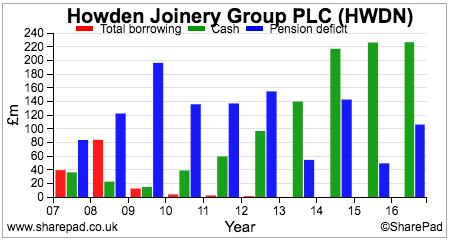
Howden's financial position is very healthy. It has no balance sheet debts and a cash balance of £226m at the end of last year. There is a small but manageable pension fund deficit.
The company is very prudent when it comes to its finances. The cash balance is essentially used to fund most of its working capital position throughout the year so that it doesn't have to resort to borrowing. £80m of surplus cash requirements have been used to buy back shares having spent £70m and £55m in 2015 and 2014.
Taking into account the significant off balance sheet lease liabilities, the company's financial position still looks very sound with fixed charge cover in 2016 at a very comfortable four times.
Outlook and valuation
Howdens has enjoyed a strong financial performance in recent years but the future looks as if it is going to be a little tougher.
Going forward a UK housing stock of more the 25 million gives a large addressable market for new kitchen purchases. Kitchens in many cases do eventually show their age and require some form of modernisation. I would also expect the maturation of Howden's depot network and a possible expansion of it up to 800 to see it take market share.
The more important question is where does the money come from to buy new kitchens? There are always people with savings but a significant driver of demand comes from the availability of credit and the ability to use home equity to finance a new kitchen.
I am not remotely surprised that Howdens has seen buoyant demand and posted strong like-for-like sales performances as house prices have surged since 2013. Now that house prices seem to have lost some of their fizz, I am also not surprised that Howdens' growth rate is slowing. Although to be fair to them it was not reasonable to expect its strong growth rates to continue.
However, it seems that there has been a significant slowdown in growth during the last 18 months.
Howdens depot LFL Sales
| Period | Reported LFL | wks x LFL | Incremental LFL % |
|---|---|---|---|
| 8w16 | 7.1 | 56.8 | 7.1 |
| 16w16 | 6.4 | 102.4 | 5.7 |
| 24w16 | 6.7 | 160.8 | 7.3 |
| 44w16 | 4 | 176 | 0.76 |
| 52w16 | 4.2 | 218.4 | 5.3 |
| 8w17 | 3.6 | 28.8 | 3.6 |
| 16w17 | 2.4 | 38.4 | 1.2 |
The table above shows Howdens' depot reported LFL sales and incremental LFL sales performance. To work out incremental sales you need to follow these steps:
- Multiply the reported percentage LFL sales performance by the number of weeks included. So for Howden's last trading statement in April for 16 weeks this would be 2.4 x 16 = 38.4.
- Go back to the previous trading update at the time of the full year results in February and repeat the exercise. 3.6 x 8 = 28.8.
- To work out the incremental LFL between February and April take 28.8 away from 38.4 and divide by 8 weeks. (38.4-28.8)/8 = 1.2.
We can see that LFL sales growth has slowed from a run rate of 7.1% at the beginning of 2016 to just 1.2% recently. This is with the benefit of a large number of maturing depots which should boost LFL and a price increase which was put through at the end of 2016. My guess is that the volume of sales at Howdens could be negative.
Then there are a series of rising cost pressures highlighted in the 2016 annual report:
- £10m from a 53rd week in 2017 which will bring no extra revenue.
- £15m from the new warehouse near Northampton.
- £5m extra pension costs.
- £20m increase in the cost of goods sold caused by the devaluation in the pound.
Given the weakening sales performance and rising cost, it is no surprise that analysts have been cutting their forecasts. Consequently, no profits growth is expected this year.
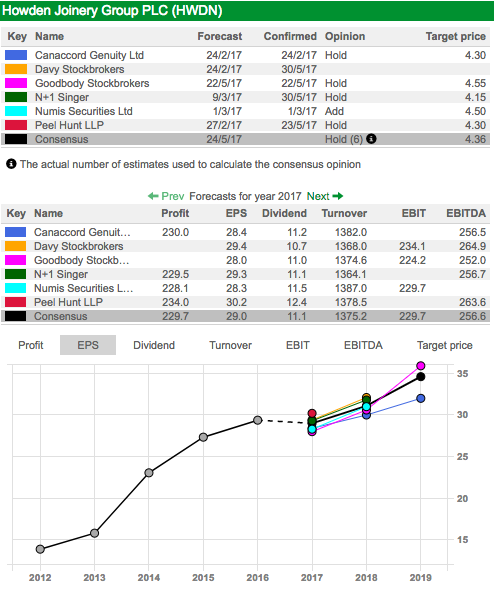
A modest recovery is expected in 2018 but I would not pay too much attention to this or 2019 forecasts. There is too much uncertainty around the UK economic outlook at the moment. The recent increase in inflation will also eat into household disposable incomes which make a new kitchen purchase harder to afford.
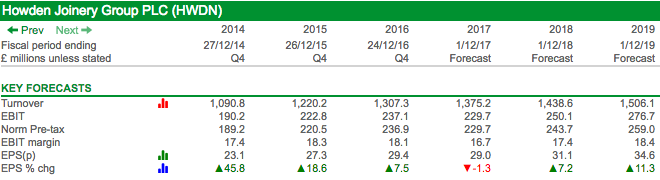
That said, I think Howden is a high quality business which should prove to be resilient in the face of tough markets. The valuation of its shares is not too frothy either given its high returns and debt free balance sheet.

I'm not saying they are a bargain but just under 16 times EPS for a high quality business such as this is not too bad. Its current trading profits explain nearly 82% of its enterprise value which shows that not much growth is priced into the shares.
This is the kind of high quality company that I wouldn't mind owning and tucking away in my own portfolio. What's putting me off is the short-term outlook. The trend in like-for-like sales is worrying when combined with rising costs.
Despite the management's proven ability to manage this business in good times and bad, my gut feeling is that forecasts are vulnerable to further reductions which raise the risk that the shares could fall from their current price. Definitely a share for the watch list though.
If you have found this article of interest, please feel free to share it with your friends and colleagues:
We welcome suggestions for future articles - please email me at analysis@sharescope.co.uk. You can also follow me on Twitter @PhilJOakley. If you'd like to know when a new article or chapter for the Step-by-Step Guide is published, send us your email address using the form at the top of the page. You don't need to be a subscriber.
This article is for educational purposes only. It is not a recommendation to buy or sell shares or other investments. Do your own research before buying or selling any investment or seek professional financial advice.

