Riding a retail roll out
Note: This in an advanced article best suited to more experienced and confident investors.
One of the most profitable investing strategies can be to buy the shares of rapidly expanding retail companies - when a company sets out a plan to open lots of new stores over a period of time. This is affectionately known as a retail roll out.
The problem facing investors is that shares in these companies are rarely the kind that you can buy and hold. Recent history is littered with examples of retail companies that have seen their share prices soar only to crash back to earth with a bang when the roll out turns sour.
So how does a private investor navigate the world of retail roll outs? In this article, I am going to look at a couple of examples of retail roll outs where the shares have soared then crashed to see what lessons we can learn when looking at current roll out opportunities.
I will be using Restaurant Group (LSE:RTN) and Dunelm (LSE:DNLM) as case studies of how retail roll outs can pan out. I will then try and apply this to the current retail roll out of Patisserie Holdings (LSE:CAKE).
Phil Oakley's debut book - out now!
Phil shares his investment approach in his new book How to Pick Quality Shares. If you've enjoyed his weekly articles, newsletters and Step-by-Step Guide to Stock Analysis, this book is for you.
Share this article with your friends and colleagues:
Why do some investors like retail roll outs?
Profitable retail roll out shares tend to have the following characteristics:
- A differentiated business model which appeals to lots of customers.
- Highly profitable with high profit margins and high returns on invested capital (ROCE).
- Good free cash flow generation.
- The opportunity to open up more stores with the same financial characteristics across the same country and possibly into new markets as well. This is the roll out.
The opportunity to spend lots of money on assets with a high ROCE means there is potential for the profits of the company to soar. This kind of scenario is an investor's dream. City analysts start factoring rosy growth projections into their forecasts. Unsurprisingly this attracts lots of investors to the shares who push up the share price and big gains begin to accrue to them.
When roll outs start to go wrong
During the first few years of a retail roll out everything can seem fine. The profits keep growing and the underlying performance of the existing business seems to be good as measured by things such as like-for-like sales growth. Investors believe that they are owning a quality growth stock.
Then things can begin to change:
- The business matures and begins to reach an optimal size. The effect on opening new stores on the business as a whole starts to reduce and growth rates fall or even start to shrink.
- Competition enters the market to grab a share of the high returns being made. This pushes down prices, profits and ROCE for all companies.
- The company over-expands and starts cannibalising its own business. For example, a new shop is opened too close to one of the company's existing shops and starts taking sales from it. This can reduce the profits of both the new store and the existing one.
- The company struggles to match the lofty profit expectations of analysts and investors. It warns on profits, the shares collapse and the valuations attached to the shares falls (read a lower PE ratio).
- Investors lose money.
Let's have a look at some real life examples of retail roll outs to see how this can play out.
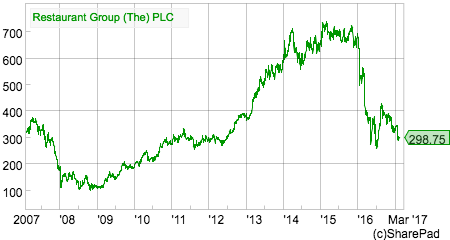
Case study 1: Restaurant Group
Restaurant Group shares used to be a firm investor favourite with the shares soaring from the beginning of 2012 and staying high until the beginning of 2016.
Everything seemed to be going well. Turnover and profits were growing nicely and the profit margins and ROCE were high and very consistent.
In the table below I've calculated the ROCE and profit margin of the business as a whole and of the incremental growth.
| RTN (£m) | 2006 | 2007 | 2008 | 2009 | 2010 | 2011 | 2012 | 2013 | 2014 | 2015 |
|---|---|---|---|---|---|---|---|---|---|---|
| Turnover | 314 | 366.7 | 416.5 | 435.7 | 465.7 | 487.1 | 532.5 | 579.6 | 635.2 | 685.4 |
| EBIT | 61.8 | 70.7 | 81.1 | 79.4 | 86.9 | 89.8 | 99 | 107.1 | 114.7 | 126.4 |
| Capital employed | 444.5 | 519.7 | 558.7 | 564 | 601.8 | 614.5 | 687.9 | 743.9 | 795.2 | 869.2 |
| Avg Capital Employed | 482.1 | 539.2 | 561.3 | 582.9 | 608.2 | 651.2 | 715.9 | 769.6 | 832.2 | |
| ROCE | 14.70% | 15.00% | 14.10% | 14.90% | 14.80% | 15.20% | 15.00% | 14.90% | 15.20% | |
| EBIT margin | 19.70% | 19.30% | 19.50% | 18.30% | 18.70% | 18.40% | 18.60% | 18.50% | 18.10% | 18.40% |
Turnover change | 52.7 | 49.8 | 19.2 | 30 | 21.4 | 45.4 | 47 | 55.6 | 50.2 | |
| EBIT change | 8.9 | 10.4 | -1.7 | 7.5 | 2.9 | 9.2 | 8.1 | 7.6 | 11.7 | |
| Capital Employed Change | 75.1 | 39 | 5.3 | 37.9 | 12.7 | 73.4 | 56 | 51.3 | 74 | |
| Incremental: | ||||||||||
| EBIT margin | 16.90% | 20.90% | -9.00% | 25.00% | 13.70% | 20.20% | 17.20% | 13.70% | 23.30% | |
| Capital Turnover | 0.7 | 1.3 | 3.6 | 0.8 | 1.7 | 0.6 | 0.8 | 1.1 | 0.7 | |
| ROCE | 11.90% | 26.80% | -32.60% | 19.80% | 23.10% | 12.50% | 14.50% | 14.80% | 15.80% | |
| EBIT, EBIT margin, Capital employed and ROCE values are lease-adjusted. | ||||||||||
I know that hindsight is a wonderful thing but could investors have spotted the trouble the company was about to experience?
There are two particular things that I think investors need to watch out for:
- Slowing like-for-like (LFL) sales growth.
- A high valuation which implies strong future profits growth.
These two scenarios above are at odds with each other. They mean that a share is often overvalued.
Have a look at the table below to see what was going on at Restaurant Group.
| Year | Stores | Net Change | LFL sales(%) | Sales | Sales growth | EBIT | margin | EPS | Avg Share Price | PE |
|---|---|---|---|---|---|---|---|---|---|---|
| 2016 | 493 | -13 | -3.9 | 710.7 | 3.69% | 77.7 | 10.93% | 29.3 | 391 | 13.3 |
| 2015 | 506 | 34 | 1.5 | 685.4 | 7.90% | 88.9 | 12.97% | 33.5 | 689 | 20.6 |
| 2014 | 472 | 27 | 2.5 | 635.2 | 9.59% | 80.3 | 12.64% | 29.9 | 637 | 21.3 |
| 2013 | 445 | 23 | 3.5 | 579.6 | 8.85% | 74.9 | 12.92% | 26.9 | 501 | 18.6 |
| 2012 | 422 | 22 | 4.5 | 532.5 | 9.32% | 68.7 | 12.90% | 24.4 | 323 | 13.2 |
| 2011 | 400 | 11 | 3.25 | 487.1 | 4.60% | 63.1 | 12.95% | 23.4 | 292 | 12.5 |
| 2010 | 389 | 22 | -1 | 465.7 | 6.89% | 60.1 | 12.91% | 20.5 | 239 | 11.7 |
In 2011, the company posts a significant improvement in LFL sales. LFL sales then remain strong as it opens a significant number of new restaurants.
Over the next three years, the excitement builds and the average share price goes from 292p to 637p. The average PE ratio goes from 12.5 to 21.3. This is a high valuation for most shares and requires many years of strong profits growth to justify it.
If growth disappoints then the high valuation leaves investors very exposed to a sharp share price fall. This is what happened.
What investors in retail companies need to try and understand is that they can be tricked into thinking there is genuine growth when all that is happening is a natural maturation process of a store.
For any new business, it takes some time to reach its sales potential. This is true for new shops and restaurants. However, the maturation of new restaurants boosts like-for-like sales. Sales from new restaurants are excluded from LFL sales in their first year but are included in the second year.
So opening up lots of new restaurants can give the impression of strong underlying sales growth when all that is really happening is a natural maturation process playing out. When potential sales are reached the growth rate can be slow or non-existent.
The effect on a retail roll out becomes biggest when the new stores opened as a percentage of the total store base gets smaller. The maturation effect begins to wear off and LFL sales growth begins to slow down. The company is having to spend money to grow in order to mask an underlying business which isn't really growing that much. This is not the high quality growth which should command a high stock market valuation.
This began to happen to Restaurant Group in 2014 but the valuation of the shares stayed high. Growth slowed even more in 2015 before falling off a cliff in 2016. The share price followed and now the shares trade on a forecast PE of 10.
The slowdown in LFL sales growth and high valuation was a warning sign that many investors ignored.
Case study 2: Dunelm Group
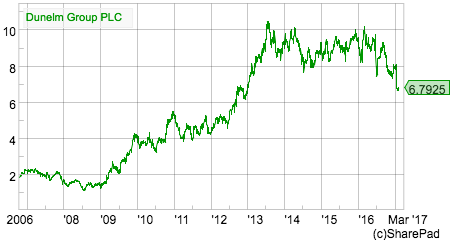
Dunelm had many of the same characteristics of Restaurant Group. In fact, its ROCE was even better. A rapid roll out of new stores turbocharged profits growth. Some investors made lots of money by riding the rollout.
| Dunelm | 2006 | 2007 | 2008 | 2009 | 2010 | 2011 | 2012 | 2013 | 2014 | 2015 | 2016 |
|---|---|---|---|---|---|---|---|---|---|---|---|
| Turnover | 315.2 | 354.7 | 391.8 | 423.8 | 492.8 | 538.5 | 603.7 | 677.2 | 730.2 | 835.8 | 880.9 |
| EBIT | 46.4 | 51.6 | 59 | 63.8 | 87.2 | 97.2 | 109.7 | 122.5 | 133.6 | 141.8 | 149.2 |
| Capital employed | 207.3 | 228.2 | 236.6 | 272.8 | 280.1 | 347.4 | 414.6 | 459.8 | 471.6 | 512.7 | 527.3 |
| Avg Capital Employed | 217.8 | 232.4 | 254.7 | 276.4 | 313.7 | 381 | 437.2 | 465.7 | 492.1 | 520 | |
| ROCE | 23.70% | 25.40% | 25.10% | 31.50% | 31.00% | 28.80% | 28.00% | 28.70% | 28.80% | 28.70% | |
| EBIT margin | 14.70% | 14.50% | 15.10% | 15.10% | 17.70% | 18.10% | 18.20% | 18.10% | 18.30% | 17.00% | 16.90% |
Turnover change | 39.5 | 37.1 | 32 | 69.1 | 45.6 | 65.3 | 73.5 | 53 | 105.6 | 45.1 | |
| EBIT change | 5.2 | 7.4 | 4.8 | 23.4 | 10.1 | 12.4 | 12.8 | 11.2 | 8.1 | 7.5 | |
| Capital Employed Change | 20.8 | 8.4 | 36.2 | 7.4 | 67.3 | 67.2 | 45.2 | 11.8 | 41.1 | 14.6 | |
| Incremental: | |||||||||||
| Profit margin | 13.10% | 19.90% | 15.10% | 33.80% | 22.00% | 19.10% | 17.40% | 21.10% | 7.70% | 16.60% | |
| Capital Turnover | 1.9 | 4.4 | 0.9 | 9.4 | 0.7 | 1 | 1.6 | 4.5 | 2.6 | 3.1 | |
| ROCE | 24.90% | 87.80% | 13.30% | 318.00% | 15.00% | 18.50% | 28.30% | 94.50% | 19.70% | 51.20% | |
| EBIT, EBIT margin, Capital employed and ROCE values are lease-adjusted. | |||||||||||
But the same risks of slowing LFL sales growth and a high valuation presented themselves.
| Year | Stores | Net Change | LFL sales(%) | Sales | Sales growth | EBIT | margin | EPS | Avg Share Price | PE |
|---|---|---|---|---|---|---|---|---|---|---|
| 2016 | 152 | 4 | 1 | 880.9 | 5.40% | 129 | 14.64% | 50.2 | 918 | 18.29 |
| 2015 | 148 | 12 | 3.4 | 835.8 | 14.46% | 122.7 | 14.68% | 47.4 | 871 | 18.38 |
| 2014 | 136 | 10 | 2.1 | 730.2 | 7.83% | 117 | 16.02% | 44.4 | 931 | 20.97 |
| 2013 | 126 | 11 | 1.7 | 677.2 | 12.17% | 106.8 | 15.77% | 40.1 | 717 | 17.88 |
| 2012 | 115 | 12 | 3.1 | 603.7 | 12.11% | 95.2 | 15.77% | 35.1 | 473 | 13.48 |
| 2011 | 103 | 9 | -0.6 | 538.5 | 9.27% | 84 | 15.60% | 29.6 | 440 | 14.86 |
| 2010 | 94 | 9 | 8 | 492.8 | 16.28% | 75.5 | 15.32% | 26.9 | 346 | 12.86 |
| 2009 | 85 | 8 | 6.3 | 423.8 | 8.17% | 52.6 | 12.41% | 18.6 | 169 | 9.09 |
| 2008 | 77 | 7 | 2.5 | 391.8 | 10.46% | 49.2 | 12.56% | 16.4 | 174 | 10.61 |
| 2007 | 70 | 6.1 | 354.7 | 42.9 | 12.09% | 13.2 | 213 | 16.14 |
Is a business with underlying sales growth of 1% really worth over 18 times earnings? Maybe, maybe not. The stock market has made the judgement that it is not.
Dunelm may earn a high ROCE but profits will shrink in 2017 and the shares are now on a forecast PE of 14.8 times having fallen sharply in price since last summer.
Investors have suffered from the double whammy of falling earnings and a falling PE multiple (known as multiple compression) at the same time. This is one of the biggest risks - if not the biggest - of owning the shares of a retail roll out. You can still lose money from multiple compression even if profits are growing because the growth rate is slowing down.
Case study 3: Is Patisserie Holdings still a profitable retail roll out for investors?
Patisserie Holdings is best known for its Patisserie Valerie up-market cake and sandwich shops. I see the company as something in between a coffee shop and a restaurant. It offers premium products which it describes as "affordable treats".
I think it is a good business as shown by the numbers in the table below.
| CAKE £m | 2011 | 2012 | 2013 | 2014 | 2015 | 2016 |
|---|---|---|---|---|---|---|
| Turnover | 40.5 | 49.5 | 60.1 | 76.6 | 91.9 | 104.1 |
| EBIT | 9 | 10.7 | 13.4 | 16.8 | 20 | 23.5 |
| Capital employed | 65.1 | 76.3 | 94.8 | 125 | 145.5 | 170.6 |
| Avg Cap Employed | 70.7 | 85.5 | 109.9 | 135.3 | 158 | |
| ROCE | 15.10% | 15.70% | 15.30% | 14.80% | 14.90% | |
| EBIT margin | 21.60% | 22.30% | 21.90% | 21.70% | 22.60% | |
Turnover change | 9 | 10.6 | 16.5 | 15.3 | 12.2 | |
| EBIT change | 1.7 | 2.8 | 3.4 | 3.2 | 3.6 | |
| Capital Employed Change | 11.2 | 18.5 | 30.3 | 20.4 | 25.1 | |
| Incremental: | ||||||
| EBIT margin | 18.90% | 26.00% | 20.30% | 20.80% | 29.20% | |
| Capital Turnover | 0.8 | 0.6 | 0.5 | 0.7 | 0.5 | |
| ROCE | 15.20% | 14.90% | 11.10% | 15.50% | 14.20% | |
| EBIT, EBIT margin, Capital employed and ROCE values are lease-adjusted. | ||||||
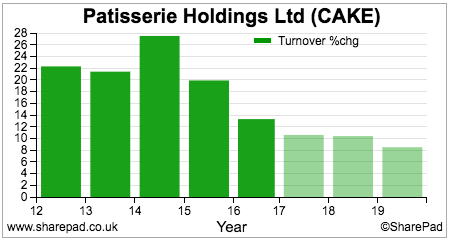
The company has grown rapidly through acquisitions and opening up lots of new shops. It currently has 184 shops and thinks that there is scope for at least another 250 across the UK.
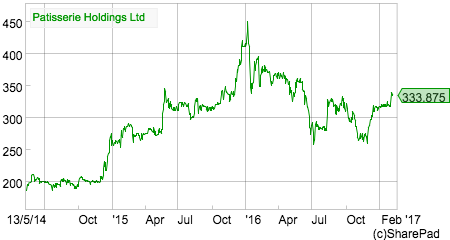
This has excited some investors, but a look at the share price chart above shows that the euphoria of a retail roll out has already happened to some extent. The shares increased significantly since floating on AIM in May 2014 but have fallen back significantly since peaking at the beginning of 2016.
According to SharePad the shares trade on a forecast PE of 20.9 times at a share price of 334p. Given that this is a similar valuation which represented the high water mark for the shares of Dunelm and Restaurant Group, could Patisserie Holdings be another retail roll out trap for the unwary or are we looking at something different here?
The company does not give out a LFL sales figure in its financial reports which makes it difficult to judge how the underlying business is performing. I would argue that you need to know this in order to properly evaluate the potential success of a retail roll out.
| Year | Stores | Net Change | LFL sales(%) | Sales | Sales growth | EBIT | margin | EPS | Share Price | PE |
|---|---|---|---|---|---|---|---|---|---|---|
| 2016 | 184 | 18 | 0 | 104.1 | 13.28% | 17.2 | 16.52% | 13.6 | 342 | 25.15 |
| 2015 | 166 | 18 | 0 | 91.9 | 19.97% | 14.6 | 15.89% | 11.3 | 274 | 24.25 |
| 2014 | 148 | 40 | 0 | 76.6 | 27.45% | 12.1 | 15.80% | 11.1 | 197 | 17.75 |
| 2013 | 108 | 108 | 0 | 60.1 | 21.41% | 9.6 | 15.97% | 6.8 | 0 | 0 |
What we can see is that sales growth is slowing from an impressive rate but profit margins have been increasing. That said, the shares have attracted a high valuation with an average PE for the year to September 2016 of over 25 times.
There has already been a degree of PE compression from 25 to 21 and this is shown in the relatively lacklustre performance of the shares during the last six months although they have rallied recently.
Yet sales growth is expected to keep on slowing. This is to be expected as opening 20 new shops a year becomes a smaller incremental part of the overall business.
A further clue on the underlying growth of the business can be gleaned from the company's 2016 full year results presentation to investors. We can see that the bulk of profit improvement came from three sources:
- New shops
- A full year effect of shops opened last year
- Some cost savings
This is summarised nicely in the "EBITDA Bridge" analysis provided by the company:
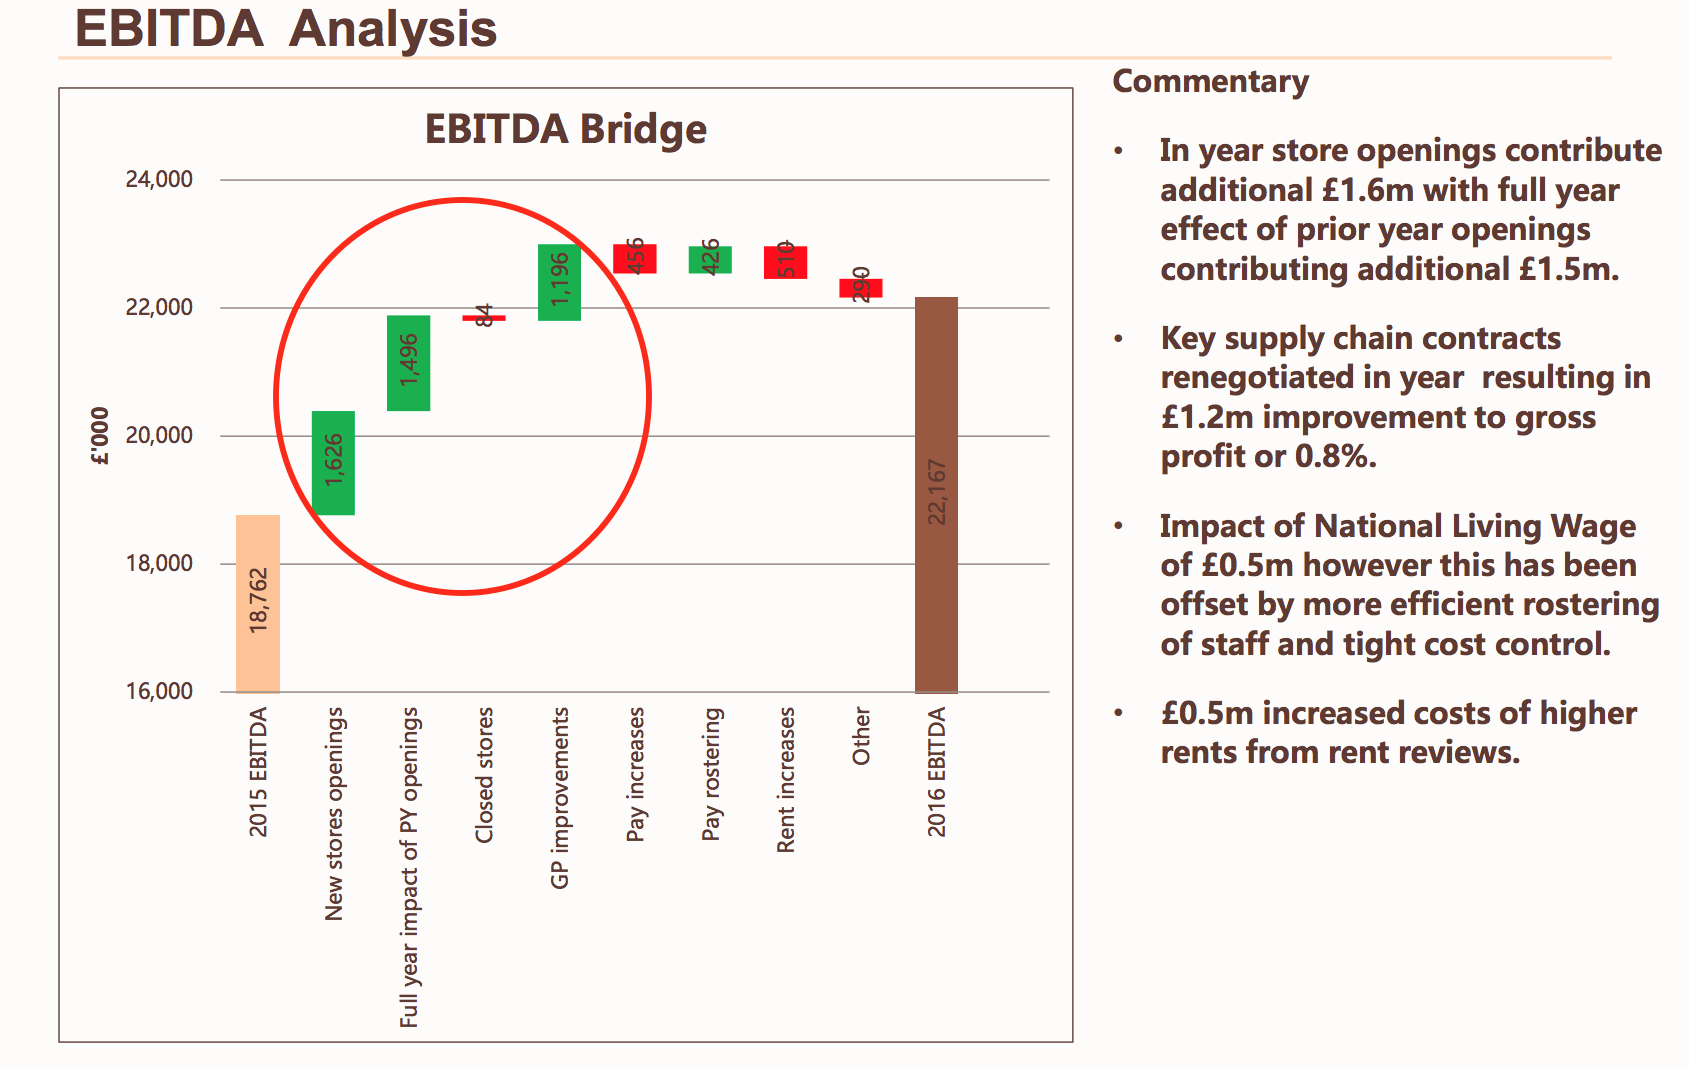
Whilst there should be a further full year effect of new stores going forward, we don't really know how the underlying business is performing from the commentary given by the company.
However, some rough and ready analysis shows that sales and profit per store has gone up slightly.
| Avg no of stores | Sales per store | EBIT per store | |
|---|---|---|---|
| 2016 | 175 | £594,857 | £98,286 |
| 2015 | 157 | £585,350 | £92,994 |
| 2014 | 128 | £598,438 | £94,531 |
Valuing a retail roll out
This is not easy and is subject to a lot of guesswork. Using some of the information from the table above, you can model a roll out of stores and forecast the profitability of the company. This is what professional analysts will do.
Remember that these models are subject to the garbage in, garbage out test. You must try and make your assumptions as realistic and conservative as possible. Here are my assumptions:
- 20 stores a year opened for the next 10 years. No store closures.
- Sales per average store of £600,000 in 2017 and then increasing at 2% per year.
- No assumption of declining sales in existing shops.
- Constant EBIT margin of 16.5%. No benefits from operating leverage are assumed but no margin pressure from rising wages, business rates or rents either.
- No interest received or paid. The company may build a cash balance and have a small amount of interest receivable going forward so this might be a tiny bit unfair.
- Tax rate of 19% 2017-19 and 18% thereafter.
- Constant number of shares of 100 million.
- Share price forecast on PE of 21 in 2017. I then factor in 1 point of PE compression a year to reflect slowing growth. At the end of year 10, the shares are assumed to be trading on a PE of 12. This is factoring in an all important margin of safety.
- The future share prices are discounted to a value today at a discount rate of 7%.
My simple forecast gives EPS of 15.6p for 2017 and 17.5p for 2018. The respective consensus EPS is 16p and 18p. I am not a million miles away but at the low end of the forecast range and therefore on the conservative side.
| CAKE | 2017 | 2018 | 2019 | 2020 | 2021 | 2022 | 2023 | 2024 | 2025 | 2026 |
|---|---|---|---|---|---|---|---|---|---|---|
| Opening no. stores | 184 | 204 | 224 | 244 | 264 | 284 | 304 | 324 | 344 | 364 |
| Closing no. stores | 204 | 224 | 244 | 264 | 284 | 304 | 324 | 344 | 364 | 384 |
| Avg stores | 194 | 214 | 234 | 254 | 274 | 294 | 314 | 334 | 354 | 374 |
| Sales per store (£k) | 600 | 612 | 624 | 637 | 649 | 662 | 676 | 689 | 703 | 717 |
| Sales (£m) | 116.4 | 130.97 | 146.07 | 161.73 | 177.95 | 194.76 | 212.17 | 230.2 | 248.86 | 268.18 |
| EBIT margin | 16.50% | 16.50% | 16.50% | 16.50% | 16.50% | 16.50% | 16.50% | 16.50% | 16.50% | 16.50% |
| EBIT (£m) | 19.2 | 21.6 | 24.1 | 26.7 | 29.4 | 32.1 | 35 | 38 | 41.1 | 44.2 |
| Interest | 0 | 0 | 0 | 0 | 0 | 0 | 0 | 0 | 0 | 0 |
| Pre-tax profit (£m) | 19.2 | 21.6 | 24.1 | 26.7 | 29.4 | 32.1 | 35 | 38 | 41.1 | 44.2 |
| Tax rate | 19% | 19% | 19% | 18% | 18% | 18% | 18% | 18% | 18% | 18% |
| Taxation (£m) | -3.6 | -4.1 | -4.6 | -4.8 | -5.3 | -5.8 | -6.3 | -6.8 | -7.4 | -8 |
| Post-tax profit (£m) | 15.6 | 17.5 | 19.5 | 21.9 | 24.1 | 26.4 | 28.7 | 31.1 | 33.7 | 36.3 |
| Shares in issue (m) | 100 | 100 | 100 | 100 | 100 | 100 | 100 | 100 | 100 | 100 |
| EPS (p) | 15.6 | 17.5 | 19.5 | 21.9 | 24.1 | 26.4 | 28.7 | 31.1 | 33.7 | 36.3 |
| PE | 21 | 20 | 19 | 18 | 17 | 16 | 15 | 14 | 13 | 12 |
| Fc Share Price | 326.7 | 350.1 | 370.9 | 393.9 | 409.3 | 421.6 | 430.6 | 436 | 437.7 | 435.4 |
| Value today at 7% discount rate | 314.1 | 314.6 | 311.5 | 309.1 | 300.2 | 289 | 275.9 | 261.1 | 245 | 227.7 |
If my rough and ready forecast is anywhere near being accurate, then the share price of Patisserie Holdings will go up. However, it is telling me that a fair value for the shares is 314p (333p at the time of writing). Perhaps this is a retail rollout where the best ride has already been had?
I'll leave you to decide for yourselves.
Phil Oakley's debut book - out now!
Phil shares his investment approach in his new book How to Pick Quality Shares. If you've enjoyed his weekly articles, newsletters and Step-by-Step Guide to Stock Analysis, this book is for you.
If you have found this article of interest, please feel free to share it with your friends and colleagues:
We welcome suggestions for future articles - please email me at analysis@sharescope.co.uk. You can also follow me on Twitter @PhilJOakley. If you'd like to know when a new article or chapter for the Step-by-Step Guide is published, send us your email address using the form at the top of the page. You don't need to be a subscriber.
This article is for educational purposes only. It is not a recommendation to buy or sell shares or other investments. Do your own research before buying or selling any investment or seek professional financial advice.