A different way to scrutinise a company's financial performance
This article is more suited to experienced investors.
When investors are examining the financial performance of a company they will usually look at it on a yearly basis. They also often look at trends in key measures from year to year over a period of time.
This is a perfectly sensible way to go about analysing a company and is something I always do myself. But why stop at annual performance when trying to weigh up whether a company might be a good or bad investment? After all, changes from one year to the next rarely tell you how successful or otherwise a company has been.
One of the things I like to do in addition to basic annual and trend analysis is to look at companies over a five year period. I find five years as a reasonable length of time to see if a company's strategy is working or not.
This kind of simple analysis can be extremely powerful and revealing and is actually very simple to carry out. It can be done with a pen, a piece of paper and a calculator. Alternatively, you could use a spreadsheet.
In this article, I am going to show you how it can be done in SharePad. The appeal of using SharePad for this type of analysis is that once you have set up the calculations you don't have to do them again. You can then easily apply the same analysis to any share or group of shares.
Want to learn how to analyse shares like a professional? Download our FREE guide.
Sign-up to our mailing list to receive a PDF of our Step-by-Step Guide to Investing.
Share this article with your friends and colleagues:
A five year analysis of UK Food & Drug Retailers
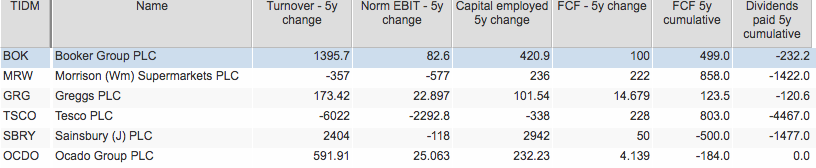
Above is a table of the FTSE 350 Food and Drug retailers sector. You can create it in SharePad by doing the following steps.
- Select FTSE 350 list.
- Click on the Filter button and select Apply sector filter.
- Select the Food & Drug Retailers sector.
- Add the required columns (you could create a new Setting).
I've added columns showing me the change in Turnover, EBIT, Capital employed and Free cash flow (FCF) over the last five years. I've also added the cumulative Free cash flow generated and Dividends paid over the same period.
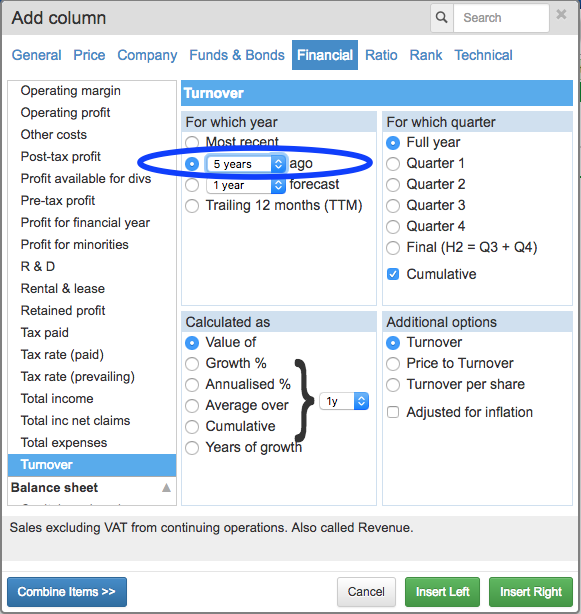
In SharePad, it is very easy to get the absolute changes in the value of financial variables over a range of up to ten years.
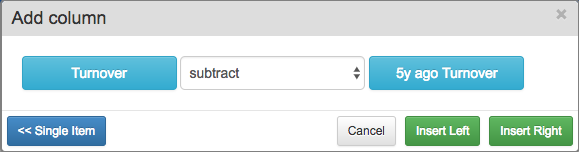
For example, subtracting the 5y ago turnover value from the current turnover value will give you the increase/decrease in turnover over the 5y period.
You do this using the Combine item feature in the Add column function as shown below.
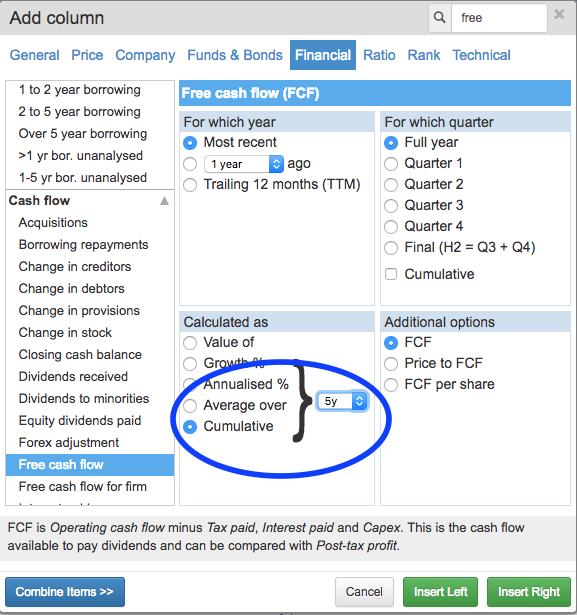
To get a measure of cumulative financial data, simply select Cumulative in the Add column dialog and select the number of years you want that cumulative data for as shown below.
What I am looking for is the change in value of these key variables to give me a better picture of how a company has been getting on. I find it really useful in giving a company's financial performance a much wider perspective.
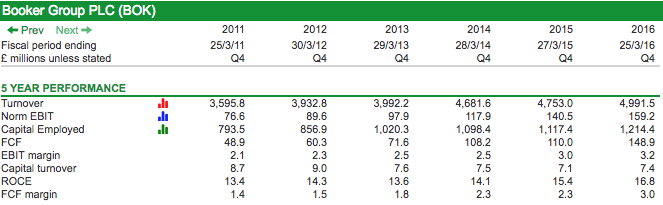
Let's look a bit more closely at some companies in the sector. Booker (LSE:BOK) has performed very well over the last five years. I can quickly see that during the last five years:
- Turnover has increased by £1.4bn
- Trading profit (EBIT) has increased by £82.6m
- Capital employed has increased by £420.9m
- Free cash flow has increased by £100m.
- £499m of cumulative free cash flow has been generated.
- £232m of cumulative dividends have been paid.
These figures all look very encouraging, but I can get even more information out of them by calculating some five year financial ratios based on these changes:
- EBIT margin = £82.6m/£1395.7m = 5.9%
- Capital turnover = £1395.7/£420.9m = 3.31
- ROCE = £82.6m/£420.9m = 19.6%
- Free cash flow margin = £100m/£1395.7m = 7.2%
I can then put this into context with the trend in the company's annual performance (I've used a custom results table in SharePad to show these below). It is clear that over the last five years Booker's additional capital invested has been earning higher profit margins, ROCE and free cash flow margins than the underlying business as a whole. As a result, those key performance measures have been trending up.
This analysis is very useful in helping to focus your research efforts on the company and could include the following questions:
- Can the company keep investing money at the same high ROCE or better?
- Has the growth come from investing in the existing business or from buying other companies?
- What is the rate of underlying sales growth? Have the sales from new assets (stores) matured?
- Is the source of profit margin improvement sustainable? Has it come from sales growth or cost cutting?
- Will capital expenditure have to increase? What will be the impact on future free cash flow?
Don't worry if you don't know how to answer the questions above - as I said at the beginning of the article, this is quite advanced analysis.
At the opposite end of the performance scale is Sainsbury's. Here we can see that over the last five years:
- Turnover has increased by £2.4bn.
- Trading profit (EBIT) has fallen by £118m.
- Capital employed has increased by £2.9bn.
- Free cash flow has increased by £50m.
- There has been a cumulative free cash outflow of £500m.
- £1.47bn of dividends have been paid.
This looks like a classic case of value destruction. Nearly £3bn of extra money (including rented assets) has produced a fall in profit and £500m of cash flowing out of the business. The company has clearly been borrowing - or relying on asset sales - to pay its dividends as it has not generated anywhere near enough free cash flow.
Its five year financial ratios are:
- EBIT margin = -£118m/£2404m = -4.9%
- Capital turnover = £2404m/£2942m = 0.82
- ROCE = -£118m/£2942m = -4%
- Free cash flow margin = £50m/£2404m = 2.1%
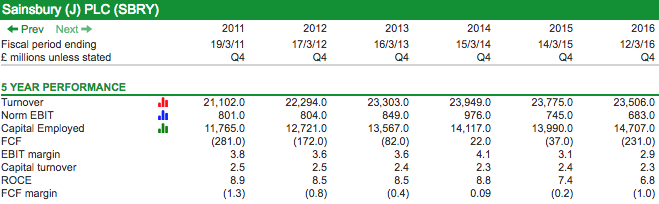
Unsurprisingly, Sainsbury's financial performance has been getting worse. It has been throwing good money after bad which begs the following questions:
- The company needs to stop spending. How much can it reduce investment by and still remain competitive?
- How low can profit margins go? Is there a plan to stop the rot?
- Can the company ever generate meaningful free cash flow?
- Does the low ROCE suggest the balance sheet value of fixed assets are overvalued? Will an asset write down stop dividends being paid due to the lack of distributable reserves?
- Does weak free cash flow mean a very big dividend cut in the future?
By looking at absolute changes in values over five years you can get a clear picture of how good or bad a company's or sector's financial performance has been. The dire state of the food retail sector is made abundantly clear with this type of analysis.
If you need any help setting up a sector filter, columns or custom results table in SharePad, please call our friendly support team on 020 7749 8555. Or use the video tutorials in our SharePad Training Zone.
Want to learn how to analyse shares like a professional? Download our FREE guide.
Sign-up to our mailing list to receive a PDF of our Step-by-Step Guide to Investing.
If you have found this article of interest, please feel free to share it with your friends and colleagues:
We welcome suggestions for future articles - please email me at analysis@sharescope.co.uk. You can also follow me on Twitter @PhilJOakley. If you'd like to know when a new article or chapter for the Step-by-Step Guide is published, send us your email address using the form at the top of the page. You don't need to be a subscriber.
This article is for educational purposes only. It is not a recommendation to buy or sell shares or other investments. Do your own research before buying or selling any investment or seek professional financial advice.

