Stock Watch: Sports Direct
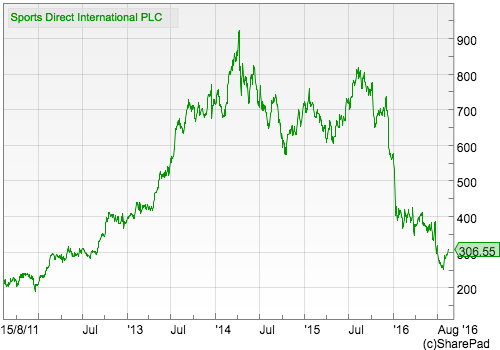
Sports Direct is arguably better known for the antics of its founder than its sportswear shops. The company's shares had been on a storming run and peaked at over 900p back in 2014. Since then the path has been a lot rockier.
The closing months of 2015 and early part of 2016 saw the shares crash as the company became embroiled in controversy about working practices at its main distribution centre and trading got weaker. They have now fallen over two thirds from their peak and there is no doubt that they are extremely unpopular just now.
Unpopularity often creates opportunity for investors who are prepared to go against the crowd. What you need to be reasonably certain of is that you are not catching a falling knife and that the company concerned can recover.
I am going to put Sports Direct under the ShareScope microscope to see what's been going on and whether the company might be worth a closer look by contrarian investors.
Want to learn how to analyse shares like a professional? Download our FREE guide.
Sign-up to our mailing list to receive a PDF of our Step-by-Step Guide to Investing.
Share this article with your friends and colleagues:
Sales and profit history
You can see from the chart below that Sports Direct has a good track record at improving its sales and profits over the years. Its ownership of many sportswear brands has allowed it to price its products very aggressively against its competitors and sell lots of them.
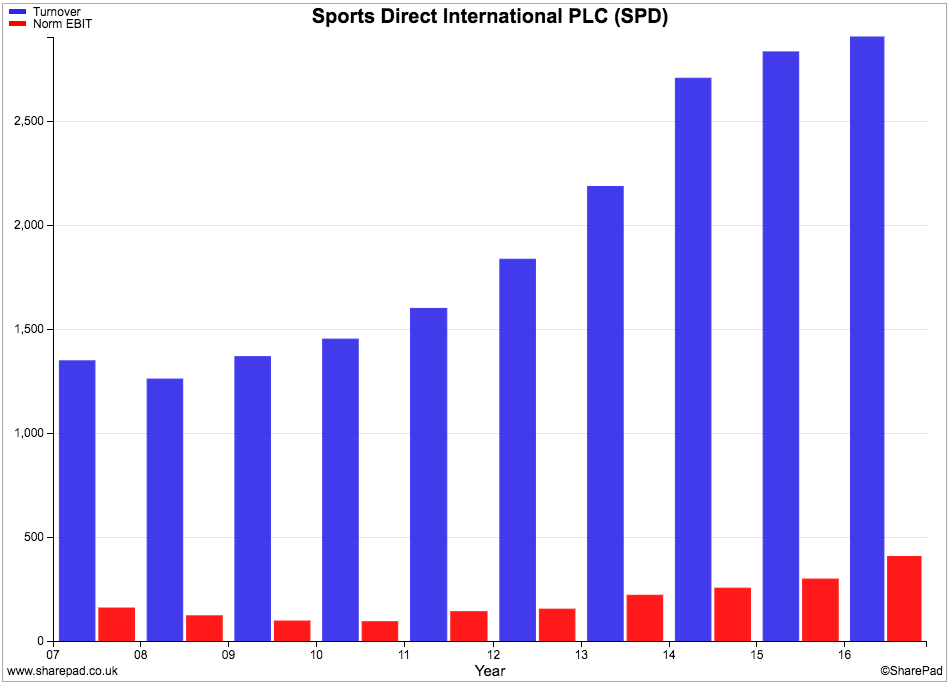
When this strategy has been combined with opening up lots of new shops and buying up competitors it has proven to be a recipe for growth. The year to April 2016 saw growth slow down quite dramatically from the rates seen in previous years.
Financial Returns
Even when factoring in rented stores, the company has generally been able to get a decent bang for its buck on the money it invests. Lease-adjusted ROCE was over 18% last year and has averaged over 15% for the last decade.
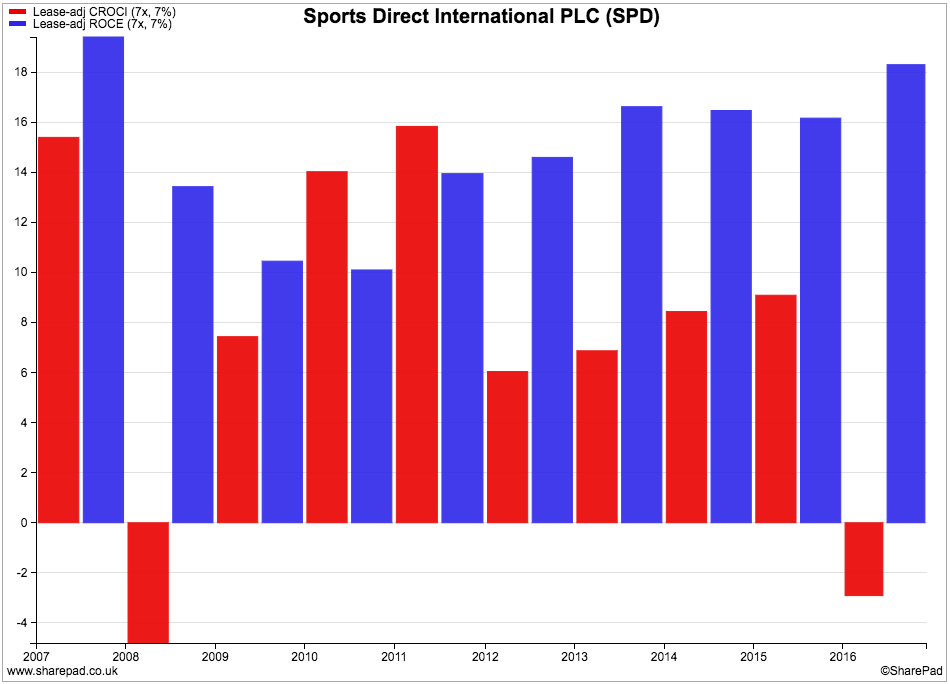
Cash flow returns (CROCI) have not been as good. CROCI was negative in 2016 and has only averaged 7.5% during the last decade. That's not a particularly good number but one that is understandable from a company that has expanded rapidly. I'll have a lot more to say on the company's free cash flow performance shortly.
Taking a closer look at the makeup of Sports Direct's returns we can see that the improvement in ROCE in recent years has been significantly driven by improvements in operating margins. Capital turnover has fallen. When you come across a situation such as this you need to try and understand why this has happened.
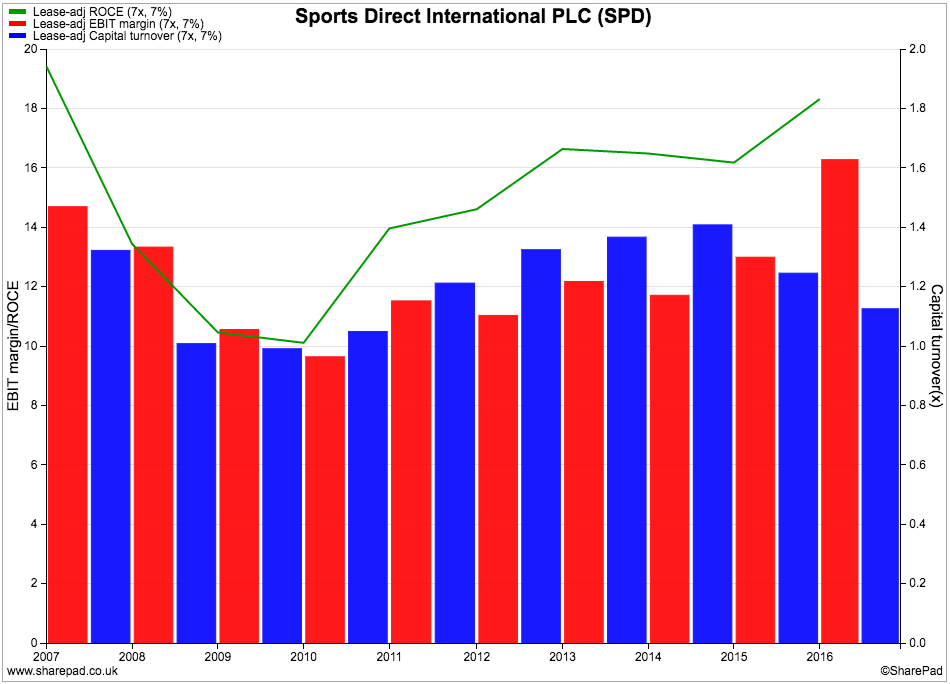
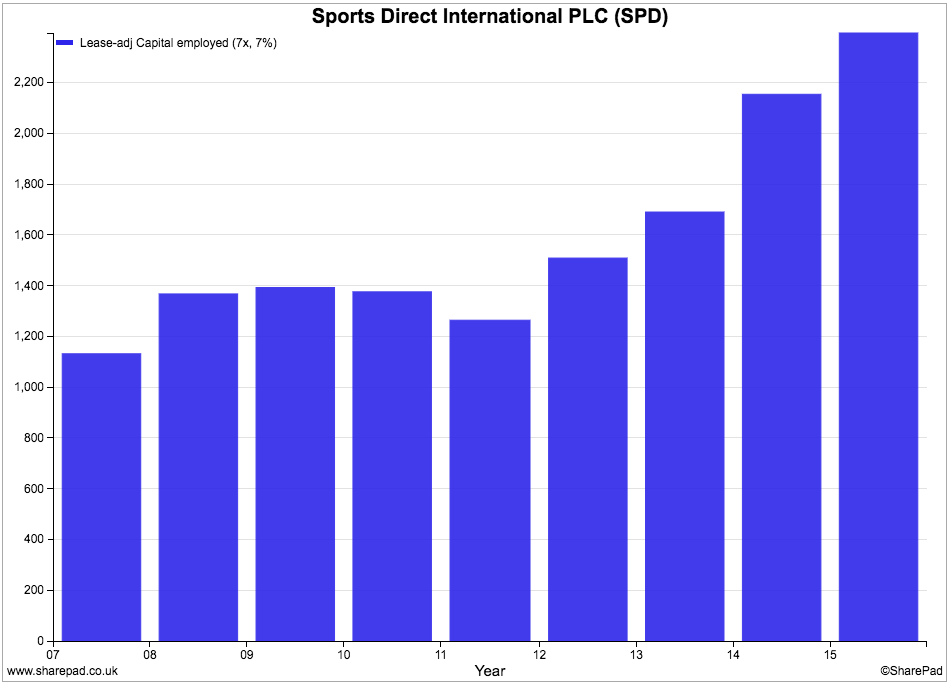
For example, has capital turnover fallen due to capital employed rising, sales falling or growth slowing down? A rise in capital employed may not be a problem as new investments take some time to mature. A problem with sales is more worrying.
We can see that capital employed has been growing.
But turnover growth might be more of a worry. As I mentioned earlier, growth slowed dramatically in 2016. The lighter bars to the far right of the chart show expectations for turnover growth from City analysts. They don't see rapid growth returning soon.
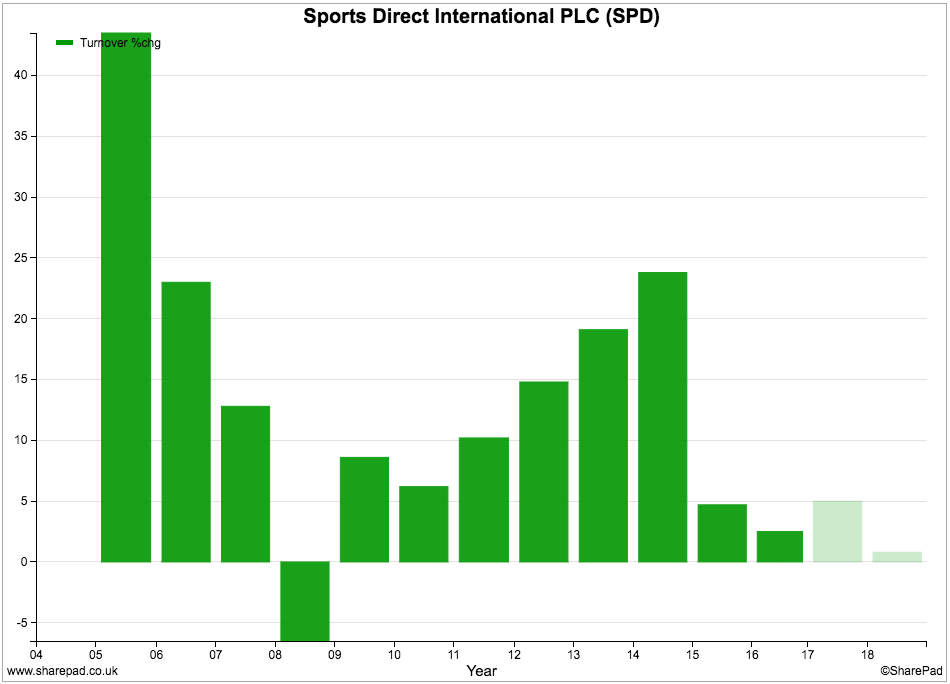
This means that profit margins are all important. Margins have been rising but as we shall see later, they are expected to fall and therefore the company's ROCE probably will as well.
Free cash flow performance
Sports Direct does seem to be able to produce free cash flow. That said, a retailer which rents assets will always have a lower capex bill and higher free cash flow than one that buys assets.
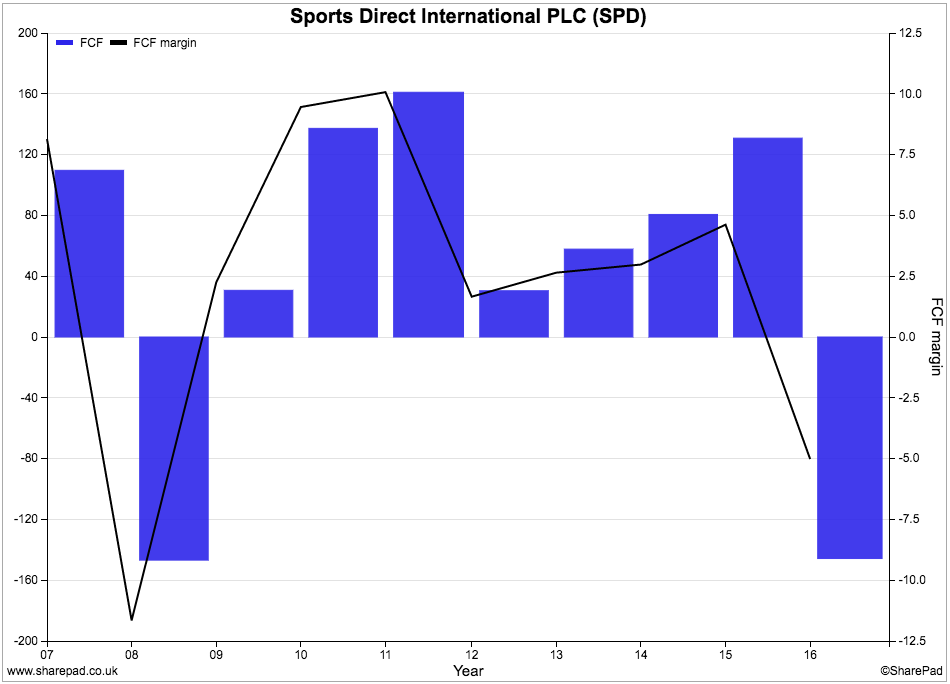
Free cash flow had been on an improving trend until last year when free cash flow turned negative. Free cash flow margins have been all over the place. As I mentioned earlier, free cash flow can be expected to be volatile for an expanding business so it is quite difficult to draw firm conclusions from the chart above.
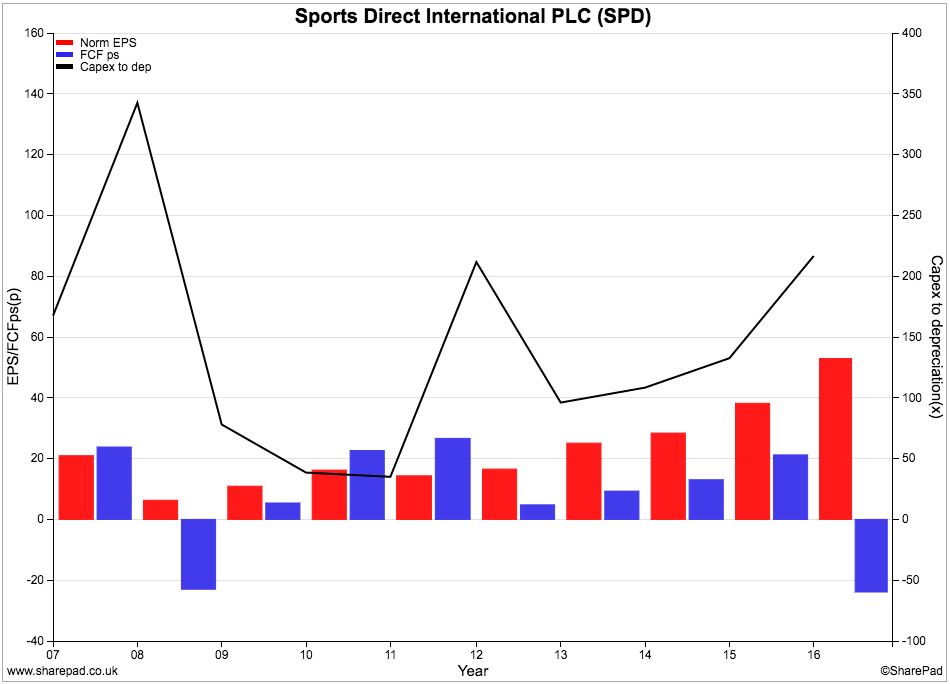
The same can be said for the chart below. Free cash flow per share has been consistently lower than earnings per share (EPS) since 2012. You can see that capex as a percentage of depreciation has been rising since then which will explain some of this.
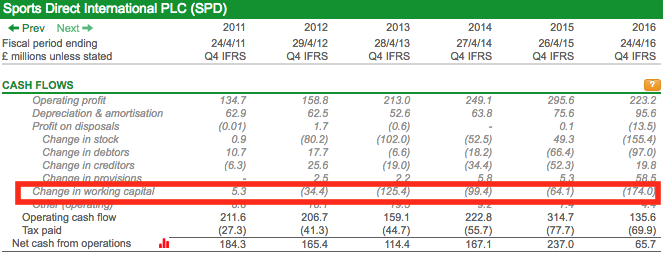
A closer look at Sports Direct's cash flow statement shows that the business is very working capital-intensive. The build up in stocks in order to grow sales has seen significant cash outflows in recent years.
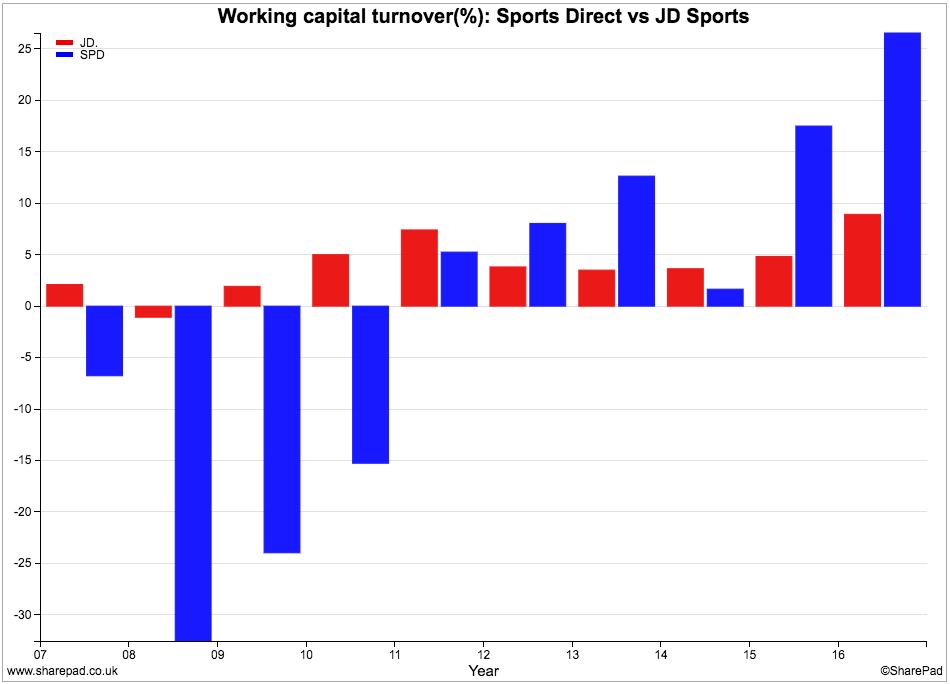
If we compare the company with its rival JD Sports, we can see that it is much more working capital-intensive having been much less so until 2011. Sports Direct's working capital to sales ratio has increased significantly in 2015 and 2016 and this would need to be invested by any investor thinking of buying shares in the company.
If we just look at stock as a percentage of sales, we see a similar picture. Why does Sports Direct carry around twice as much stock as a percentage of sales as JD Sports?
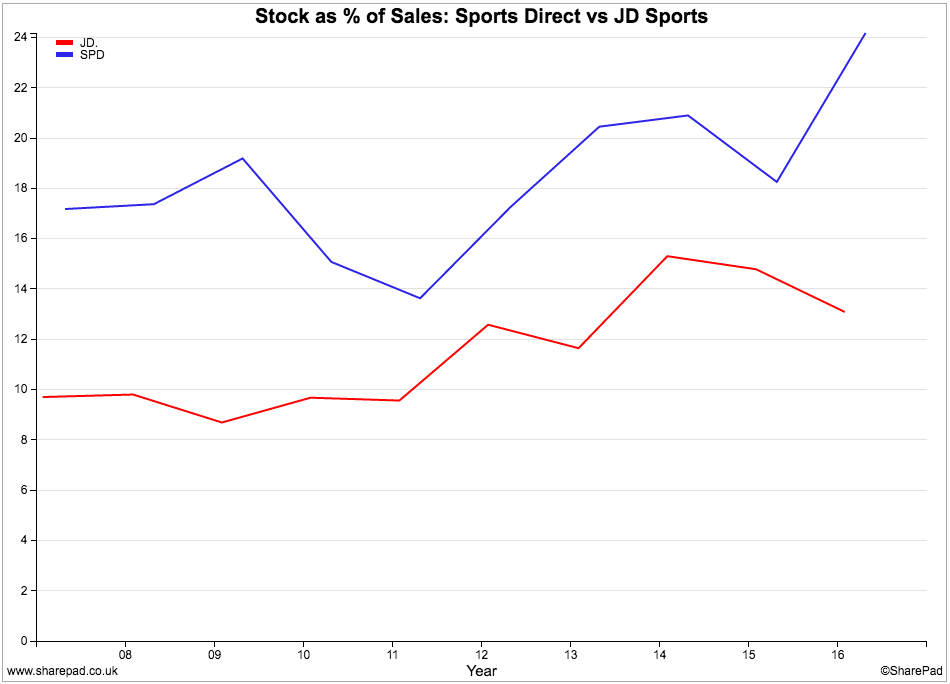
Stocks can be a big problem for retailers. There can be a fine line between having too little and keeping customers waiting or losing them to a competitor and having too much. High stock levels can soak up a lot of cash. If they can't be sold quickly enough then prices have to be slashed to turn them into cash which can lead to significantly lower profits.
Financial position
The amount of hidden or off-balance sheet debt has been growing in recent years as the company has opened up a lot of new shops.
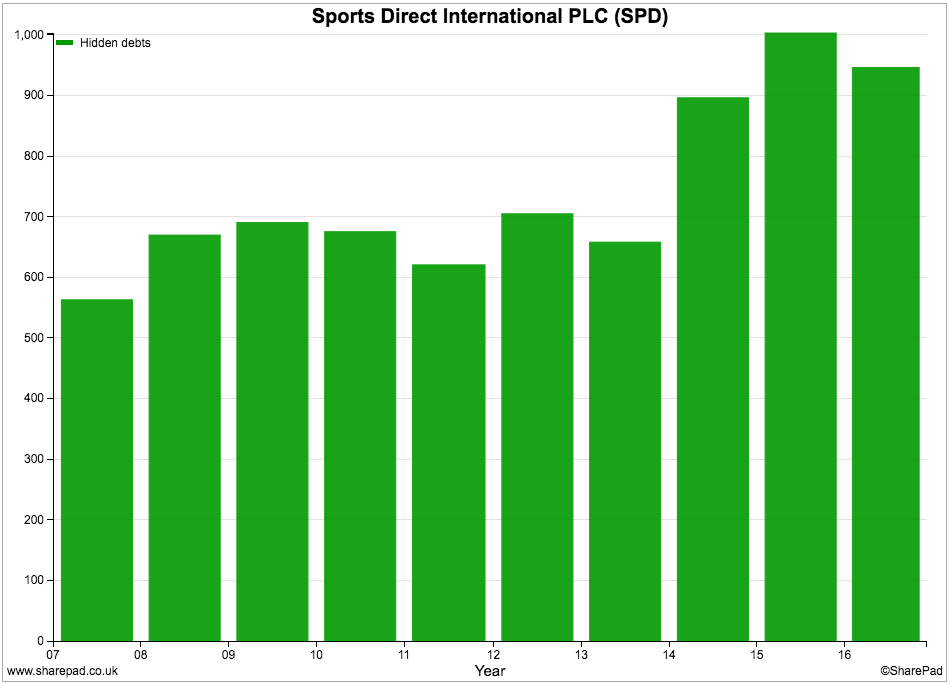
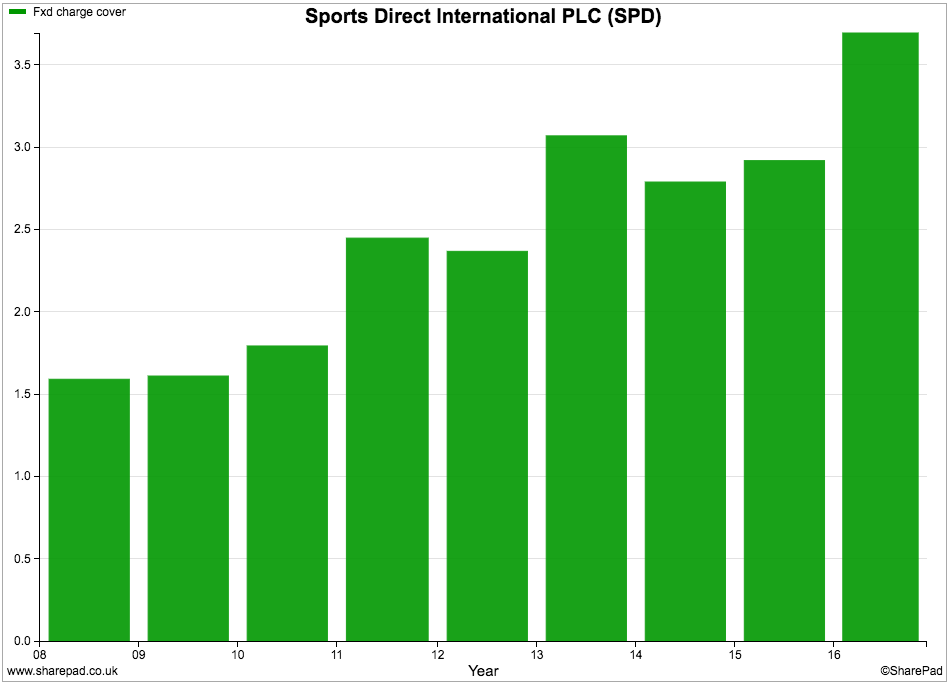
That said, fixed charge cover is very high for a retailer and shows that the company has a strong financial position.
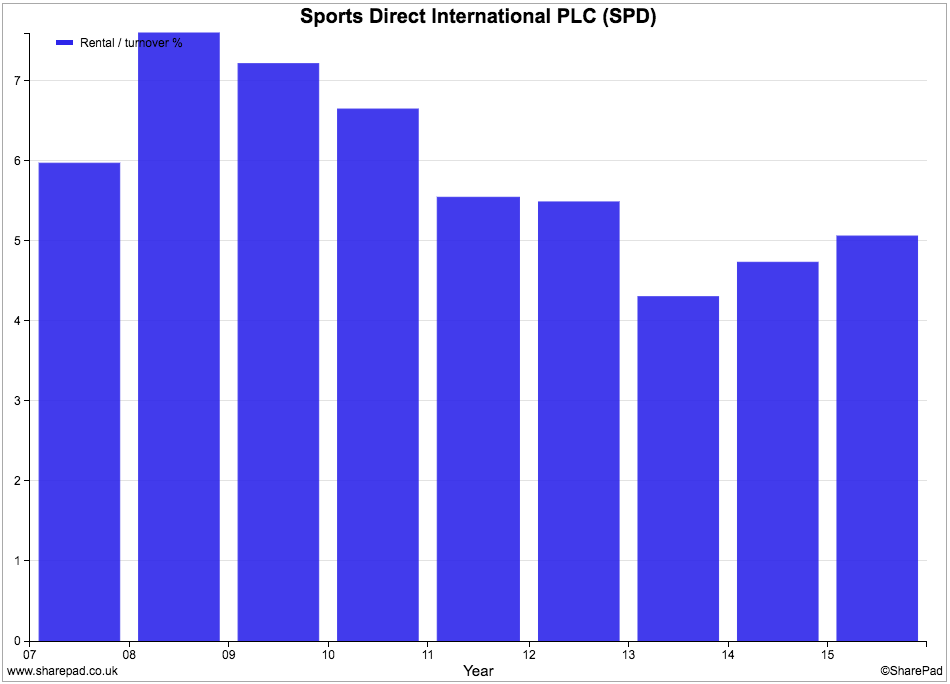
Rents are not eating up a large proportion of turnover either.
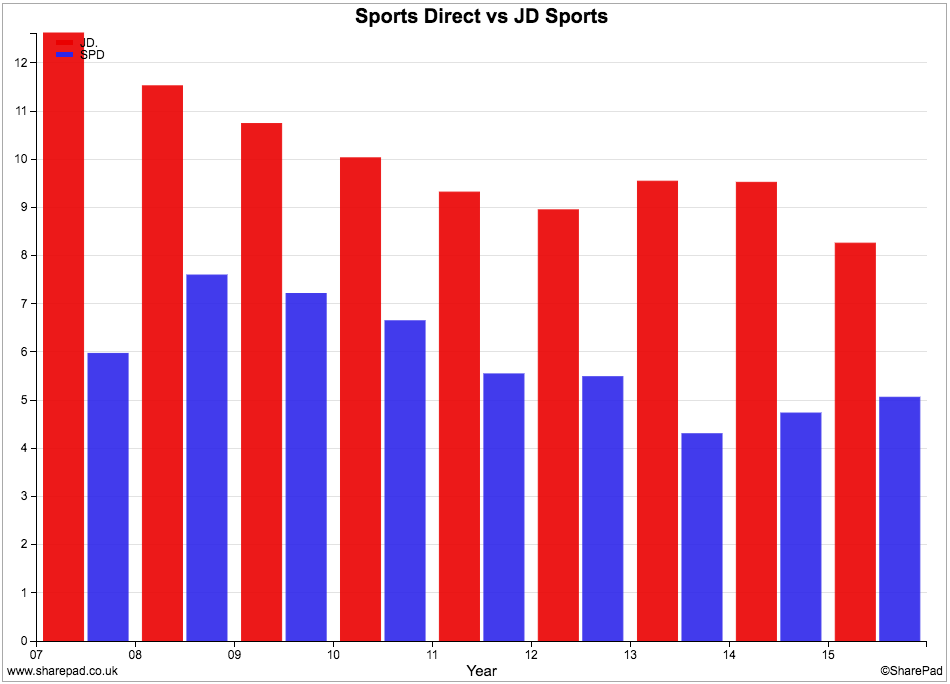
In fact, Sports Direct has a much lower rent bill as a percentage of turnover than JD Sports due to it owning more of its own stores. This gives it more financial flexibility and could be seen as a source of competitive advantage.
Future prospects and valuation
It is not unfair to say that the company has a growth problem as shown by City analysts' forecasts below.
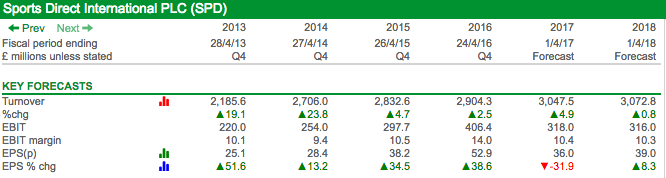
The company said in its full year results statement in July that the future outlook was very uncertain:
"Trading since the start of May and leading up to the EU referendum was broadly in line with management expectations albeit with the continued volatility seen in the wider retail sector. Since the EU vote we expect the current political uncertainty, and potential weakness in the UK's short to medium term economic outlook, is likely to act as a continuing drag on consumer confidence. When combined with the structural difficulties for UK retailers, including high street footfall, and our exposure to the weakness of the pound against the US dollar (as announced on 24 June 2016), these factors make the current outlook for FY17 somewhat uncertain and therefore hard to predict."
The company has also embarked on a £90m share buyback programme with the aim of shrinking the shares in issue by up to 5% which will help EPS growth in 2018.
However, City analysts are currently predicting no trading profit (EBIT) growth between 2017 and 2018, despite new investments by the company in flagship stores (known as Key Location Doors) and relocating others.
The fall in value of the pound against the US dollar will also increase the cost of buying certain products which will lower profits.
Could it be that, like many retailers, Sports Direct has just run out of steam?
I've written about the dynamics of retailers' growth in previous articles. In short, they can appear to be growing fast by opening lots of new stores and seemingly getting strong underlying growth in sales at the same time. But all that may be happening is a natural maturation process where businesses take some time to reach the expected level of sales.
When the number of new openings slows down, like-for-like sales growth can grind to a halt. If this happens whilst store openings are still growing then a company may have an even bigger problem on its hands.
This is what has been going on at Sports Direct's core retail business in recent years.
| Year | Stores | LFL Change (%) |
|---|---|---|
| 2016 | 531 | -0.8 |
| 2015 | 432 | 7.4 |
| 2014 | 339 | 10.5 |
| 2013 | 275 | 10.6 |
| 2012 | 290 | 0.7 |
| 2011 | 290 | 6.6 |
| 2010 | 325 | 3.4 |
This is a worrying slowdown given the big growth in store number in recent years. Combine that with management comments about the future being hard to predict and you can begin to see why the share price has been hammered.
But has the stock market been too harsh with Sports Direct?
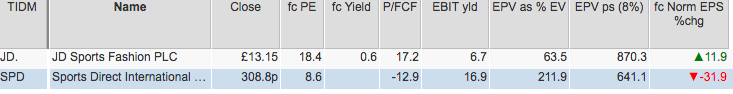
The company doesn't pay a dividend so it may pay investors to wait until things improve, but the shares do trade on a very low forecast PE multiple and high EBIT yield. Its earnings power value (the value of the business if last year's profits continue forever) is more than twice the current market valuation.
Granted, the stock position, current underlying sales and management caution could be warning investors that worse is to come but a lot of bad news looks to be priced into the shares already.
One for the watchlist perhaps?
To sum up:
- A strong track record of sales and profits growth has hit the buffers.
- ROCE remains good but CROCI is less impressive.
- ROCE may fall if margins come under pressure.
- Free cash flow performance has been lumpy and has deteriorated in recent years as capex levels have increased.
- The company is very working capital intensive and has much higher stock levels than rival JD Sports. This is draining cash out of the company.
- Stocks have risen significantly for the last two years and could be a sign of trouble.
- The financial position remains strong.
- City analysts are predicting that trading profits will struggle to grow.
- Management has said that future profits are hard to predict.
- Like-for-like profit contributions fell rapidly in 2016 and suggest that trading may get worse before it gets better.
- The shares are very lowly valued.
This article is for educational purposes only. It is not a recommendation to buy or sell shares or other investments. Do your own research before buying or selling any investment or seek professional financial advice.

