Stock Watch: Sage PLC
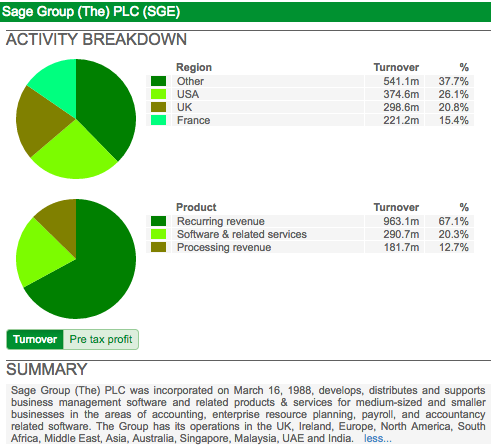
Sage PLC makes accounting and payroll software which is used by thousands if not millions of companies across the world. The company has grown significantly since it began life in the early 1980s and now sits comfortably inside the FTSE 100.
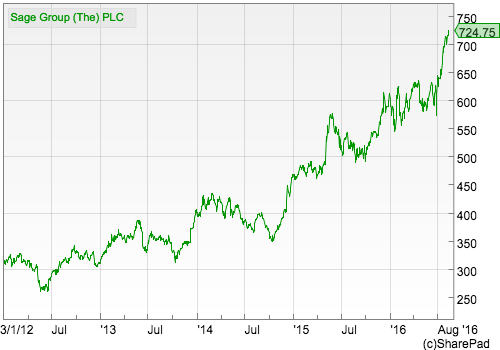
The company has become a firm favourite with fund managers specialising in high quality blue-chip shares. Long-term holders of the shares have been handsomely rewarded with big share price gains in recent years.
So why do investors like Sage so much and are its shares good value today? As usual, I'll be putting the company through a ShareScope analysis to answer these questions.
Want to learn how to analyse shares like a professional? Download our FREE guide.
Sign-up to our mailing list to receive a PDF of our Step-by-Step Guide to Investing.
Share this article with your friends and colleagues:
Turnover and profit history
The company's recent rate of turnover growth has been steady rather than stellar. There was a fall in turnover in 2010 when World economies were weak before picking up again in 2011.
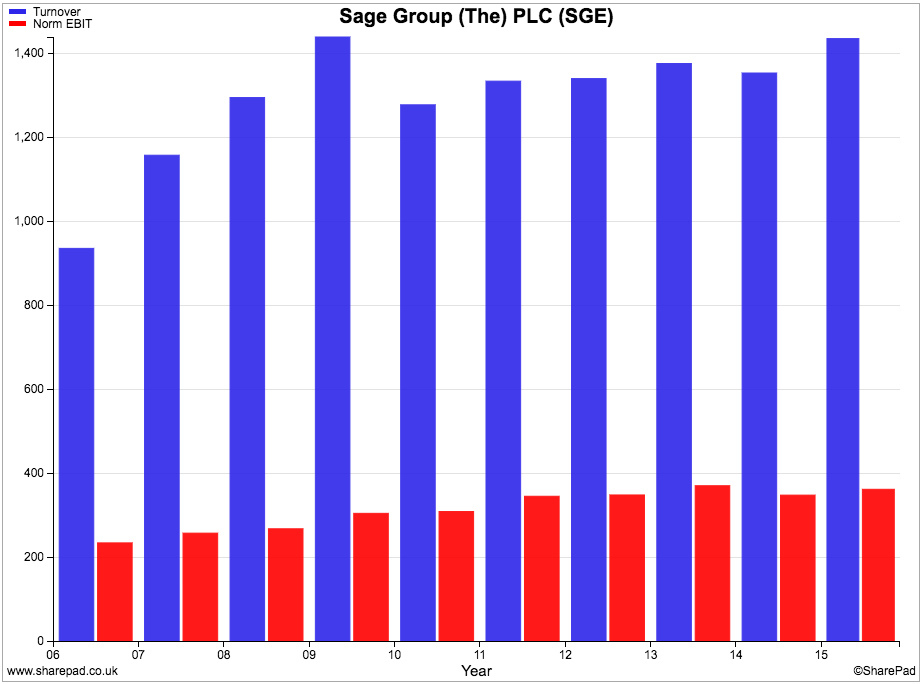
Profits have proven to be very resilient and stable throughout the ups and downs of the economic cycle and this will undoubtedly be a major attraction to many investors and fund managers.
That said, the company has struggled to grow its profits in recent years which is not what you would normally expect given how well its share price has performed and how richly its shares are valued (see later for more on this).
Financial returns
The chart below probably best explains why Sage is well-liked by investors. The company has consistently high returns on capital employed (ROCE) and free cash flow returns on investment (CROCI).
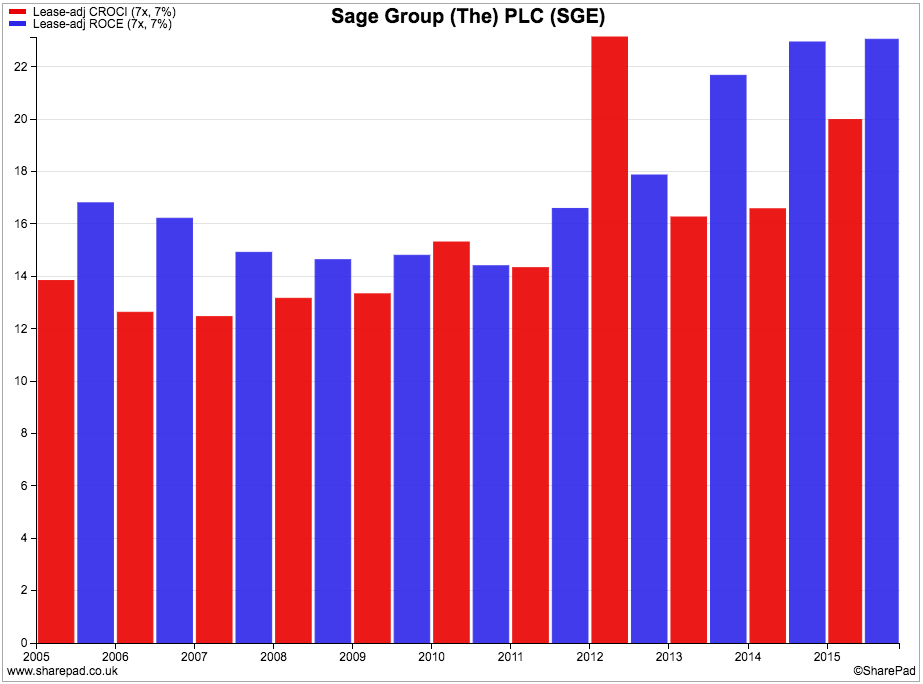
The trend is also upwards which is encouraging. Sage's ROCE is over 20% which is the hallmark of a very good business. CROCI of nearly 20% in 2015 is also very impressive - anything consistently over 10% is a good number.
Over the last decade, Sage's ROCE has averaged 17.7% with CROCI averaging 15.7%. You won't find many companies that have been able to perform like this. It seems fair to say that Sage looks a consistently good business and one that understandably many investors have been happy to own a slice of.
If we dig a little deeper into Sage's ROCE performance we can also learn some interesting facts. As you can see from the first (red) bar in the chart below, Sage's margins have been declining slightly in recent years.
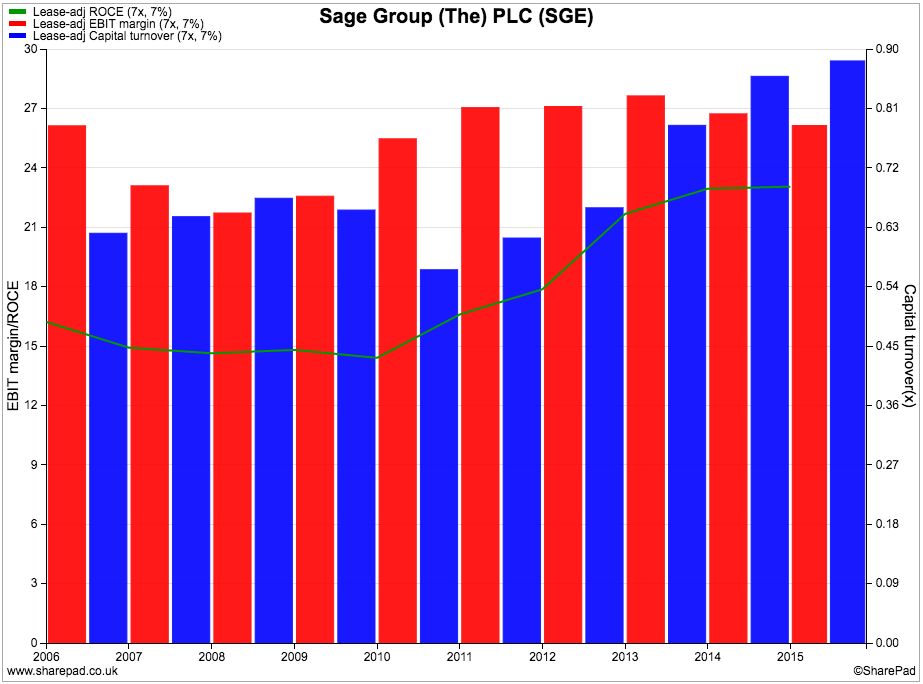
What we can see is that ROCE has been rising due to increased capital turnover. Sage is selling more per £1 of capital employed. Margins however have been falling in the last few years.
A closer examination of Sage's accounts shows that the company has been reducing the amount of money invested in its business and is becoming more efficient - it is doing more with less. If you look at the chart below, you can see that Sage has significantly reduced the capital employed in the business.
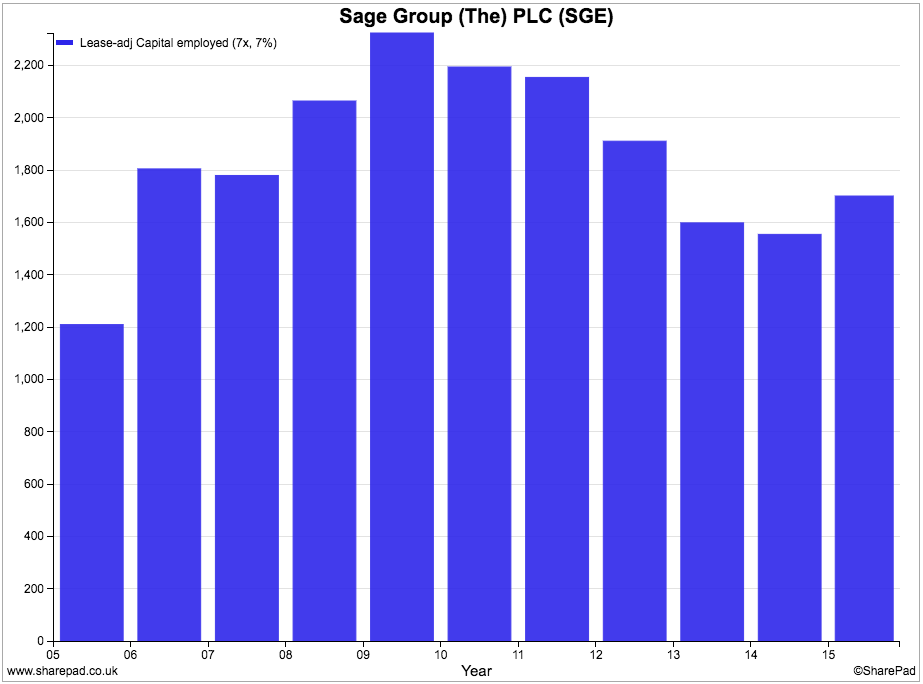
This is to be welcomed but it is important to note that this cannot continue indefinitely. To keep on increasing ROCE in future years, I think it's reasonable to assume that Sage is going to have to increase its sales whilst maintaining or increasing its profit margins.
Investors will need to watch the trend in operating margins closely. If they continue to fall as they have been then increases in ROCE might not be too easy to achieve.
Sage spends a significant amount of money on researching and developing new products in order to maintain and improve its competitive edge.
As you can see from the chart below, Sage consistently spends more than 10% of its sales on research and development (R&D). This ratio is very important and needs to be watched.
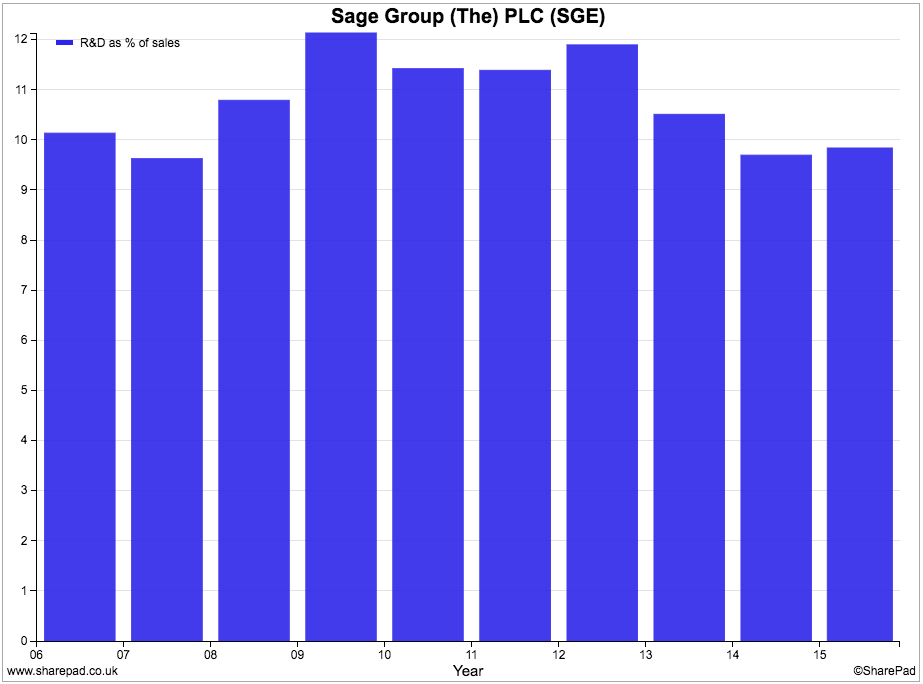
What you want to see is a steady level of spending to show that the company has not become complacent and stopped innovating. Also watch out for a falling ratio as cutting back on R&D can be an easy way for management to boost profits.
You can see that the ratio has fallen by around 2% between 2012 and 2015. Other things being equal, this would have boosted Sage's profit margins by 2% yet Sage's EBIT margin fell from 26% to 25.2%. Have costs increased elsewhere, or is this a sign that Sage's margins are under pressure?
Cash generation
We already know from looking at Sage's CROCI numbers that it is a company that has been able to produce a lot of free cash flow. But the chart below shows that free cash flow generation has been quite lumpy.
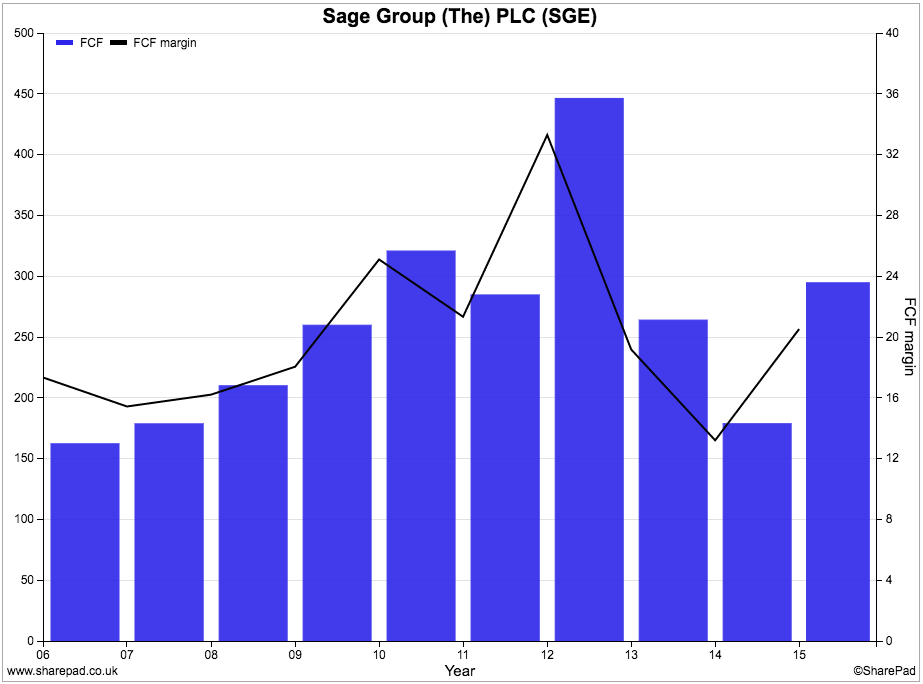
2012 was probably a one-off spike, but free cash flow now is not much different from what it was in 2010 or 2011.
The free cash flow margin which explains the proportion of turnover converted into free cash flow is also showing an interesting trend. Whilst it was very high at 20% in 2015 it has not reached the levels achieved a few years ago. This needs investigating to see if something has changed which could see margins fall in future.
Profit quality looks to be good with a free cash flow per share usually higher than EPS.
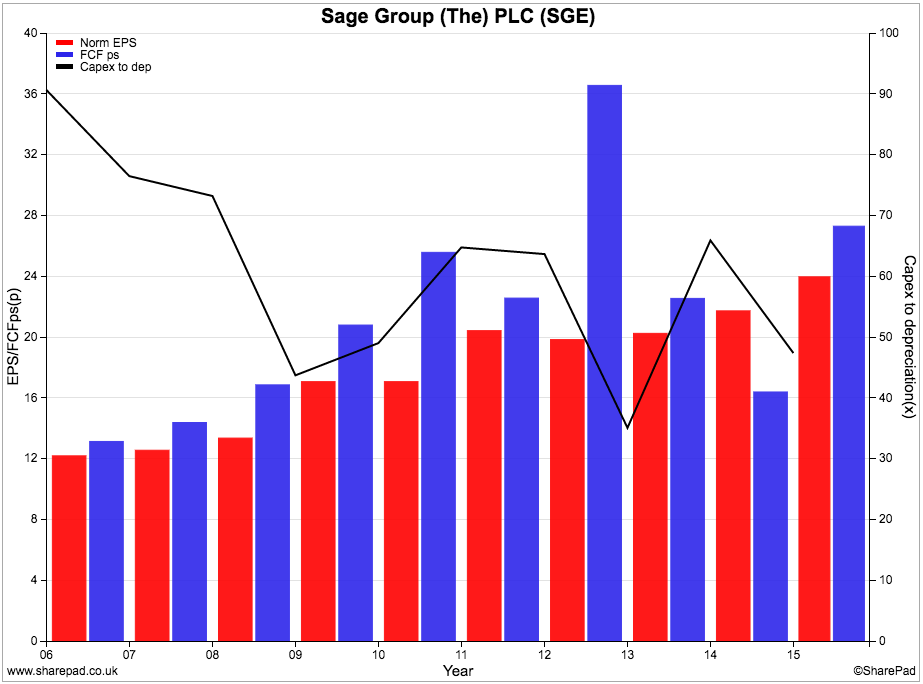
Note the black line in the chart above. You can see that Sage regularly spends less than its depreciation charge on new assets (capex), probably due to the amortisation of intangible assets which do not need replacing. This is a major source of the company's free cash flow and looks to be sustainable. By that, I mean that I don't think that Sage is under-investing in assets to boost its profits and cash flow.
If you look at the company's capex ratio. You can see that it is not having to plough back a lot of its annual trading cash flow back into new assets. This ratio has also been on a downwards trend and is now only 5% - a very low number.
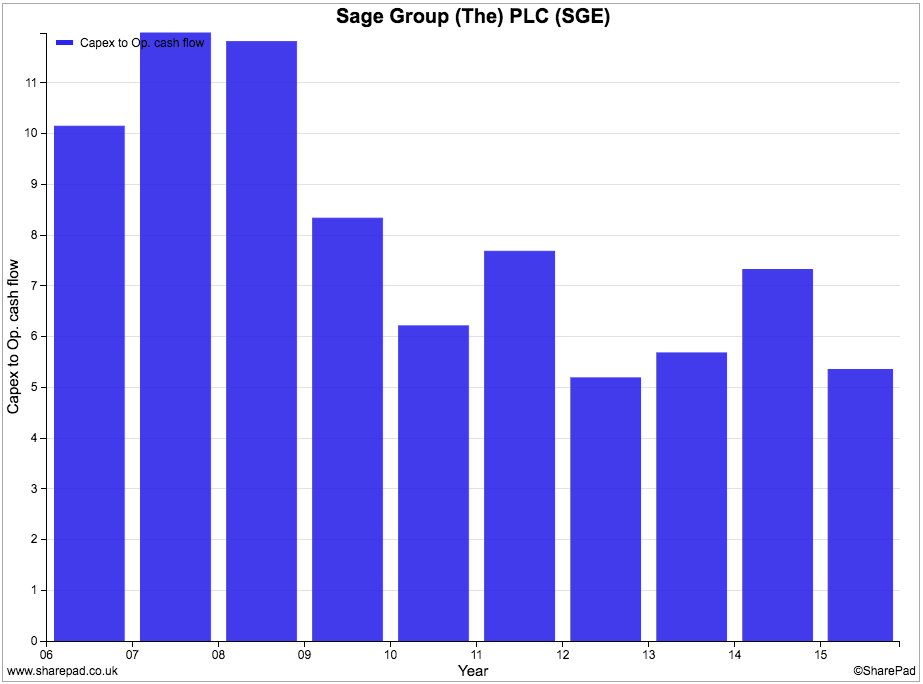
Again, this is a characteristic that many investors will find attractive. Companies which don't need to invest lots of money in new assets (known as asset-light companies) can earn very high returns on capital and produce lots of free cash flow.
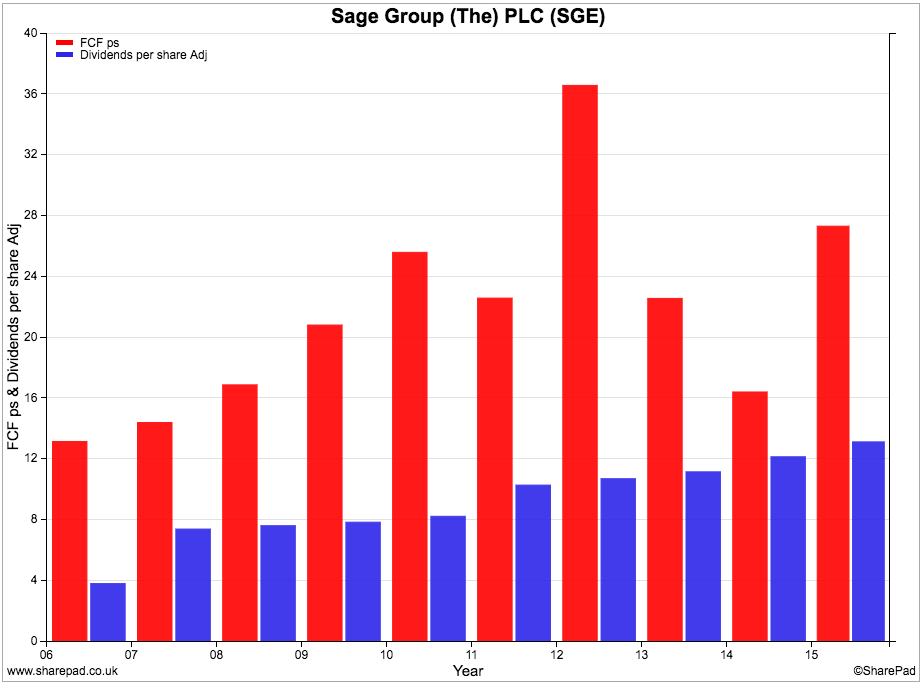
Sage's cash-generating capabilities have allowed it to pay a rising dividend to its shareholders including a big special dividend in 2013. With free cash flow per share being considerably more than the current dividend per share it would seem that Sage has plenty of scope to grow its dividends in future. Further special dividends could also be possible.
Safety
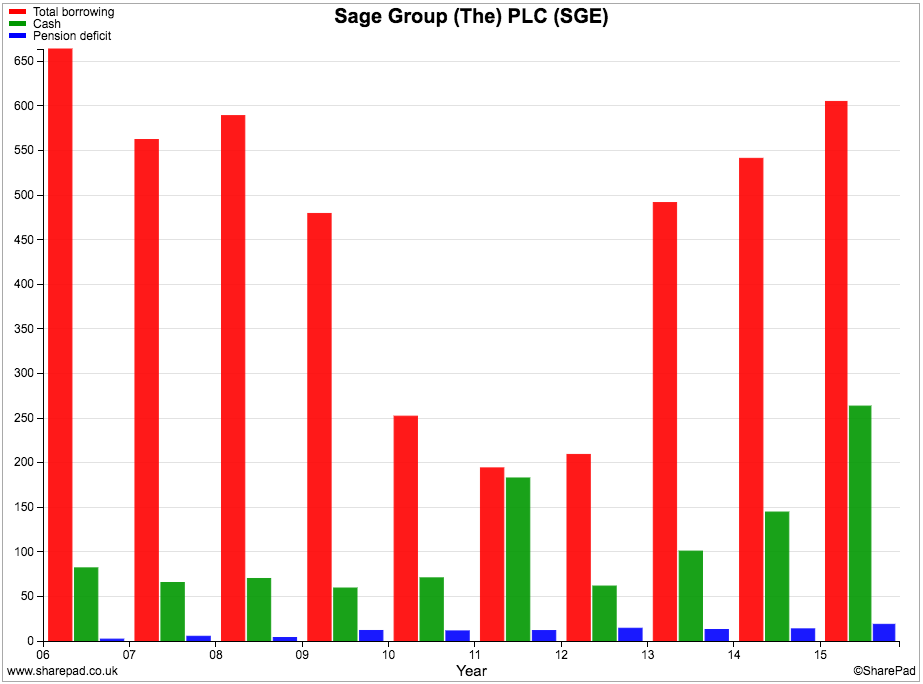
Sage's financial position looks to be very strong. Although borrowing levels have spiked up in recent years due to a special dividend and large share buy back in 2013, cash balances have as well. The company's net borrowings (total borrowings less cash) have fallen in 2014 and 2015.
Sage does have a final salary pension scheme which had a small deficit of just over £20m at the end of 2015. This is nothing to worry about.
Fixed charge cover - how many times profits can pay the annual interest and rent bills - is very comfortable and confirms that Sage has a strong financial position.
Valuation and Future prospects

Sage shares are valued highly by the stock market due its status as a quality company. At 715p they trade on over 26 times forecast EPS and the same multiple of its last annual free cash flow per share.
A fairly low EBIT yield of 4.5% and Earnings Power Value which explains just over 39% of its current enterprise value lends weight to the view that the shares are expensive. It seems quite clear that the current valuation is based on expectations of strong profits and cash flow growth for many years to come.
If growth is not as strong as people expect or the share price implies then investors may end up losing money. The high valuation may be justified by low interest rates and the company's quality characteristics but investors need to be on their guard that it is a major risk of owning the shares right now.
So let's have a look at what City analysts are expecting of Sage for the next couple of years.
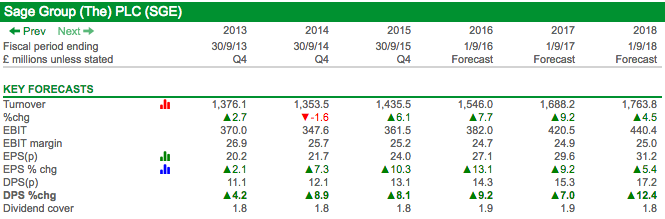
Turnover growth is expected to be reasonable at 7.7% this year and 9.2% in 2017. Given that the company has said in its recent trading statement that its underlying or organic turnover growth is around 6% we can see that there is some benefit from small acquisitions expected.
Also, as Sage gets around 80% of its turnover from outside the UK, the recent fall in the value of the pound will have increased the expected value of foreign sales when they are converted back into pounds.
EBIT margins are not expected to make much progress and this may concern some investors. Sage has high profit margins which tend to encourage competition and its inability to increase them may be a warning sign that its business model could be under threat.
In recent years Sage has had to spend increasing amounts of money on marketing and branding to fend off the competition and this has stopped margins increasing. The company faces threats from cloud-based accounting and payroll services who want to persuade Sage's customers to switch from having software installed in its offices.
Sage is developing its own cloud-based services to counter this threat.
To sum up
- Sage has many hallmarks of a quality business.
- ROCE and CROCI have been consistently high.
- EBIT margins have struggled to grow despite lower spending on R&D as a percentage of sales.
- ROCE has been driven by higher capital turnover which has been due to lower levels of capital employed.
- Free cash generation is very good, although free cash flow margins are lower than they were a few years ago.
- The company has very low capex requirements with a very low capex ratio of 5%.
- Capex is regularly less than depreciation but is not a sign of under-investing.
- Free cash flow looks likely to support higher dividends in the future.
- Sage's financial position is strong.
- Competition is increasing from cloud-based products.
- Profit margins need to be watched closely as they are the key to maintaining and improving ROCE.
- The shares are expensive and may require many years of growth to justify current valuations.
- The current share price is supported by very low interest rates elsewhere and the company's status as a high quality business.
This article is for educational purposes only. It is not a recommendation to buy or sell shares or other investments. Do your own research before buying or selling any investment or seek professional financial advice.

