Stock Watch: AG Barr

Shares in IRN BRU drink maker AG BARR (LSE:BAG) have proven to be a good long-term investment having returned nearly 250% over the last decade. The company has established a reputation as a high-quality business with a well-regarded management team.
However, over the last eighteen months or so, the shares have lost some of their fizz as the company has struggled with a tough market place and issues such as potential sugar taxes.
This has led to the valuation of the company becoming significantly cheaper than it has been in the recent past. Does this mean that its shares are a bargain or is it a case of buyer beware?
Let's see how the company fares when it is put through its paces in ShareScope.
Want to learn how to analyse shares like a professional? Download our FREE guide.
Sign-up to our mailing list to receive a PDF of our Step-by-Step Guide to Investing.
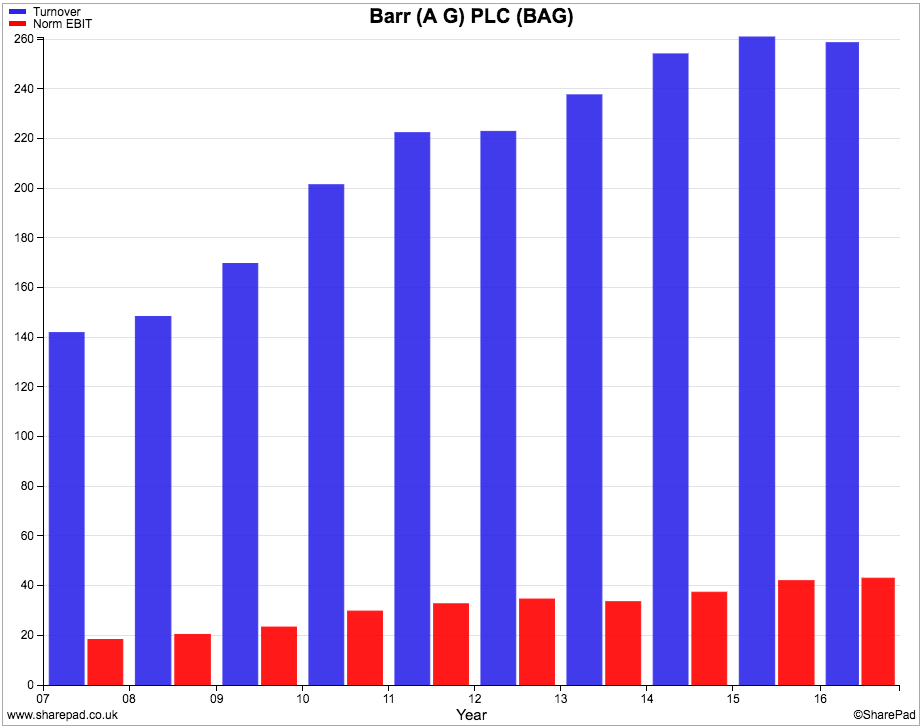
Sales and profit history
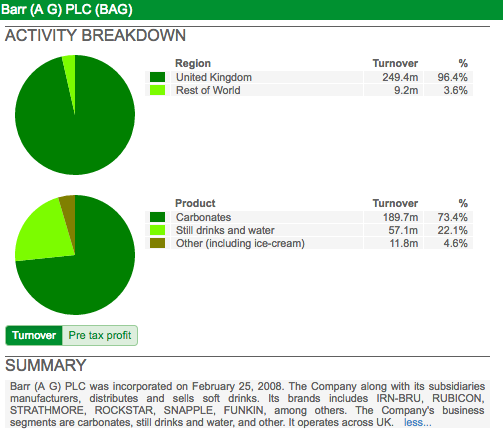
The company has a decent track record of growing its sales and profits. It has been able to do this by selling more of its existing products (known as organic growth) and also by acquiring other soft drinks brands and integrating them into its business.
Returns on investment
In the chart below, the second (blue) bars show that Barr has had a very stable and consistently high ROCE which has averaged 20% for the last ten years. This kind of trend is usually seen as a hallmark of a top-quality business.
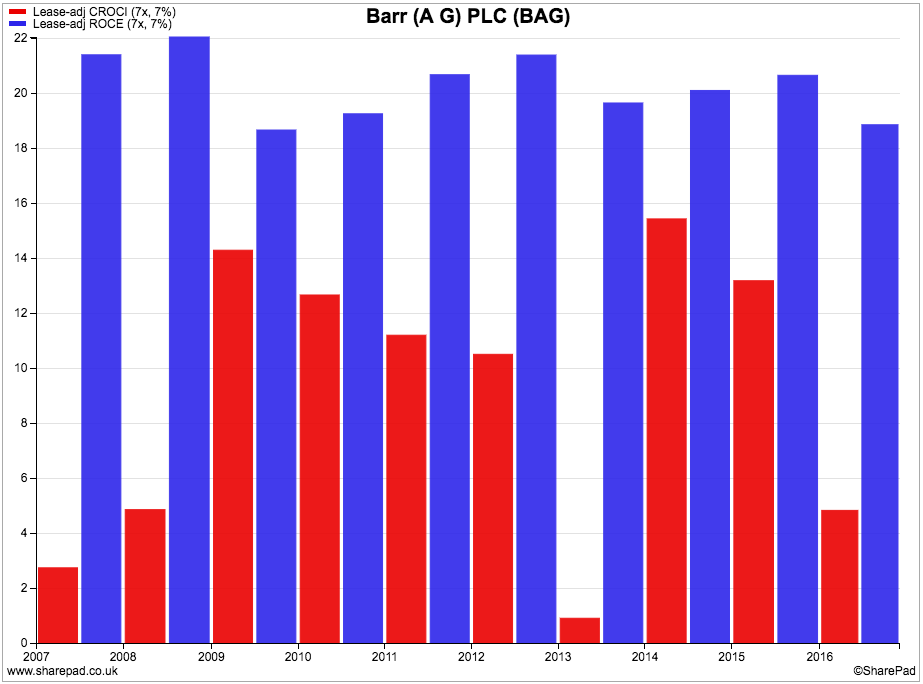
Free cash flow returns on capital (CROCI) have been more erratic and have averaged 9.1% over the last ten years. That's not a bad number but the company has increased its capital employed (money invested in the business) quite significantly during the last five years.
The ROCE figures show that AG Barr has been able to invest its money well but the pattern in CROCI suggests that we take a closer look at its free cash flow performance.
Dupont analysis
The green line on the chart shows the stability in ROCE from the earlier chart. Profit margins (the first or red bars) have also remained healthy and have improved slightly in recent years. Capital turnover (blue bars) - which is the value of sales made per £1 of money invested in the business - has fallen by a reasonable amount during the last three years.
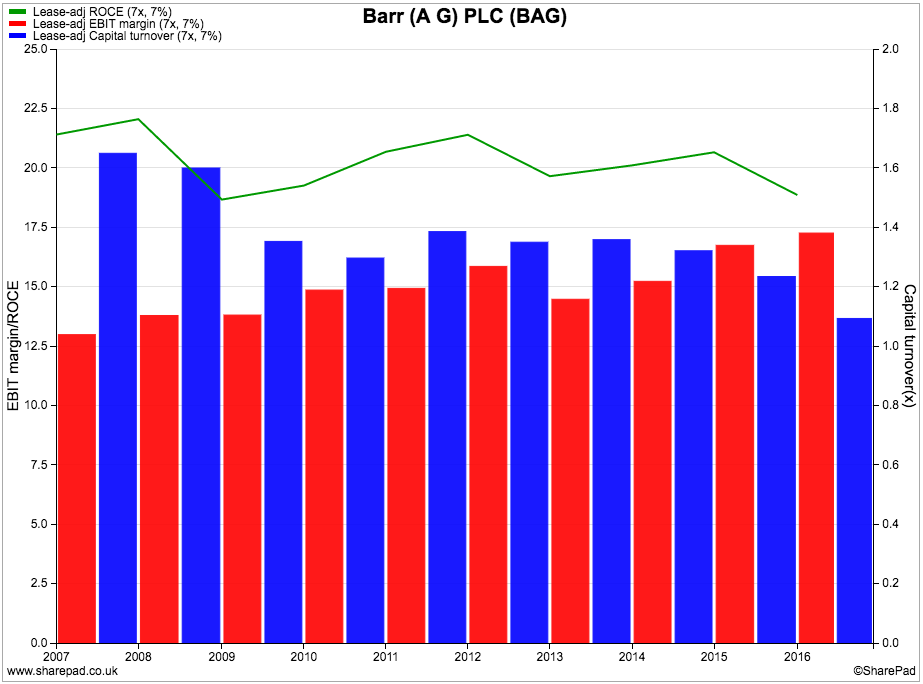
This trend needs to be watched. A decline in profit margins (e.g. sugar tax) combined with a falling capital turnover would result in a lower ROCE.
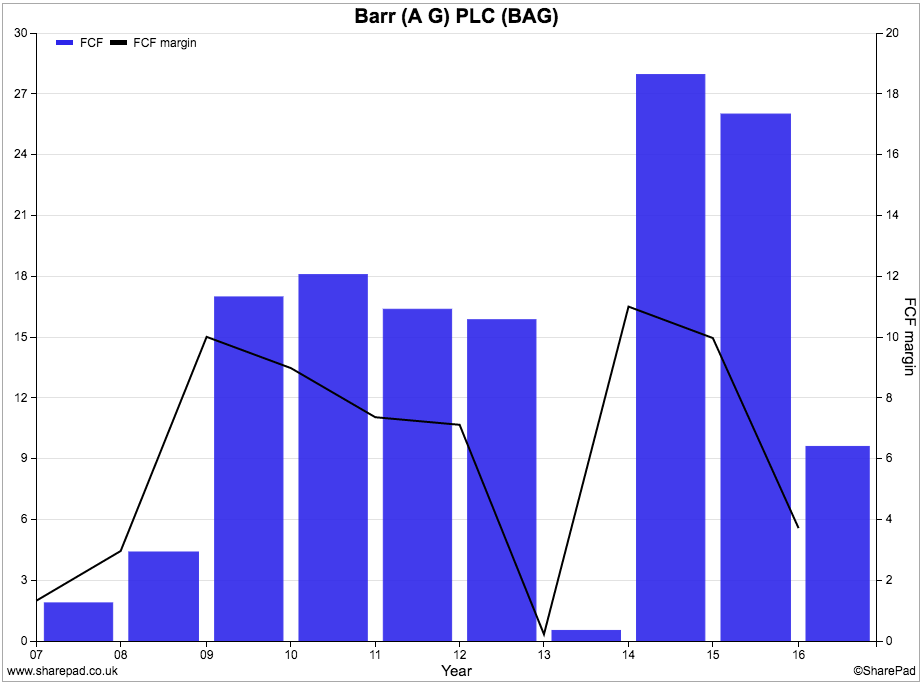
Free cash flow for shareholders
As with CROCI above, you can see that AG Barr's free cash flow (blue bars) has been erratic as has its free cash flow margin (black line). This needs more investigation as variability in free cash flow can be a bad sign.
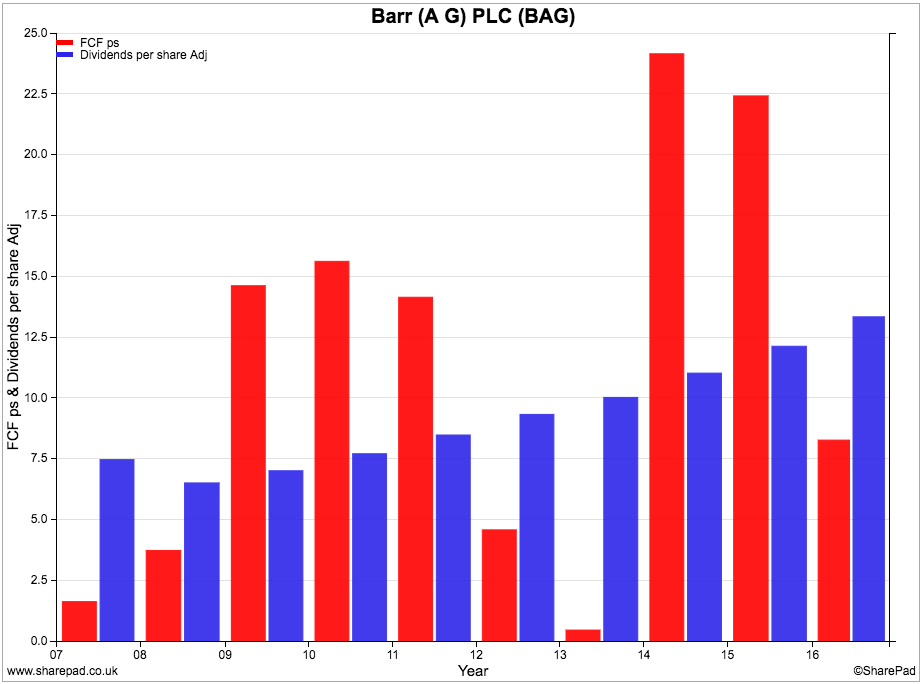
The chart below looks at AG Barr's free cash flow conversion - how much of its earnings per share (red bars) is turned into free cash flow per share (blue bars). You can see that free cash conversion has been a bit lumpy.
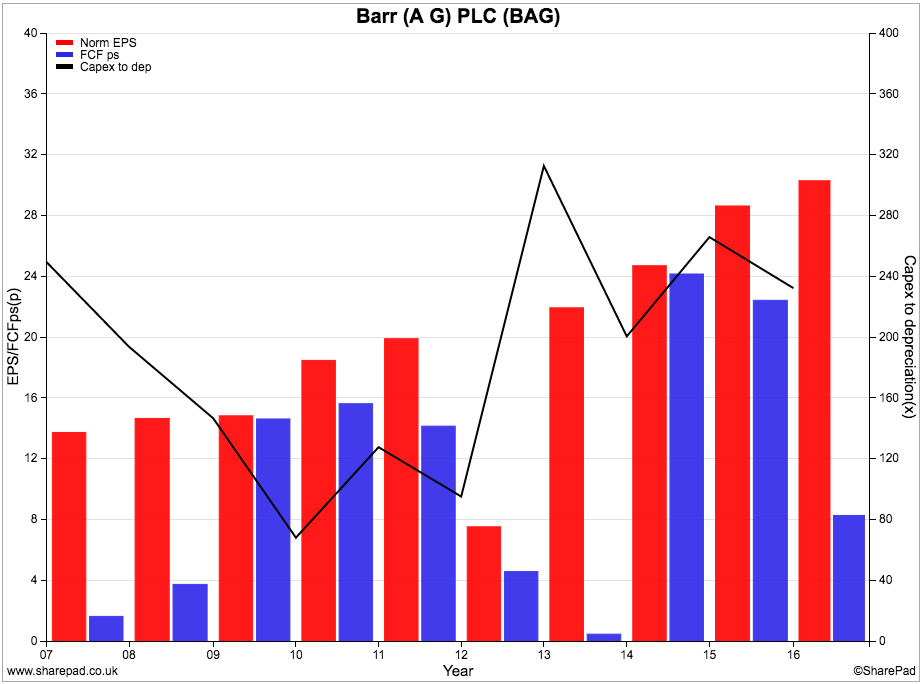
The black line on the chart represents capital expenditure (capex) as a percentage of depreciation. It ranges from about 70% to nearly 320%.
This is telling us that the amount of money the company spends on new assets has often been more than the annual depreciation expense which is one reason why the amount of free cash left over is so low.
That's normal for companies that are growing as they often need to expand manufacturing facilities to cope with growing demand. Even so, the gap between Barr's EPS and FCFps can be so large that it makes me think something else could be going on.
In its annual results news release back in March, the company provided a very useful free cash flow statement. A screenshot of this is shown below. This kind of information is always useful and more companies should think about providing it too.
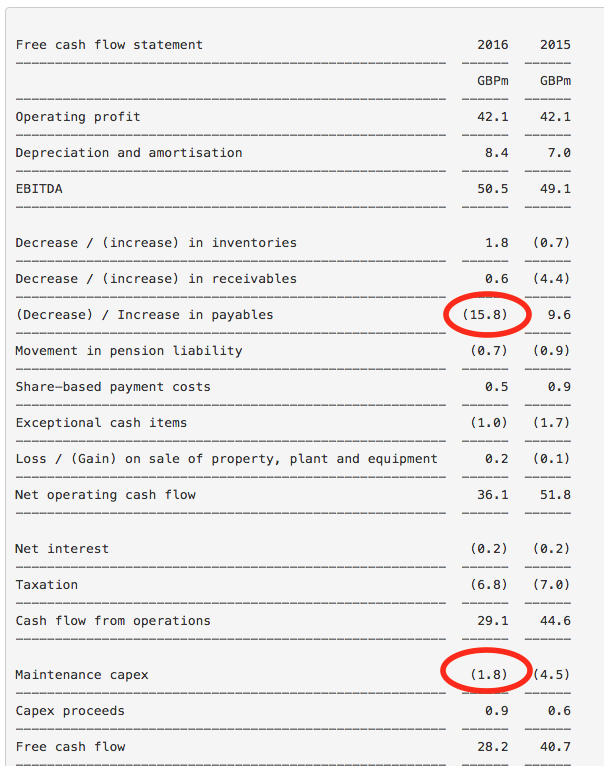
I have highlighted two interesting numbers above. The lower number highlights the very small amount of maintenance (or stay-in-business) capex declared. This is very low compared with depreciation and amortisation and is probably a sign of temporary tight cash management rather than conservative profits. In other words, I think this is more a case of holding back on maintenance capex rather than over-stating depreciation (and under-stating profits).
The number further up the page shows a very large cash outflow from paying the company's suppliers - shown as a £15.8m decrease in payables.
The company gives a good explanation of this cash outflow which should reassure investors that its suppliers are not putting a squeeze on the company by making it pay its bills faster than before:
"2015/16 has witnessed a significant increased cash outflow within payables as the phasing of supplier payments at the end of the current year combined with an unusually high level of opening capital payables brought forward from the prior year. We continue to pay suppliers on time and in full."
That said, I never take anything a company says for granted and decided to take a closer look at AG Barr's recent working capital performance in ShareScope.
The chart below looks at the changes in creditors, debtors and stock that show up in the company's annual cash flow statement. Any bar pointing upwards is a sign of cash flow into the business - a good sign - whereas bars pointing down show cash flowing out - not so good.
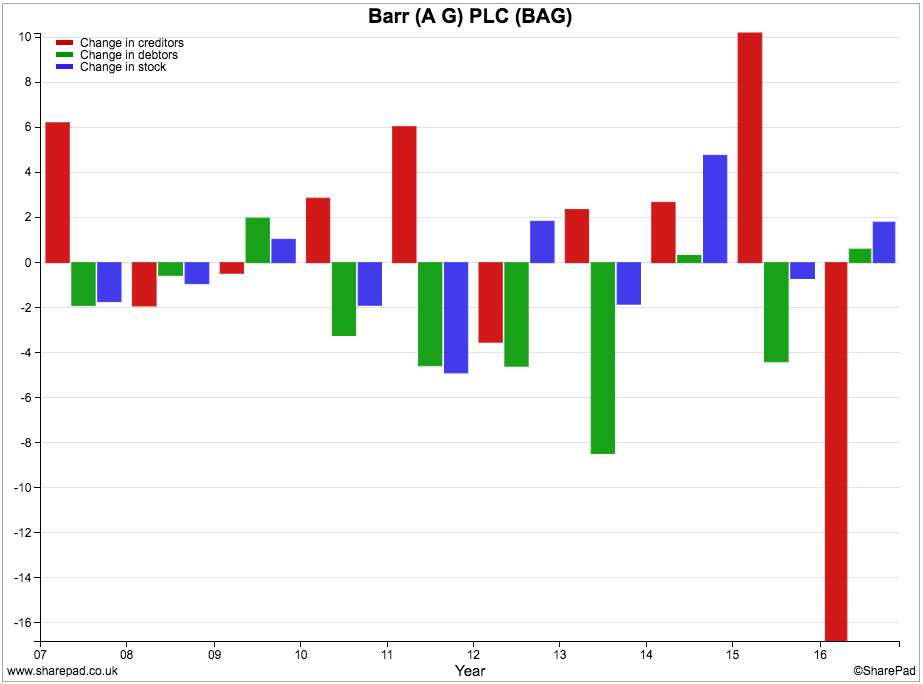
What you should be focusing on here is the trend in cash flows. It is not unusual for the company to see working capital outflows but last year's creditor outflow was preceded by a big inflow from that source in 2015.
What has happened here is that the company delayed paying suppliers in 2015 and got a cash flow benefit from it. This year it had to pay these outstanding bills. These kinds of reversal are very common. I don't think there is anything too much to worry about here.
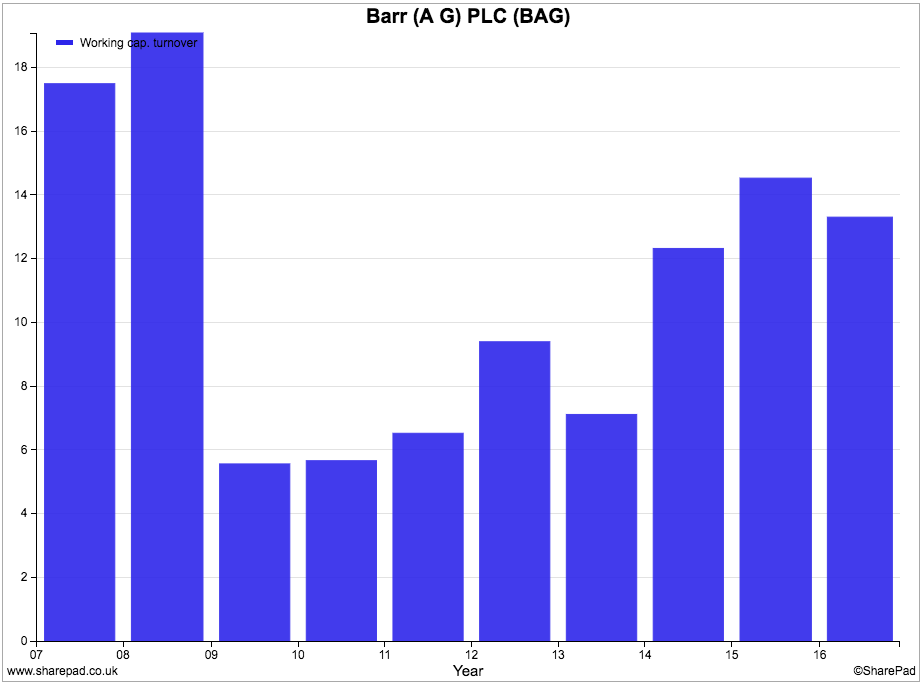
However, if we look at the ratio of working capital to sales (below), we can see that it has been increasing and has spiked up since 2013. This means that Barr has had to use more cash to support ongoing levels of sales i.e. more cash has to be tied up in the business.
The lumpiness in its free cash flow means that the company has not always generated enough free cash flow to pay its total dividend.
Over the last ten years, however, the company has been able to do this in aggregate. It has produced £137m of free cash flow and paid £98m of cash dividends to shareholders.
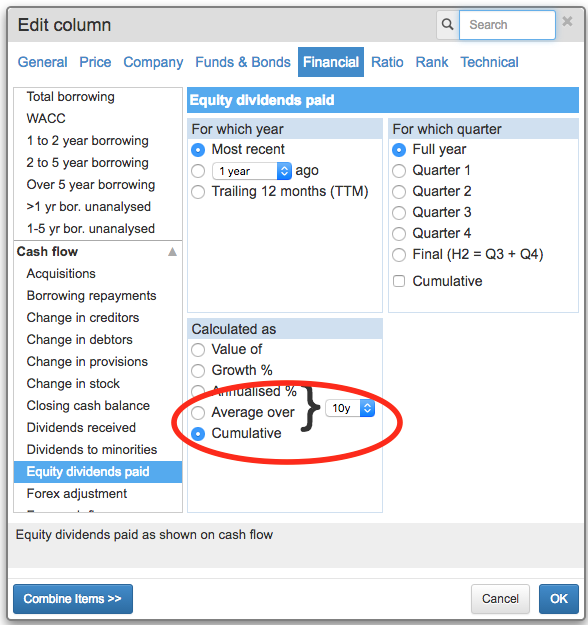
I find cumulative analysis really useful in circumstances like this. You can do this kind of exercise easily and quickly in ShareScope using the cumulative option and selecting the number of years you want to do this for.
Financial strength
AG Barr has very little debt. The cash balance has come down because of the money spent to buy Funkin - a maker of cocktail mixers - last year. The pension fund deficit is not a big problem.
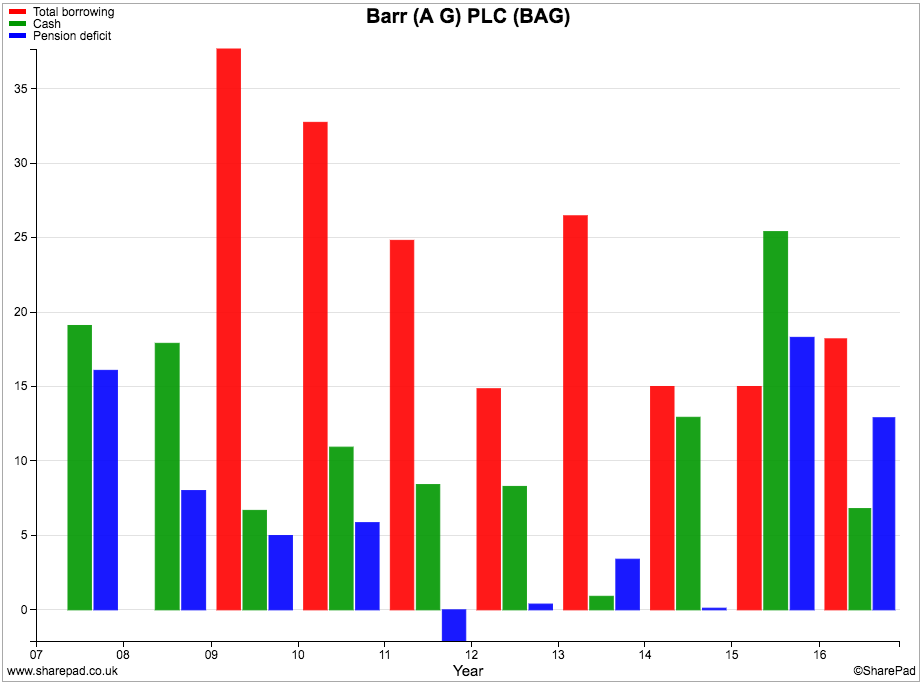
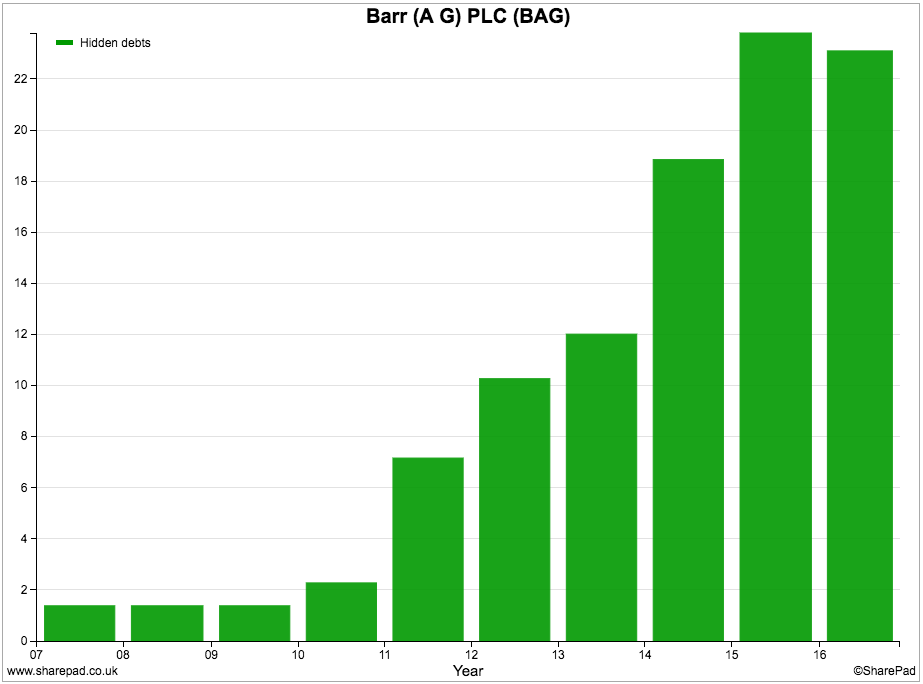
Hidden debts (rental costs) have increased but are relatively small.
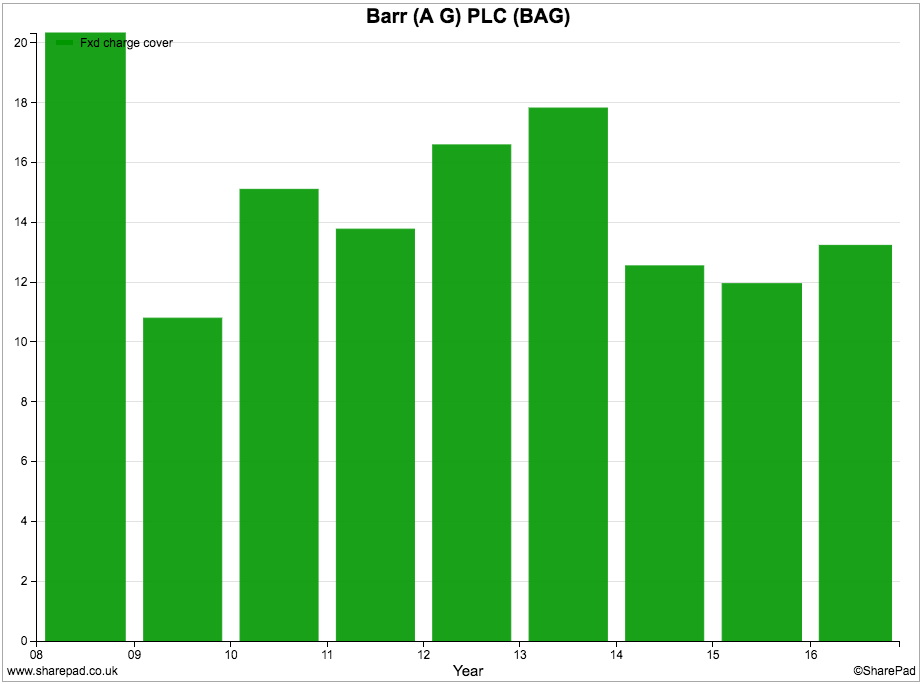
Fixed charge cover is very high which shows how strong AG Barr's finances are.
Future prospects and valuation
AG Barr is a decent business but can it keep investors happy?
The usual way to do this is to keep on growing sales and profits at a healthy rate, but it is by no means certain it can do this.
The table below shows a summary of the key forecasts for the company. In short, City analysts aren't expecting much in the way of growth in trading profits (EBIT) for 2017 and 2018. Dividends are expected to keep on growing though.
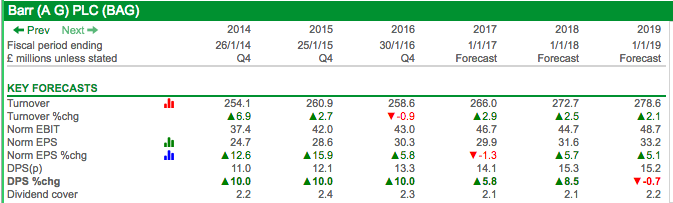
Although consensus forecasts suggest a dividend cut in 2019, this is unlikely; it is more likely that some analysts have not updated their forecasts recently.
So why is growth expected to be so sluggish?
The UK soft drinks market has not been a happy market for some time. All companies within the industry are struggling to sell more.
Consumer preferences have been slowly changing. They have been moving away from sugary drinks and even low- or zero-sugar varieties are struggling to compete with water and juice drinks.
Competition is intense. You only have to walk around a supermarket or convenience store to see that there are lots of soft drinks being sold at promotional prices as companies try and gain market share. The level of competition has been so tough that overall prices have been falling which is not helpful if you are selling fewer bottles of drink.
Then there is the UK government's proposed sugar levy on fizzy drinks which is due to come into effect in April 2018. Investors are worried that this will hold back AG Barr's sales and profits. Whether it will or won't remains to be seen but the uncertainty has not been helpful to the company's share price.
That said, two thirds of Barr's drinks brands are low- or zero-sugar and will not be affected by the levy. Some customers will not give up sugary drinks no matter how bad they are - even if the price of them goes up. However, it is difficult to see Barr selling more of them than it does now.
The outlook for its Rubicon drinks and its partnership brands of Rockstar (an energy drink) and Snapple looks better and Barr could get some growth from them.
Overseas sales have been growing strongly in recent years and this remains a significant opportunity for AG Barr. However, overseas sales are a tiny part of the business at the moment. The company's growth initiatives in this area will also have received a significant boost from the recent fall in the value of the pound as this will make its products cheaper on international markets.
A big acquisition cannot be ruled out either. Soft drinks companies who are finding it hard to grow may get together and cut costs in order to keep their shareholders happy. Back in 2012, AG Barr tried to get together with its rival Britvic but the deal fell through. Could the deal be resurrected or might another company try and buy AG Barr instead?
Given the difficult outlook, it is not too surprising that AG Barr's shares have lost some of their fizz. Its shares used to change hands for more than 20 times earnings not so long ago, but currently trade on a forward PE ratio of just over 17.
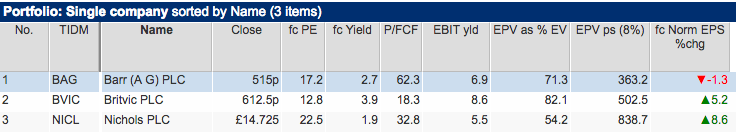
This is hardly bargain basement territory when rival Britvic trades on just 12 times and offers a higher dividend yield as well. Barr's current trading profits explain just over 70% of its current enterprise value (as measured by its earnings power value) which might be seen as a reasonable buying level if reasonable future profits growth was more likely.
To sum up
- The company has a good track record of growing sales and profits.
- ROCE has been consistently high and could be a sign that AG Barr is a high quality business.
- CROCI and free cash flow performance is more lumpy.
- The company's working capital has been increasing, with a big cash outflow from paying suppliers last year. This looks to be a one-off event.
- Future profits growth is expected to be hard to come by due to high rates of competition, changing consumer tastes and sugar taxes.
- Dividend growth is expected to continue.
- The company's finances are very strong which give it opportunities to invest or buy other companies.
- The shares are less expensive than they used to be but could not be seen as being very cheap.
This article is for educational purposes only. It is not a recommendation to buy or sell shares or other investments. Do your own research before buying or selling any investment or seek professional financial advice.

