Stock Watch: Marks & Spencer
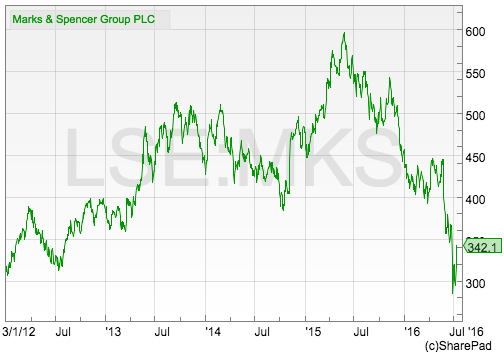
M&S shares are having a tough time. After being hammered by the fallout from the EU referendum result it has now disappointed investors with a very lacklustre trading update.

Like a lot of high street retailers, the company has been struggling to adapt to the changing ways that people shop and keep them coming into its stores. Its clothing business has become a big problem as customers struggle to understand its offer and buy clothes from places such as Primark and supermarkets instead.
Its food business has been performing well but this is also facing a tough industry backdrop of falling prices and lots of competition.
Can M&S recover and do its shares offer an opportunity for bargain seeking investors? Let's open up ShareScope and take a closer look.
Want to learn how to analyse shares like a professional? Download our FREE guide.
Sign-up to our mailing list to receive a PDF of our Step-by-Step Guide to Investing.
Share this article with your friends and colleagues:
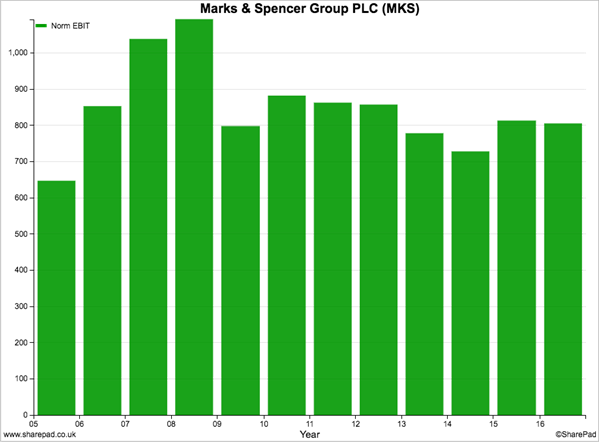
Trading profit history
This chart sums up M&S's big problem. Its trading profits peaked in 2008, took a big tumble and have then struggled to grow. It looks like a stagnating business.
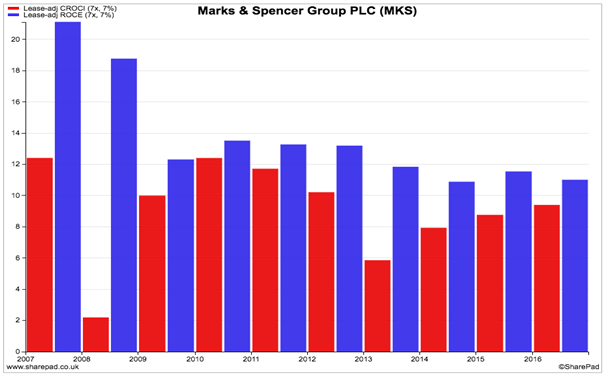
Financial returns
Back in 2008, M&S looked like a decent business and was making a decent return on capital employed (ROCE) approaching 20%. As profits have fallen, ROCE has come down to just over 12% in 2015/16. Free cash flow returns (CROCI) have not been as good and are below the quality threshold of 10%.
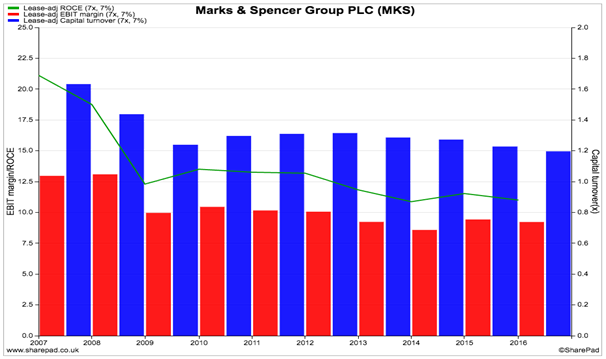
Using the Dupont analysis below we can dig a little deeper into the ROCE performance. We can see that M&S has been hit by a double whammy of falling capital turnover and falling profit margins. In 2007 it was selling around £1.80 for every £1 invested compared with £1.20 now. Profit margins have fallen from over 12% to just over 7%.
Free cash flow
Apart from a disappointing performance in 2008 and 2013, the company seems to be able to produce free cash flow which is always an encouraging sign. Free cash flow to the firm has also been increasing for each of the last three years.
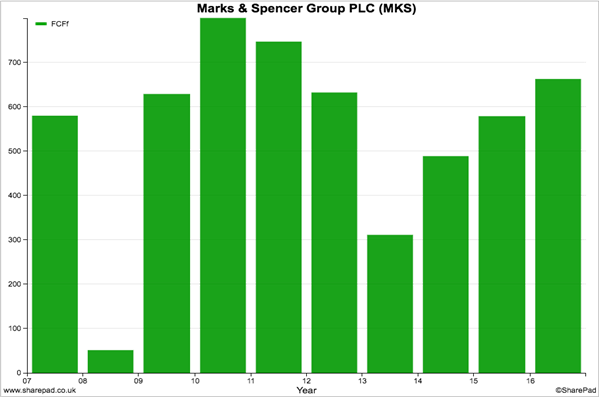
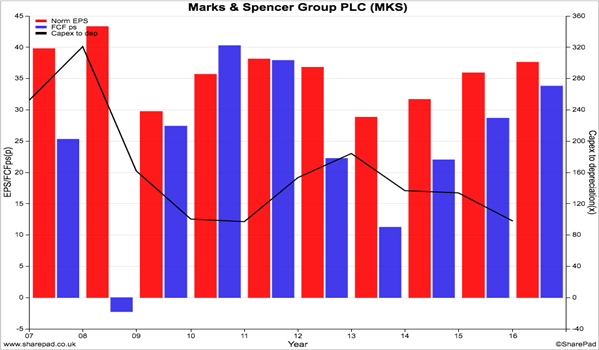
M&S's profit quality also looks reasonable as most of its earnings per share (EPS) has been turned into free cash flow per share. The black line on the chart above shows that M&S has been spending less on new assets (capex) and this has been very helpful in boosting its free cash flow.
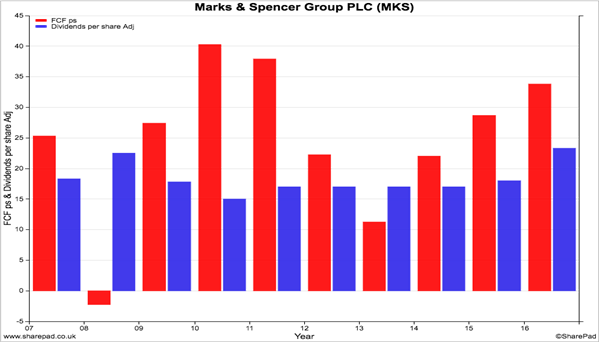
Cash dividend cover
Dividends to shareholders were cut in 2009 but have been increasing since then. The good news for shareholders is that the company's free cash flow per share has been generally larger than the dividend per share and might give some confidence that the dividend is safe despite the current tough trading backdrop.
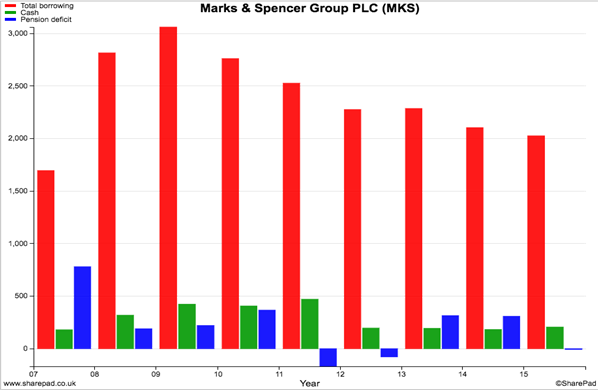
Debts
Total borrowings have been coming down in recent years which is a good sign. A reasonably large pension fund deficit back in 2007 has been plugged and has now been turned into a surplus (i.e. the pension fund's assets are currently greater than its liabilities).
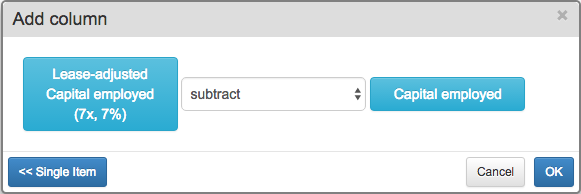
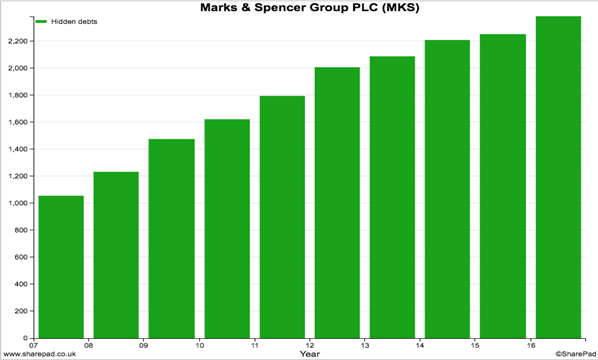
You can use ShareScope to estimate the value of hidden or off-balance sheet debts which arise from renting rather than owning shops. You do this by taking the calculation for lease-adjusted capital employed and subtracting the unadjusted value.
You can see from the chart below that the value of hidden debts has been increasing as new stores have been opened. This trend needs to be watched closely as profits are expected to fall this year.
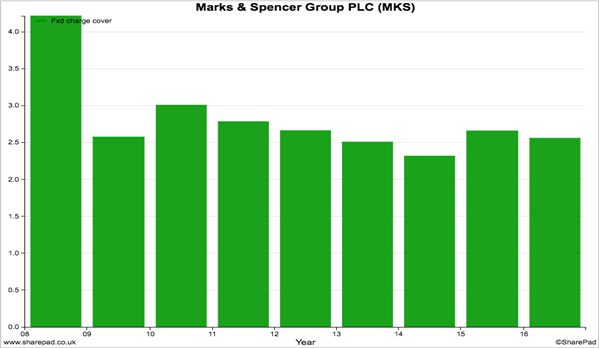
Fixed charge cover
The fixed charge cover ratio tells you how well a company's profits can cope with paying its rents and the interest on its debts. Based on last year's profits, fixed charge cover is at a comfortable level. The ratio is likely to fall this year as profits fall but is unlikely to reach worrying levels of 1.3 times or less.
Valuation & future prospects
If its recent first quarter trading statement on 7th July is anything to go by, M&S is struggling. Clothing and Home sales fell by 8.9% on a like-for-like basis whilst food sales also fell.
M&S is cutting prices in its clothing and homeware ranges and is having fewer promotions. This might be to address the problem that its prices are too high compared to its competitors. The problem for M&S and other retailers is that they have a lot of fixed costs (such as wages and rents) but the value of what they are selling is falling. This makes it very hard to grow profits.
City analysts are expecting no sales growth in 2017 and not much thereafter. Trading profit (EBIT) is forecast to fall sharply as profit margins fall, again with not much, if any, pickup expected in 2018 and 2019. Normalised EPS is expected to fall by 20% on the back of falling profits and a higher tax rate on those profits.
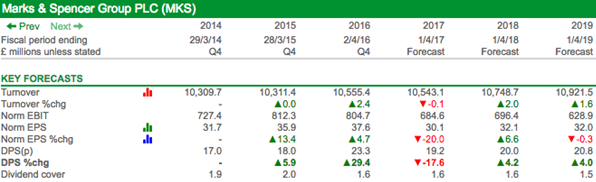
Underlying dividends are expected to keep on growing, but last year's 23.3p per share payout included a one-off, special component of 4.6p which probably won't be repeated.
So given this difficult backdrop, it is not surprising to see M&S's share price languishing near a five year low. But are the shares cheap or expensive?
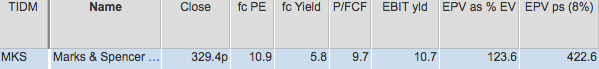
The shares do not look expensive. A forecast dividend yield of 5.8% is probably safe for now unless trading takes another turn for the worse. A price to free cash flow multiple of 9.7 times might look cheap to some investors as well.
An interesting angle on M&S's current valuation is its earnings power value (EPV) - an estimated value per share if a level of trading profits continued forever. If M&S could maintain last year's EBIT of £804.7m forever then based on an investor requiring a return of 8%, ShareScope gives an estimated EPV per share of 422.8p compared with a current share price at the time of writing of 340p. That's an upside of nearly 27%.
But we know that M&S isn't going to make £804.7m this year. The consensus of City analysts is currently predicting £684.6m whilst M&S is saying that its tax rate will increase from 17% to 20%. This will reduce its EPV to 333p as shown below and suggests that M&S shares are no bargain at the moment.
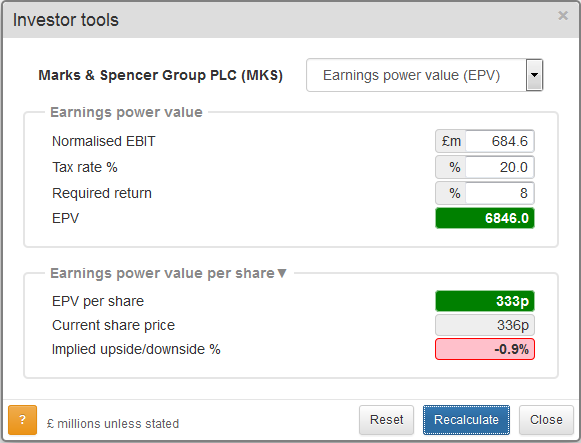
Note that ShareScope is being generous to M&S by adding its pension fund surplus of £440.3m to the value of its equity. This boosts M&S's EPV by 27p per share. This money might not be available for shareholders and it is usually sensible to assume that it is not.
What this EPV analysis is probably telling us is that M&S needs to start growing its profits again to look cheap. That is, if its forecast profits were higher, the EPV would be higher and represent a reasonable upside from the current share price. A lot will depend on the success of its strategy for clothing which has proven to be very difficult to get right. Its food business is doing well and the company will be hoping for continued success and further growth from 450 new Simply Food stores that it is opening between 2016 and 2019.
Alternatively, if investors lower their required return, this too would value the shares higher. Given the interest rates on bonds and savings accounts this scenario is possible.
To sum up
- M&S has been struggling to grow its profits since 2008.
- ROCE has declined significantly since then.
- Despite this, free cash generation has been reasonable and profit quality has been generally good.
- Dividends have been comfortably covered by free cash flow and probably will continue to be so in 2016/17 as long as trading does not deteriorate further.
- Its clothing business is struggling but food has been doing better.
- Falling prices across clothing and food may give M&S a profit problem given that it has lots of fixed costs.
- Total borrowing has been falling but off-balance sheet debt has been increasing.
- The final salary pension fund is in surplus and removes a key risk for investors.
- Fixed charge cover is reasonably healthy and should remain so as long as profits don't fall further than analysts currently expect.
- Sales and profits might struggle to grow over the next few years.
- On some measures, the shares could be cheap.
- The EPV analysis suggests that M&S has to grow its profits or investors have to be prepared to value those profits more highly for the shares to fall into bargain territory.
This article is for educational purposes only. It is not a recommendation to buy or sell shares or other investments. Do your own research before buying or selling any investment or seek professional financial advice.

