Discover
the advantage...
with
the advantage...
with
Become a better investor with ShareScope
ShareScope is an all-in-one platform for private investors and traders, providing in-depth data on everything from shares, funds, ETFs and more across the UK, US, Cananda and Europe.
With your subscription you get live updates from UK Alliance News and RNS, US & Canada News and access to powerful stock screening and portfolio management tools.
Described as "a Bloomberg terminal for private investors" by MoneyWeek and voted the UK's Best Investment Research & Data Software 2024 by Investors' Chronicle and the Financial Times, ShareScope is the multi award winning essential toolkit for the serious investor.
Customers tell us that their performance gains and cost-savings far exceed the subscription price. Compare us to our nearest alternatives
"ShareScope is one of those tools which, once you've tried it, you simply can't see how you'd do without it." Muhammad - Trustpilot
Everything in one place for Private Investors
- UK, US, CAN & EU stocks (all included as standard)
- Funds, investment trusts, exchange traded funds (ETFs)
- Global market indices, commodities, bonds, forex and cryptocurrencies
- Live UK news, RNS & alarms | Live US & CAN news & alarms
- Unrivalled filtering & stock screening
- Superior, unlimited portfolio management
- Use anywhere - Windows PCs & laptops, MacBooks, iPads, Android tablets, mobile
- A huge suite of financial,charting and technical analysis tools
- UK LSE Level 2 (Pro version only)
- Book FREE one-to-one training with a ShareScope expert to use the program to your full advantage as quickly as possible.
"Every bit of information you might need at your fingertips. Best of all, you can get help every step of the way." M.J - Trustpilot
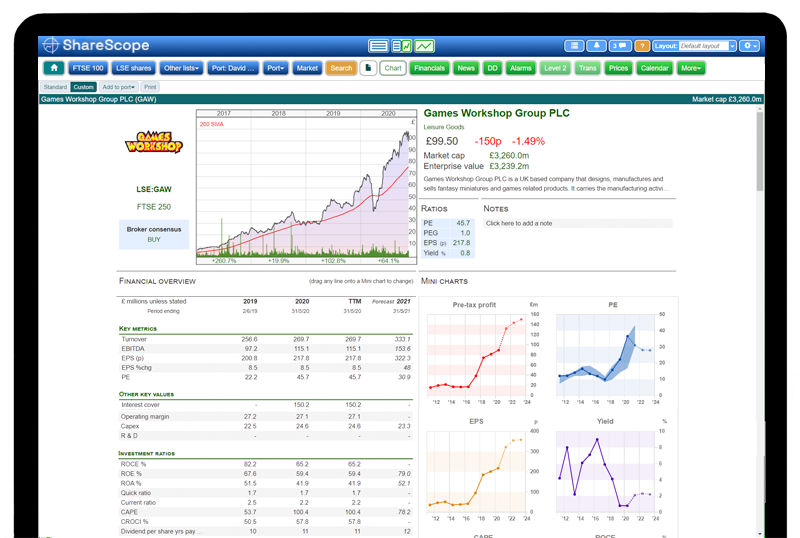
Stock performance at a glance
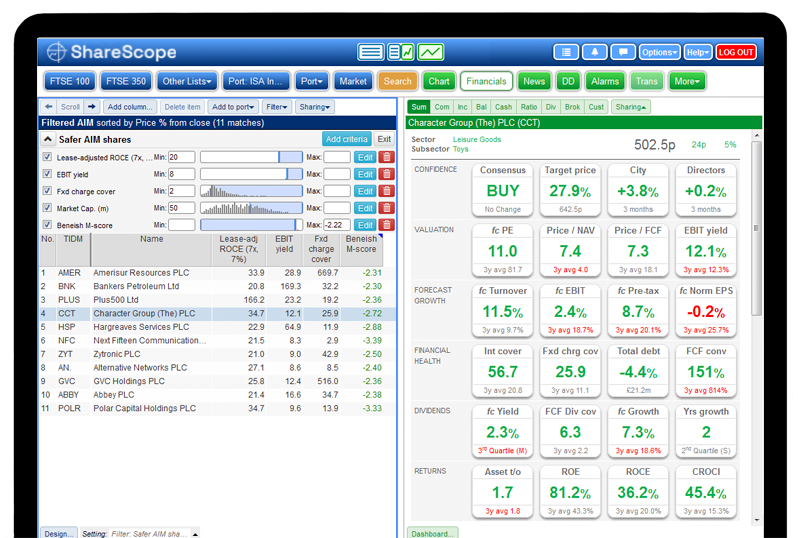
We know there are a lot of investment opportunities out there. That's why we've created the Single page summary.
The Single page summary shows all the key information about a stock, fund, investment trust or ETF on one scrollable page. This allows you to get a quick overview before digging into some deeper analysis in the rest of ShareScope.
The single page can be set as a full screen view or in a split screen view to quickly click through a watch list or portfolio.
Our custom mode even allows you to create your own single page summary to display the information you want.
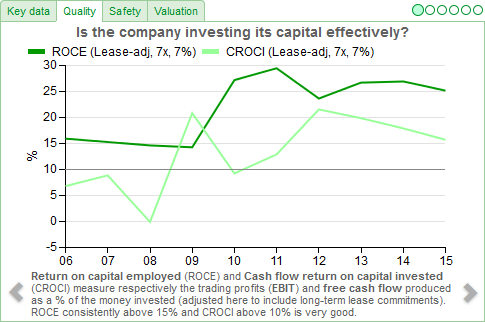
Dig a little deeper
Once you've identified a stock for further investigation, ShareScope's Carousel walks you through the key financial characteristics of each share in more detail.
Around 20 financial charts arranged on four tabs - Key data, Quality, Safety and Valuation - are accompanied by guiding text from Phil Oakley. The carousel is designed to help you learn the key questions to ask and how to interpret the data. You'll learn how to spot tell-tale trends which could signal future trouble.
We believe that the key to investment success is understanding what you are buying. ShareScope's superb Dashboard and Carousel will help you become a more successful stock-picker.
Unrivalled filtering & screening
Filtering, or stock screening, enables you to search the stock market for companies that match specific criteria - in seconds. You only need a limited understanding of financial results and ratios to start finding shares with attractive characteristics.
Here's why ShareScope is better than other stock screening services:
- More data history
- More criteria
- Technical (charting) criteria
- Filter for funds as well
Click here to read more about ShareScope's powerful filtering.
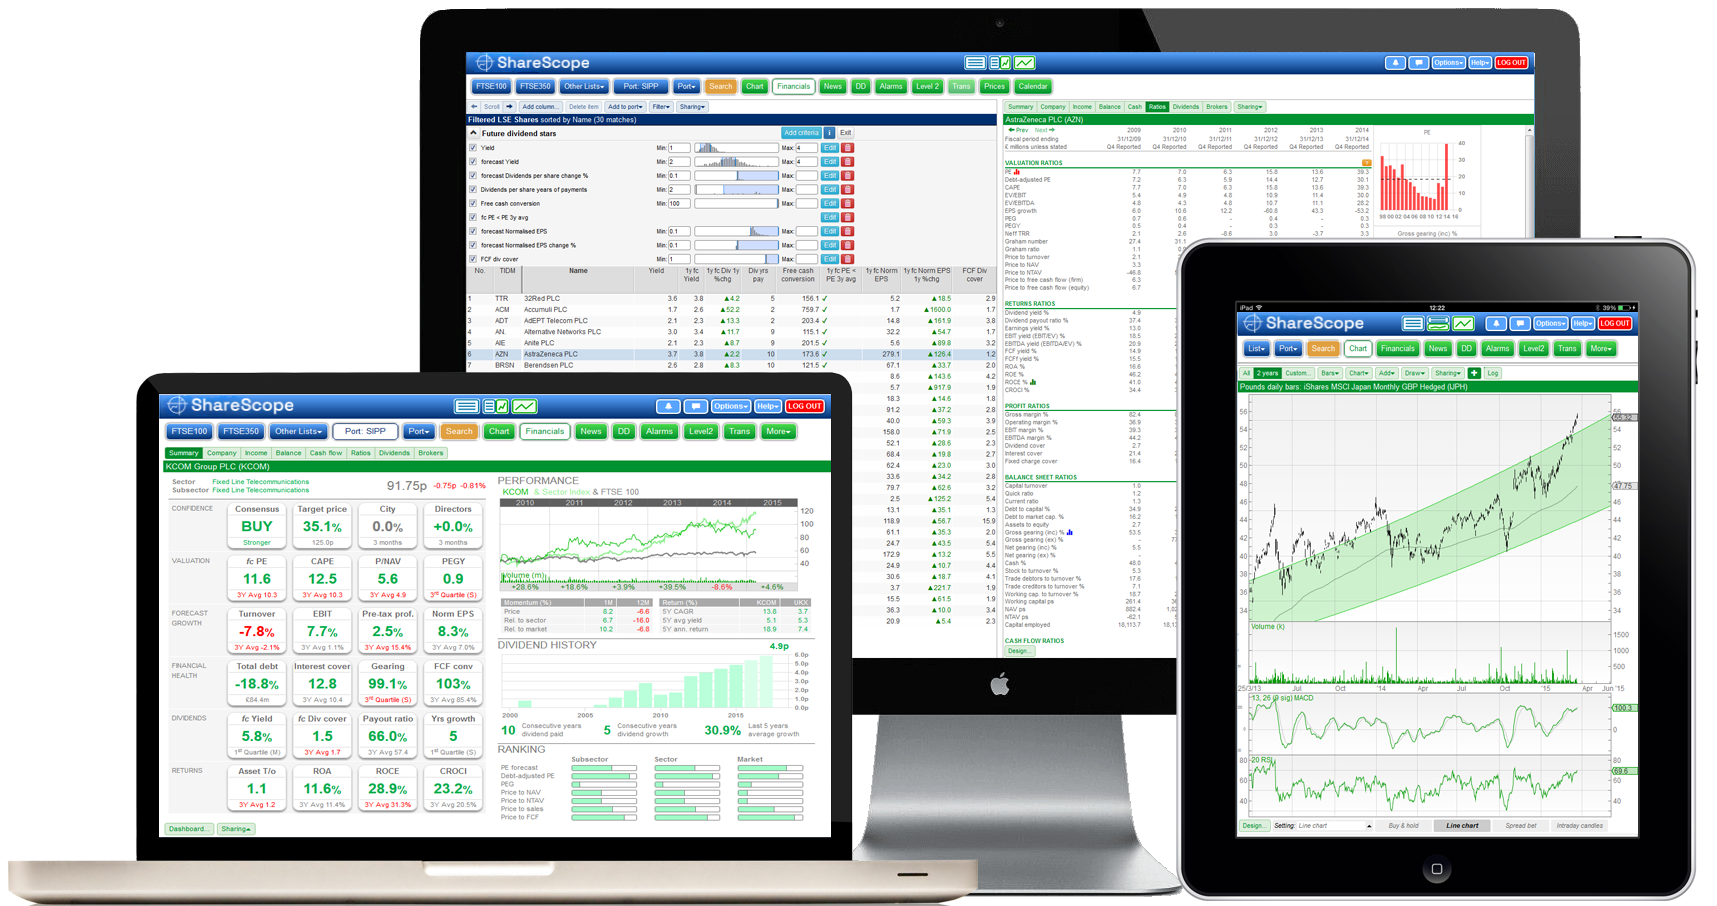
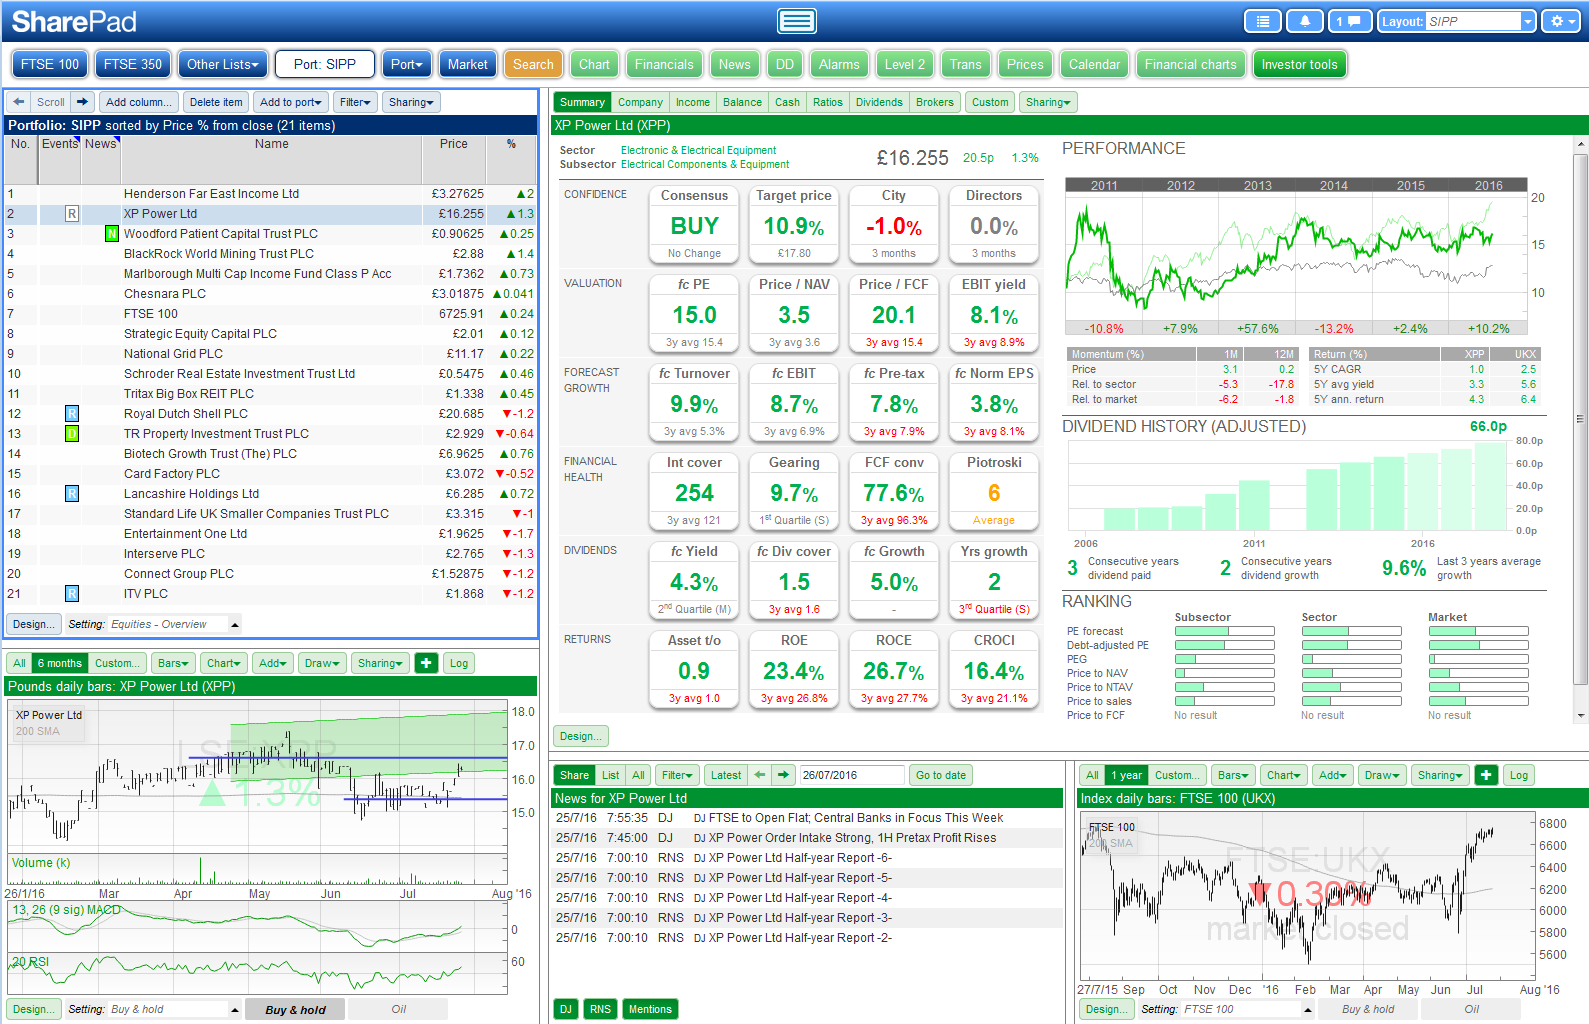
So easy to use
Our aim is to make investment research fast and easy. ShareScope's flexible split-screen format means that you can scroll down a list of shares on the left hand side of the screen and see the chart or financials for each stock on the right hand side of the screen.
The instant company search & display function allows you to type a company name or identifier straight into the keyboard.
Now with customisable multi-window layouts, ShareScope enables you to create data-rich workspaces for your investment research, portfolio management, stock screening and trading. Click here to see an example.
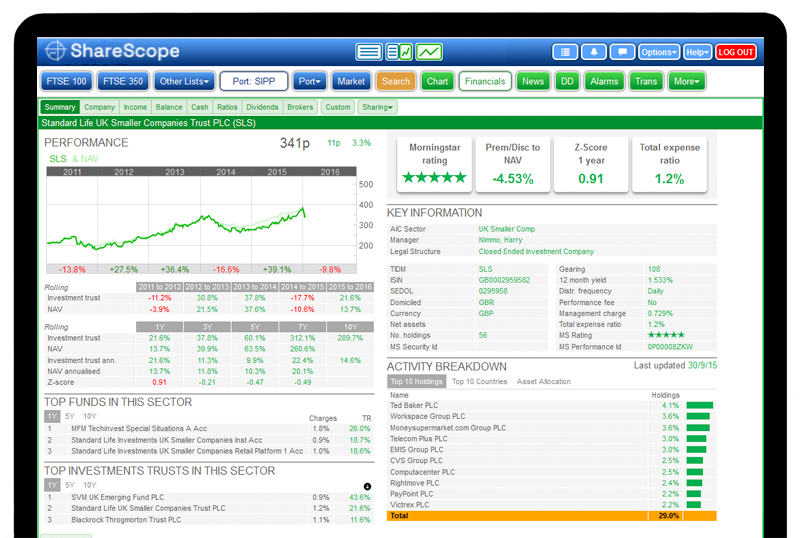
Easier to manage all your investments
Many investors diversify their portfolio by investing in foreign markets and alternative asset classes like bonds and property. ShareScope includes information on funds, investment trusts, exchange traded funds (ETFs) and retail bonds so you can decide which offer the best value for money.
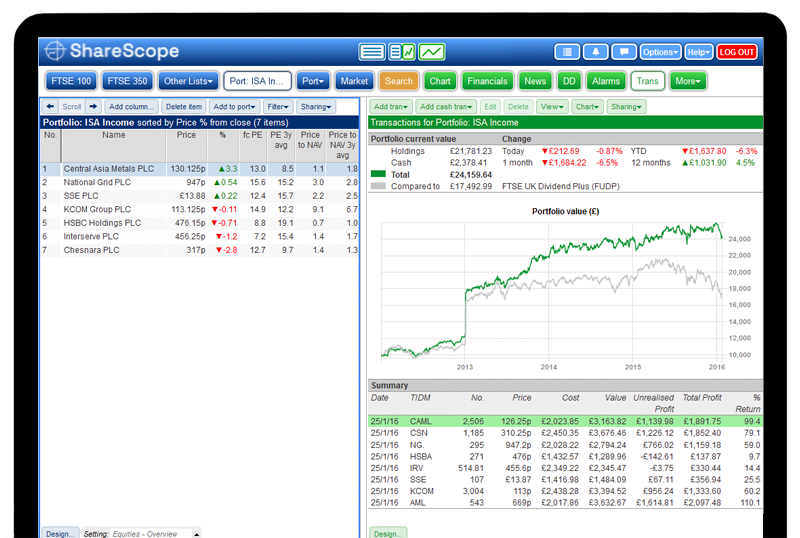
Superior portfolio management
Why do broker accounts offer so little information on your performance? ShareScope's portfolio tools give you much greater control.
Create portfolios containing all your investments - shares, funds, investment trusts, ETFs and bonds. Record all your transactions including costs. ShareScope will automatically record dividend payments for you.
Choose a suitable benchmark index for each of your portfolios and monitor your performance on your portfolio chart.
Click here to discover four ways ShareScope makes it easier to manage your portfolios successfully.
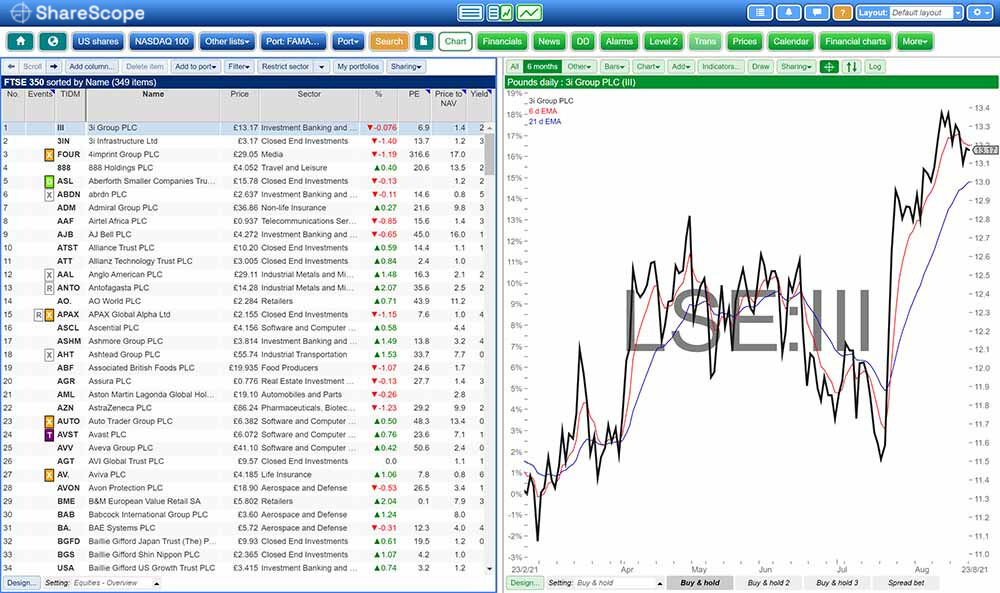
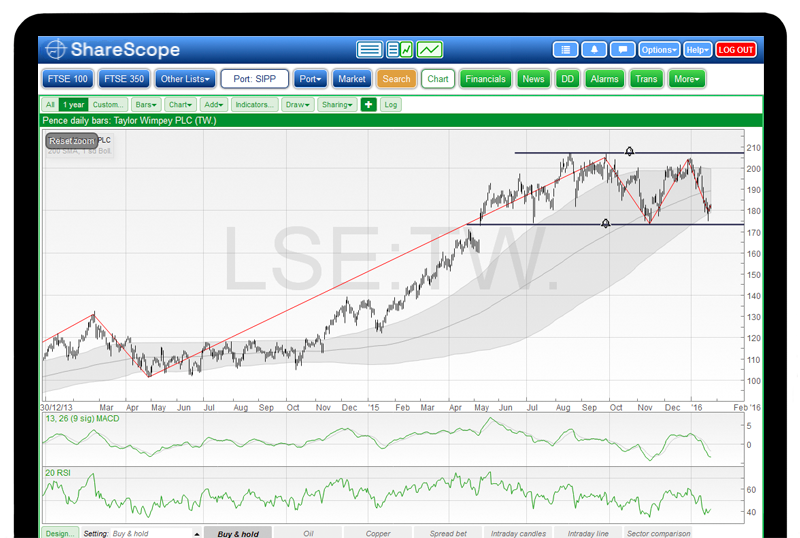
Superb charting
If you are an investor who keeps a close eye on chart trends, or trades via a spread betting account, you'll love ShareScope's charts.
From moving averages and momentum indicators to advanced analytics like Bollinger bands, Fibonacci retracement, Ichimoku, and Point & Figure, ShareScope enables you to create multiple chart views which you can switch between with a single click.
Set bar sizes from 1 month to 1 minute
Set alarms for favourite trading signals like golden crosses.
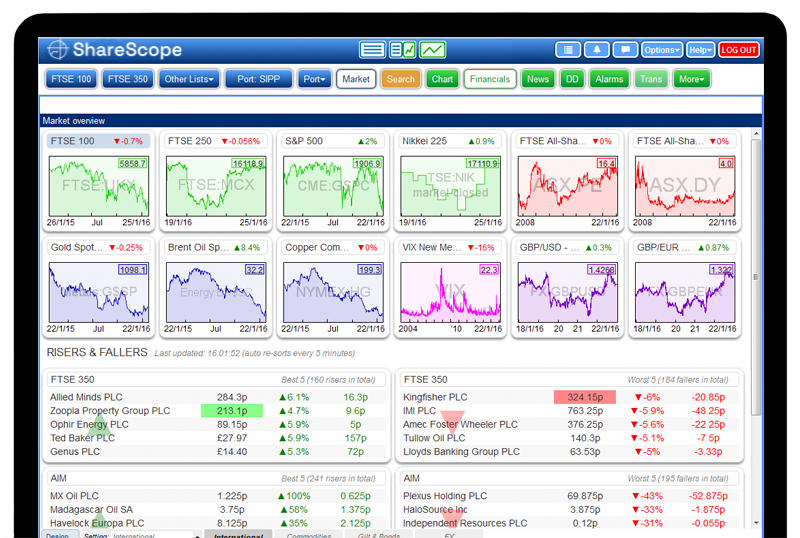
Keep abreast of the broader investing environment
ShareScope includes a broad range of market data - UK and US shares, global indices, funds, bonds, commodities, currencies and economic indicators. Our Market Overview provides an easy way to see what's happening around the world - a great place to start first thing in the morning. You can customise this view to display the information you are most interested in. For example, add the top risers and fallers in your portfolios.
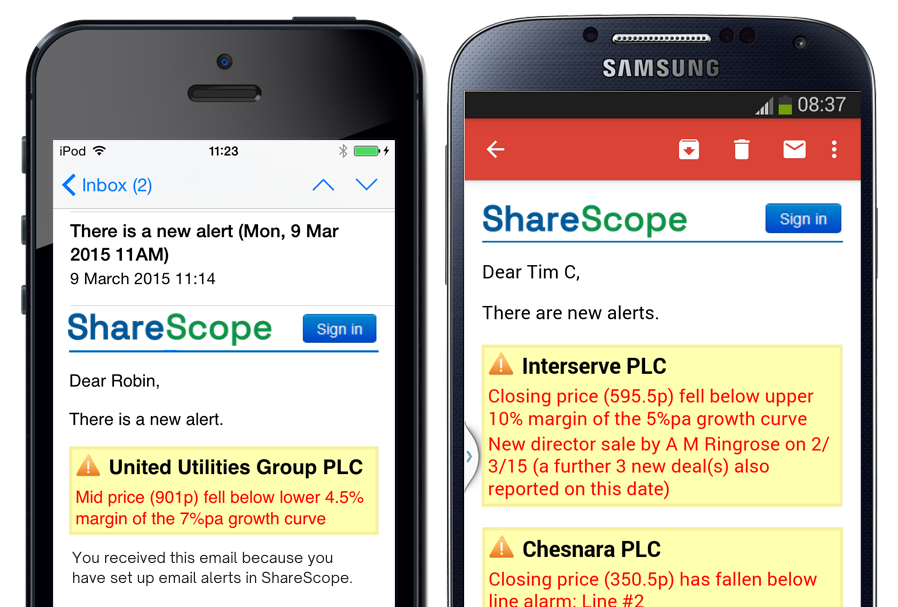
Use alarms to make sure you can react fast to significant events
To save you having to check your investments all the time, ShareScope lets you set alarms to inform you of unexpected price movements and events that could affect the value of your investments (e.g. news stories, a reduction in profit forecasts, directors selling shares). Receive alerts on your phone via email so you can react quickly wherever you are.
Explore the full order book
Our real-time service, ShareScope Pro, includes Level 2 for the London Stock Exchange. Our smart Level 2 display includes a summary order book, VWAP calculator, order volume graph and trade list as display options.

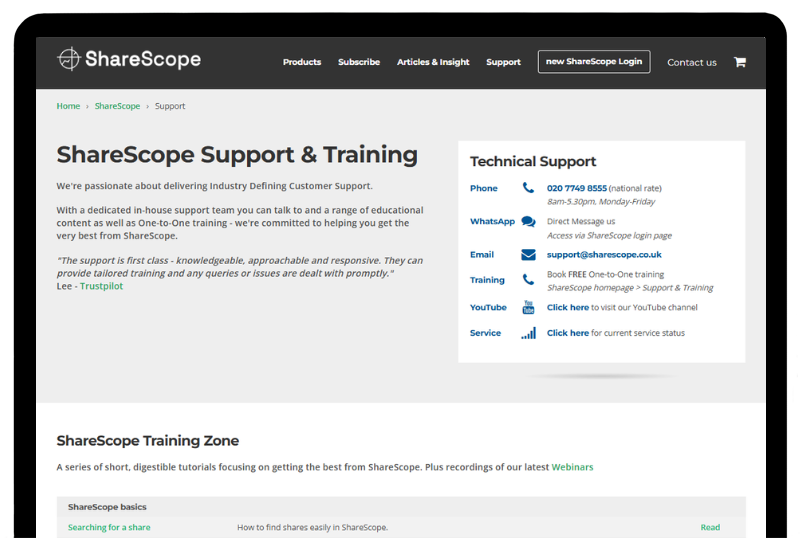
Unbeatable personal service
Whilst other companies route your support queries abroad or only respond by email, our friendly in-house customer support team is dedicated to helping you get the best out of ShareScope.
On the phone or email as often as you need them between 8am - 5.30pm, Monday-Friday. No question too big or small.
We actively encourage customers to call as often as they like.
We also offer a free one-to-one training call with one of our experts. Just book online and an expert will call you at your chosen time.
Don't just take our word for it. Click here to read our Trustpilot reviews.
We'll teach you how
Whether you are new to investing or more experienced, our continuous program of plain-English tutorials, live webinars, and videos will help you find quality investments for your portfolio.
Read our free Step-by-Step Guide to Investment Analysis.
Learn how to analyse companies like a professional and beyond with our Training Zone.
Watch our latest videos and webinars on our YouTube channel.
Receive regular articles from esteemed writers on investment technique.